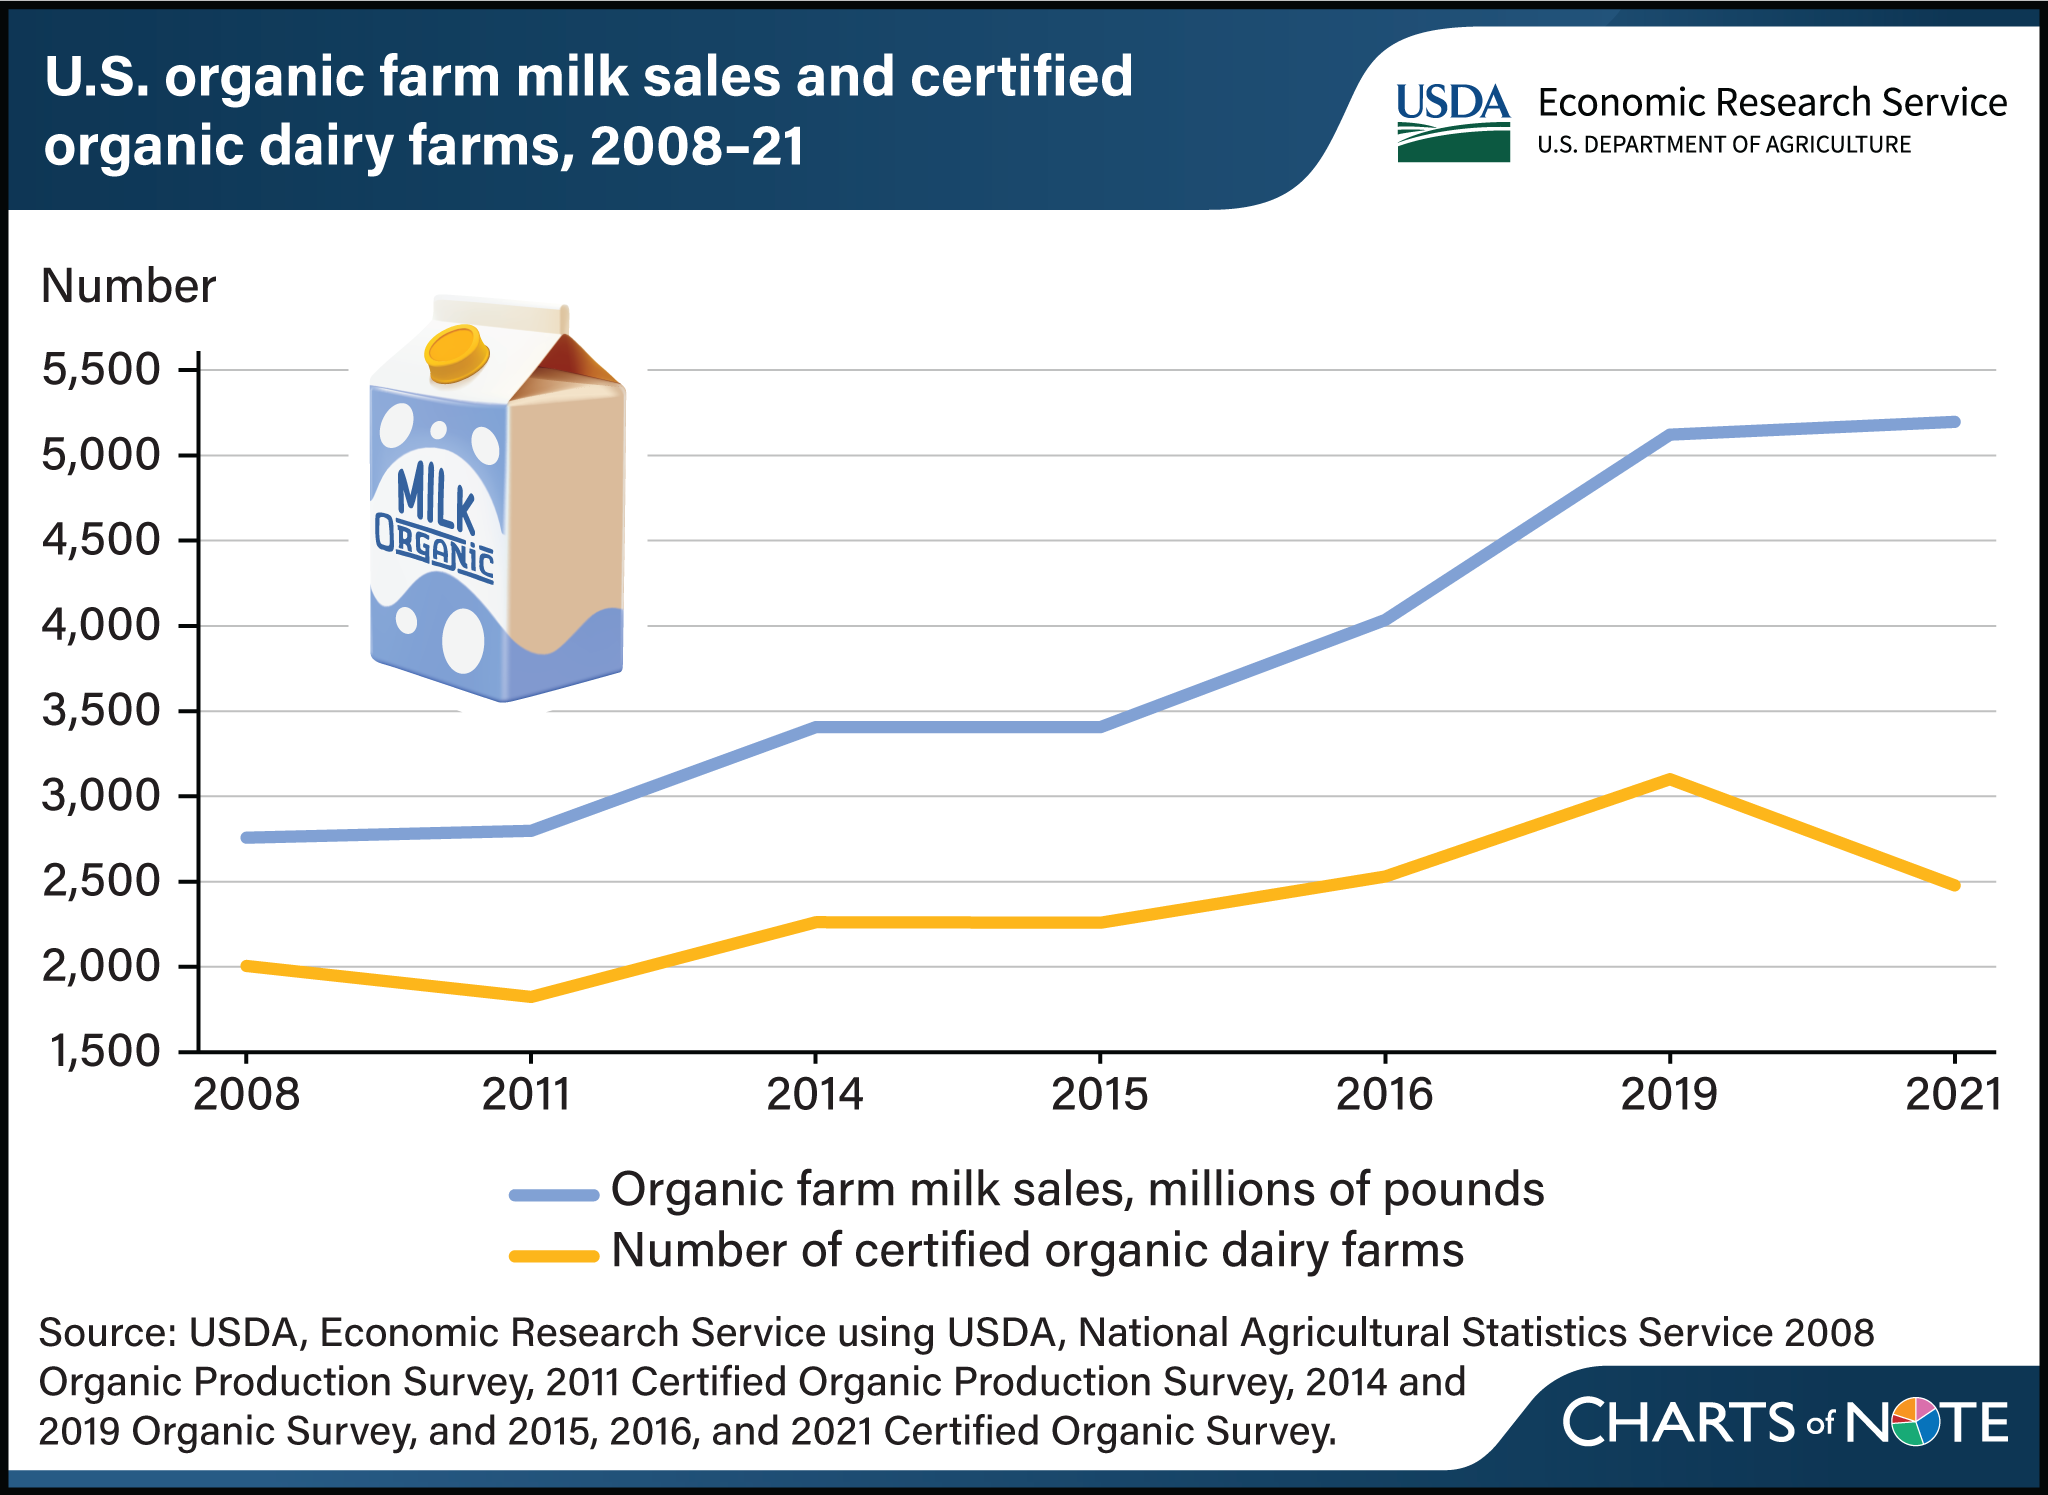
Organic farm milk sales rise even as recent farm numbers show contraction
- by Jeffrey Gillespie
- 11/14/2024

The U.S. organic milk sector has expanded over the past three decades. In response to increased consumer demand for organic milk, producers increased the U.S. organic milk cow inventory from 2,265 cows in 1992 to 352,289 cows in 2021. This growth was paralleled by a rise in farm-level sales of organic milk, which grew by 88 percent from 2008 to 2021. Organic farm milk sales increased as a percentage of all U.S. farm milk sales from 1.5 percent in 2008 to 2.3 percent in 2021. Similarly, the number of organic dairy farms rose from 2008 to 2019, supporting higher production levels. From 2019 to 2021, however, the number of U.S. organic dairy farms selling milk decreased, with increasing milk production capacity offsetting the decline in farms. This chart is drawn from the USDA, Economic Research Service report, U.S. Certified Organic Dairy Production: Three Decades of Growth.

