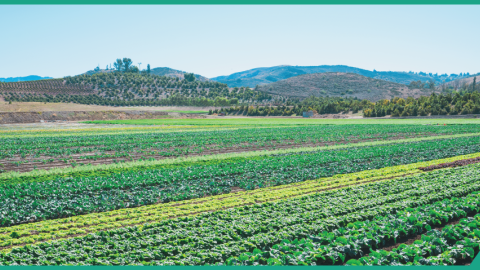
Consumer demand for organically produced goods has shown strong growth since the 1990s, providing market incentives for U.S. farmers across a broad range of products.
- According to USDA, National Agricultural Statistics Service (NASS) surveys (2011 and 2021), certified organic cropland acres increased by 79 percent (to 3.6 million acres), pastureland/rangeland decreased by 22 percent (to 1.3 million acres), and certified operations increased by more than 90 percent (to 17,445 farms) over the 2011–21 period.
- Conventional grocery retailers are the primary outlets for organic food sales, surpassing natural food stores in the mid-2000s. By 2020, traditional grocery stores, club stores, and supercenters accounted for 56 percent of the share of organic food sold to consumers (Organic Trade Association, 2021).
- A typical organic food consumer is difficult to pinpoint, with organic consumers coming from all types of consumer demographics.
- Organic price premiums remain high in many markets as the demand for organic products increases. However, wholesale premiums for select organic fruits and vegetables have declined in recent years. See Organic Situation Report, 2025 Edition.
- The U.S. Department of Commerce began tracking selected organic products in 2011, with the tracked values of organic imports steadily increasing.
Sales Increase in All Organic Food Categories
USDA does not have official statistics on U.S. organic retail sales, but information from the Organic Trade Association (OTA) shows that U.S. sales of organic food products were an estimated $38.6 billion in 2012 (inflation adjusted to 2024 dollars) and reached $65.4 billion in 2024 (OTA, 2025). Inflation-adjusted organic sales increased for the first time in 2024 since 2020’s peak.
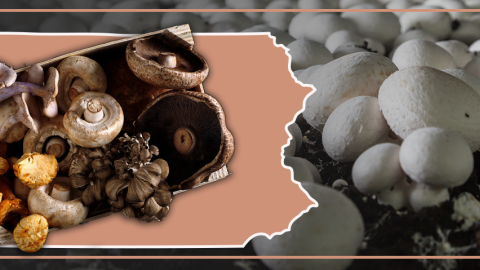
Sales of fresh fruits and vegetables have been the top category of organically grown food since the organic food industry started retailing products. Retail sales of organic fresh fruits and vegetables were an estimated $21.5 billion in 2021 and have steadily trended upward for the past two decades (Nutrition Business Journal, 2022). Produce accounted for 33 percent of U.S. organic food sales in 2024.

Download chart image | Chart data
According to NASS surveys, organic milk production increased by 1 percent from 2019 to 2021 (to 5.2 billion pounds), with the market share of organic fluid milk declining since 2016 (Information Research, Inc., 2021). Organic soymilk is the most-sold organic plant-based milk, followed by organic almond milk (Information Research, Inc., 2021). Almond milk began to rise in popularity in the early 2010s, but organic almond milk did not significantly enter the market until 2014 (after almond producers finished the 3-year process of transitioning to organic production).
According to the Organic Trade Association, 55 percent of organic sales occur through mass market retail, while more than 33 percent of sales occur through natural and specialty retail stores. The remainder of sales occur through farmers markets, Community Supported Agriculture (CSAs), other direct-to-consumer sales, and internet sales. The share of organic food sold to consumers via the internet has grown from 2 percent in 2012 to 6.7 percent in 2024 (Organic Trade Association, 2025).
Prices of Organic Products Remain Higher Than Conventional Counterparts
Over the last decade, USDA's Agricultural Marketing Service (AMS) has expanded wholesale and shipping point price reporting for organic fruits and vegetables and added new price reports on organic grains, poultry and eggs, and sales volume for milk. Prices for organic products continue to be higher than for their conventional counterparts. Key sources of AMS data include:
- AMS Market News publishes Terminal Market and Shipping Point. Terminal (wholesale) market prices represent Free on Board prices received by wholesalers. Shipping point data cover major fruit and vegetable growing areas, provide movement data via rail and truck shipment domestically and from Mexico, and represent open market sales by first handlers.
- AMS began publishing the annual Organic Cotton Market Summary in 2010, which reports organic cotton prices for the marketing year.
- AMS Market News began reporting organic poultry prices in the weekly Organic Poultry and Eggs Report in January 2004. The report tracks prices paid to poultry or egg companies by the first receiver (such as a retailer, distributor, or manufacturer).
- In January 2006, AMS began reporting sales of organic fluid milk products (in volume) and reports them in the Organic Dairy Fluid Overview report.
- In January 2007, AMS began biweekly regional price reporting on organic grains and now publishes a single national grain and feedstuffs report available through the National Organic Grain and Feedstuffs Report.
In recent years, the wholesale price premium of select fruits and vegetables has declined, particularly for strawberries, spinach, and apples. See the ERS report, Organic Situation Report, 2025 Edition, for more information. At the retail level, organic products typically receive a price premium over non-organic products. An ERS study analyzed organic retail price premiums for 18 products from 2004 to 2010 and found the premium to be more than 20 percent for 17 products. The study found that premiums fluctuated year to year without a clear trend—except for spinach, canned beans, and coffee—which showed a steady decrease in the premium, and yogurt, which showed a steady increase from 2004 to 2010. Sales for organic products with lower premiums (such as spinach, granola, and carrots) saw larger increases in market share. See the ERS report, Changes in Retail Organic Price Premiums from 2004 to 2010, for more information.
Production Costs are Higher for Organic Relative to Conventional Products
On average, U.S. organic farms have higher production costs than conventional farms, although organic price premiums over conventional products at the farm and retail level may give farmers the opportunity to recover the elevated cost of production of farming organically.
Through analysis of USDA’s Agricultural Resource Management Survey (ARMS) data, ERS compared the costs of production and returns for organic and conventional production in major crop/livestock sectors, and analyzed other economic characteristics of organic agriculture.
See these ERS reports for more information on organic versus conventional production costs and returns:
- U.S. Certified Organic Dairy Production: Three Decades of Growth
- Sources, Trends, and Drivers of U.S. Dairy Productivity and Efficiency
Organic Consumers Are Increasingly Mainstream
There are numerous studies on the buying habits and demographics of consumers of organic foods. Results have varied depending on the type of survey, sample size, and geographic coverage. However, studies show that organic food consumers include all types of consumer demographics. A study from the Organic Trade Association (using data from a large, nationally representative sample of U.S. households) found that more than 80 percent of U.S. households purchased organic food in 2016. A consistent finding across studies is that millennials (born between 1981 and 1986−87) are more likely to purchase organic food than older generations.
Consumers may prefer organically produced food because of their views regarding health, the environment, and animal welfare. Organic consumers show a willingness to pay the higher prices established in the marketplace.
Organic Trade Is an Important Outlet for Organic Agriculture
Trade plays an important role in meeting consumer demands for organic products, domestically and abroad. The U.S. Department of Commerce began adding codes for selected organic products to the U.S. trade code system in 2011. The value of organic imports has increased—in part because more products are being tracked—but also because of increases in some of the highest-value imports, such as fresh cultivated blueberries and squash.

Importers of organic products must either be USDA certified or belong to a trading partner with an organic recognition agreement with the United States, which allows foreign Governments to accredit certifying agents to USDA organic standards. The United States has bilateral equivalency arrangements with Canada, the European Union, Japan, Korea, Switzerland, Taiwan, and the United Kingdom. The USDA also authorizes the governments of New Zealand and Israel to accredit certifying agents in their respective countries to the USDA organic standards. In 2021, USDA announced the termination of its recognition agreement with India, determining India’s organic control system insufficient to protect the integrity of the USDA organic seal.