This page provides the following information:
- Frequency of Food Insecurity During the Year
- Prevalence of Food Insecurity and Very Low Food Security, by Reference Period
- Frequency of Food Insecurity During a 5-Year Period
The U.S. Household Food Security Scale is designed to register even occasional or episodic occurrences of food insecurity. Some households may be classified as food insecure or as having very low food security based on a single episode during the year. A more complete picture of the temporal patterns of food insecurity in U.S. households sheds light on the nature and seriousness of the food access problems households face and can aid in the design and management of programs to improve food security.
Frequency of Food Insecurity During the Year
USDA, ERS analyzed responses to questions in the food security survey about how frequently various food-insecure conditions occurred during the year, whether they occurred during the 30 days prior to the survey, and, if so, for how many days. Findings include:
- About one-fourth of households with very low food security at any time during the year experienced it rarely or occasionally—in only 1 or 2 months of the year. For three-fourths of households, very low food security recurred in 3 or more months of the year.
- For about one-fourth of food-insecure households and one-third of those with very low food security, the occurrence was frequent or chronic.
- On average, households that were food insecure at some time throughout the year were food insecure in 7 months during the year.
- On average, households with very low food security at some time throughout the year experienced it in 8 months during the year.
Prevalence of Food Insecurity and Very Low Food Security, by Reference Period
Prevalence rates of food insecurity and very low food security during the 30 days preceding the food security survey were considerably lower than the annual rates. Some households were food insecure only early in the year but not in the 30 days prior to the survey interview.

Download chart data in Excel format
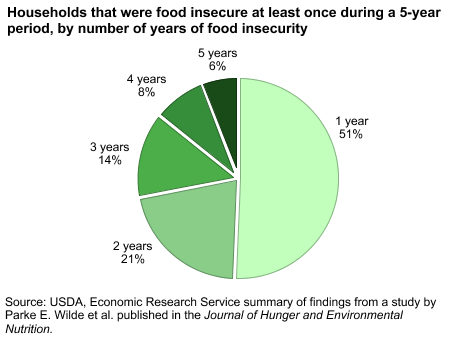
Frequency of Food Insecurity During a 5-year Period
The food security survey, which is the basis for USDA’s annual food security statistics, measures food insecurity for two time periods—1) during the previous year and 2) during the previous 30 days. However, knowing how often and how long households are food insecure over longer time periods is important for understanding the extent and character of food insecurity and for maximizing the effectiveness of programs aimed at alleviating it. Two studies commissioned by USDA, ERS found spells of food insecurity to be generally of short duration (see "Food Insecurity in U.S. Households Rarely Persists Over Many Years," Amber Waves, June 2013). For example, one study found that half of households that were food insecure at some time during the 5-year study period experienced the condition in just a single year, and only 6 percent were food insecure in all 5 years. However, the fact that households move in and out of food insecurity also means that a considerably larger number of households experience food insecurity at some time over several years than in any single year.

