Suggested citation for linking to this discussion:
U.S. Department of Agriculture, Economic Research Service. (2025, September 3). Farm sector income & finances: Farm sector income forecast.
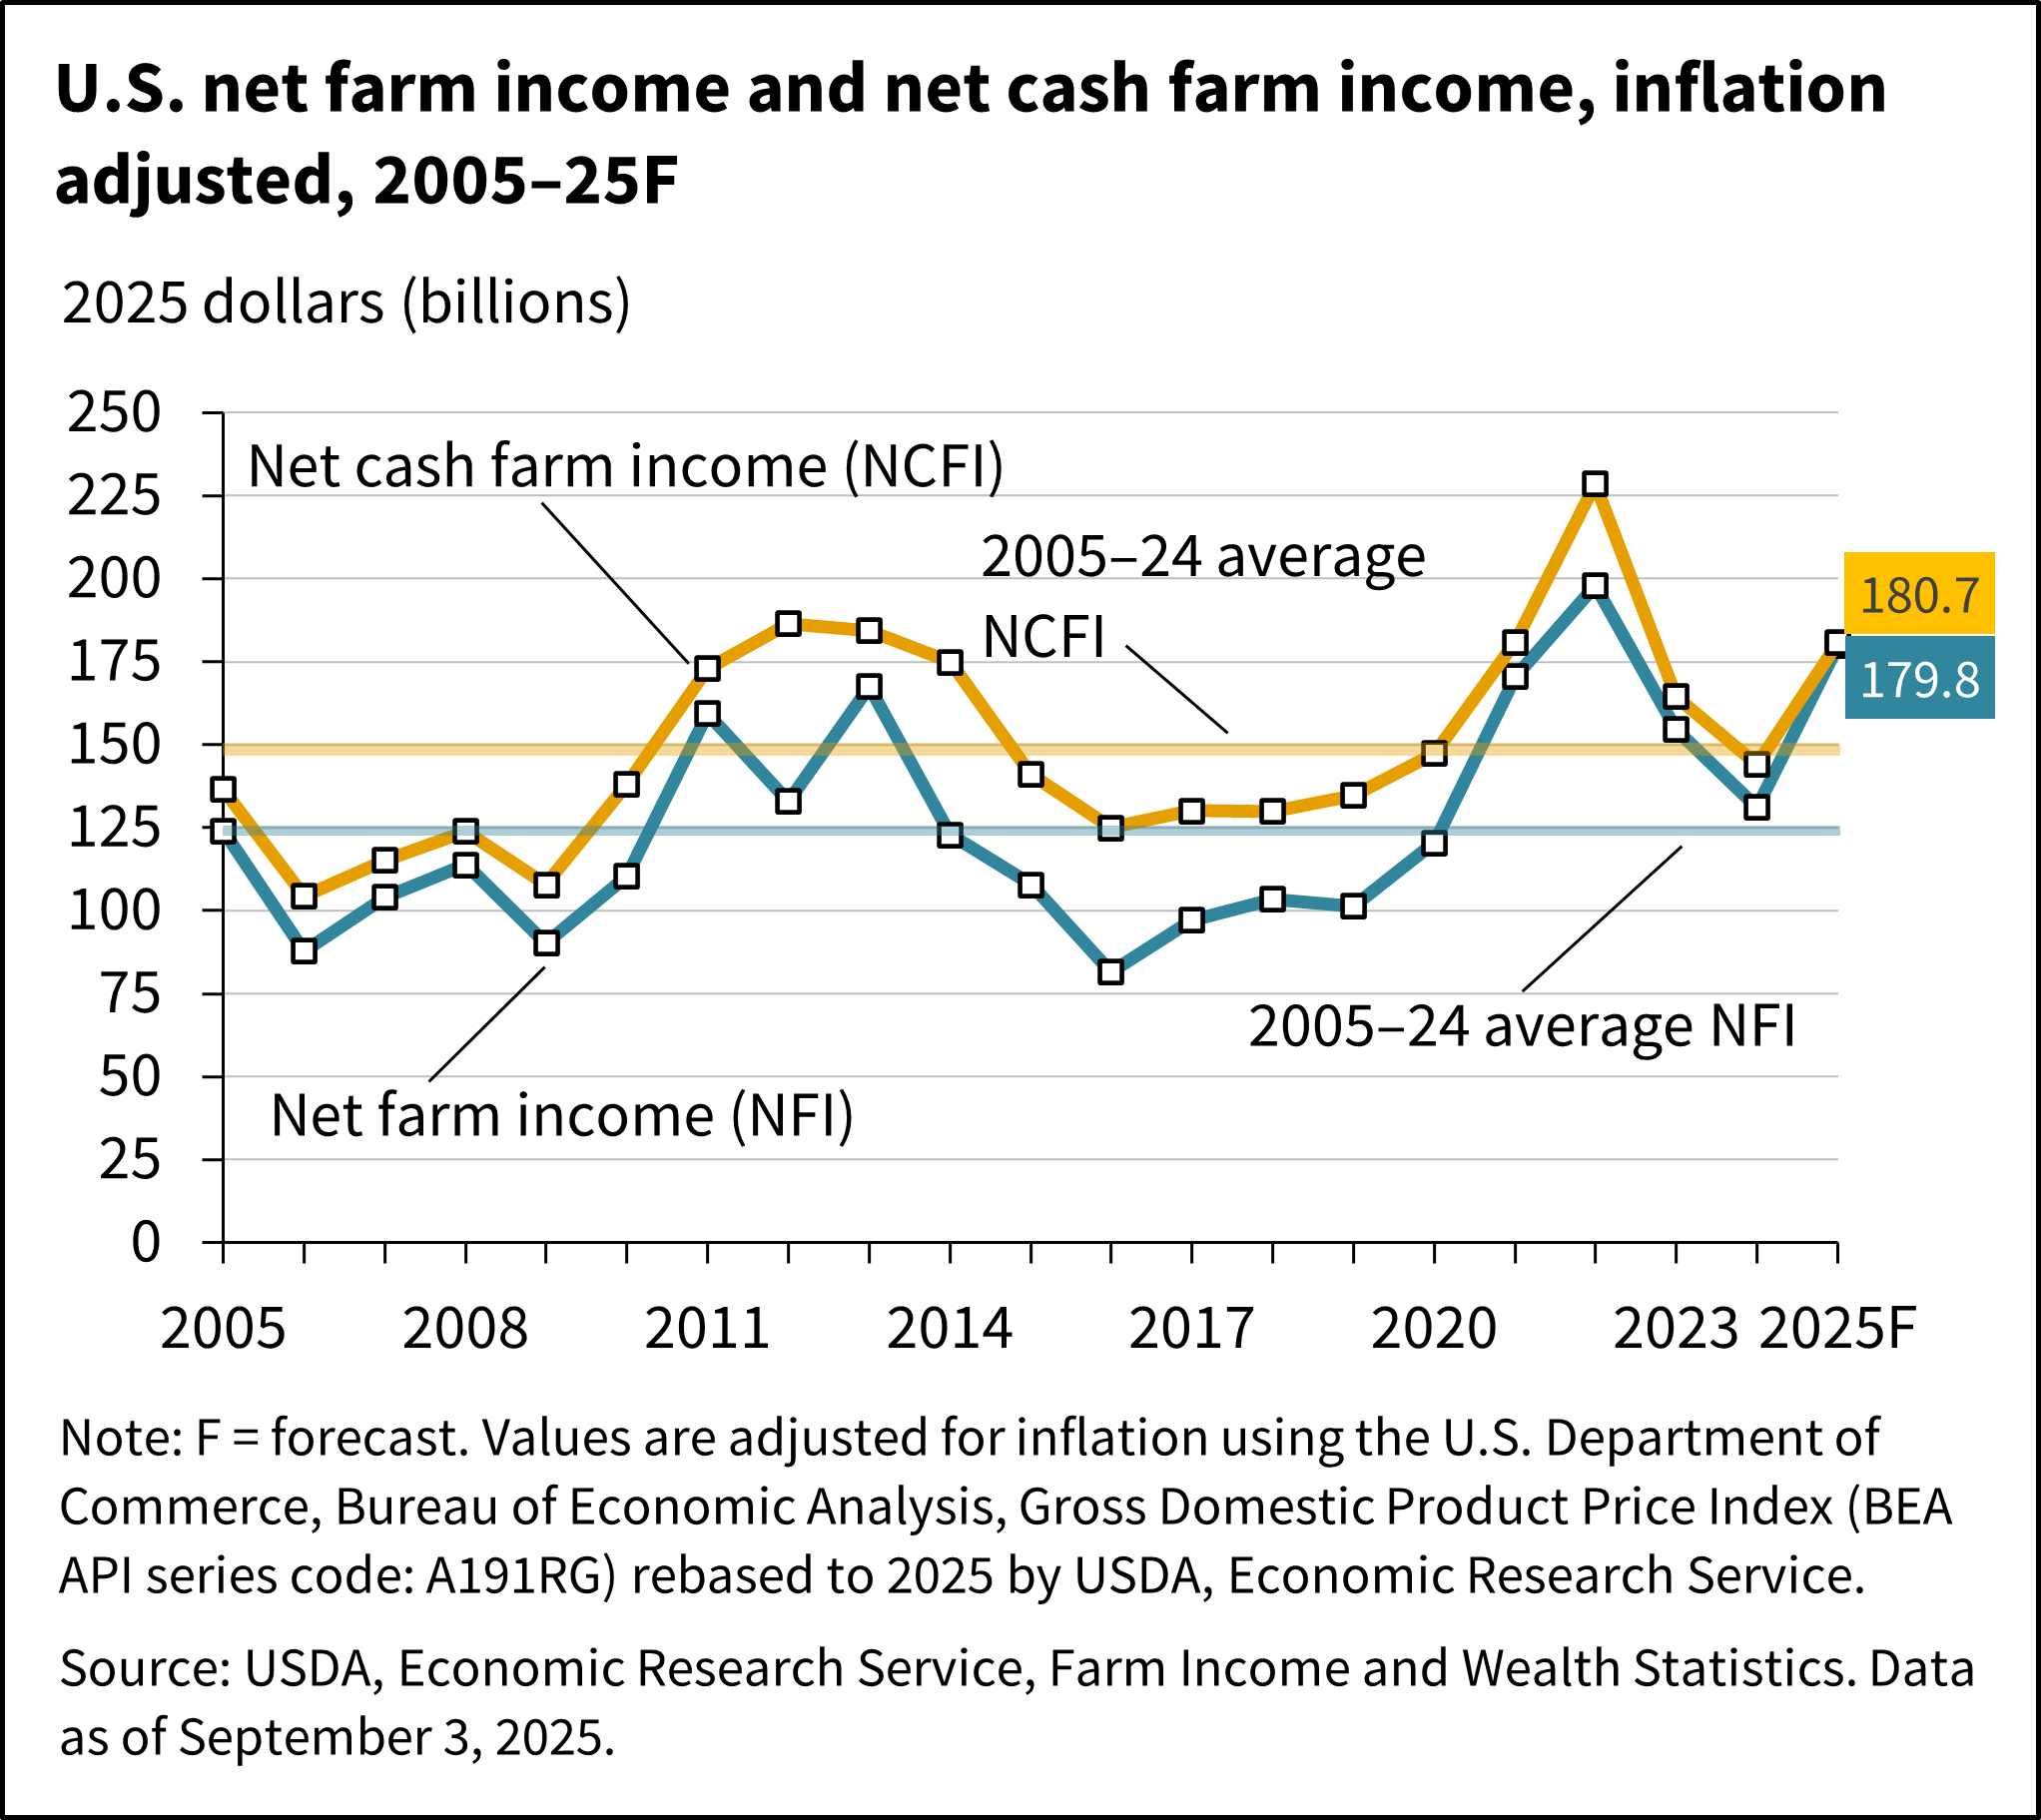
Net farm income, a broad measure of profits, is forecast to increase in 2025. Forecast at $179.8 billion for 2025, net farm income would be $52.0 billion (40.7 percent) higher than in 2024. Net cash farm income is forecast at $180.7 billion for 2025, an increase of $40.1 billion (28.5 percent) relative to 2024 (not adjusted for inflation).
In inflation-adjusted 2025 dollars, net farm income is forecast to increase by $48.8 billion (37.2 percent) from 2024 to 2025, and net cash farm income is forecast to increase by $36.5 billion (25.3 percent) compared with the previous year. If realized, both measures in 2025 would be above their 2005–24 averages (in inflation-adjusted dollars).
See all forecast and estimate data on farm income and wealth statistics or see a summary of the forecasts in the table U.S. farm sector financial indicators, 2018–2025F.
Note: In the text below, year-to-year changes in the major aggregate components of farm income are generally discussed in nominal dollars, although cases are noted where the direction of change is reversed using inflation-adjusted dollars.
Summary Findings
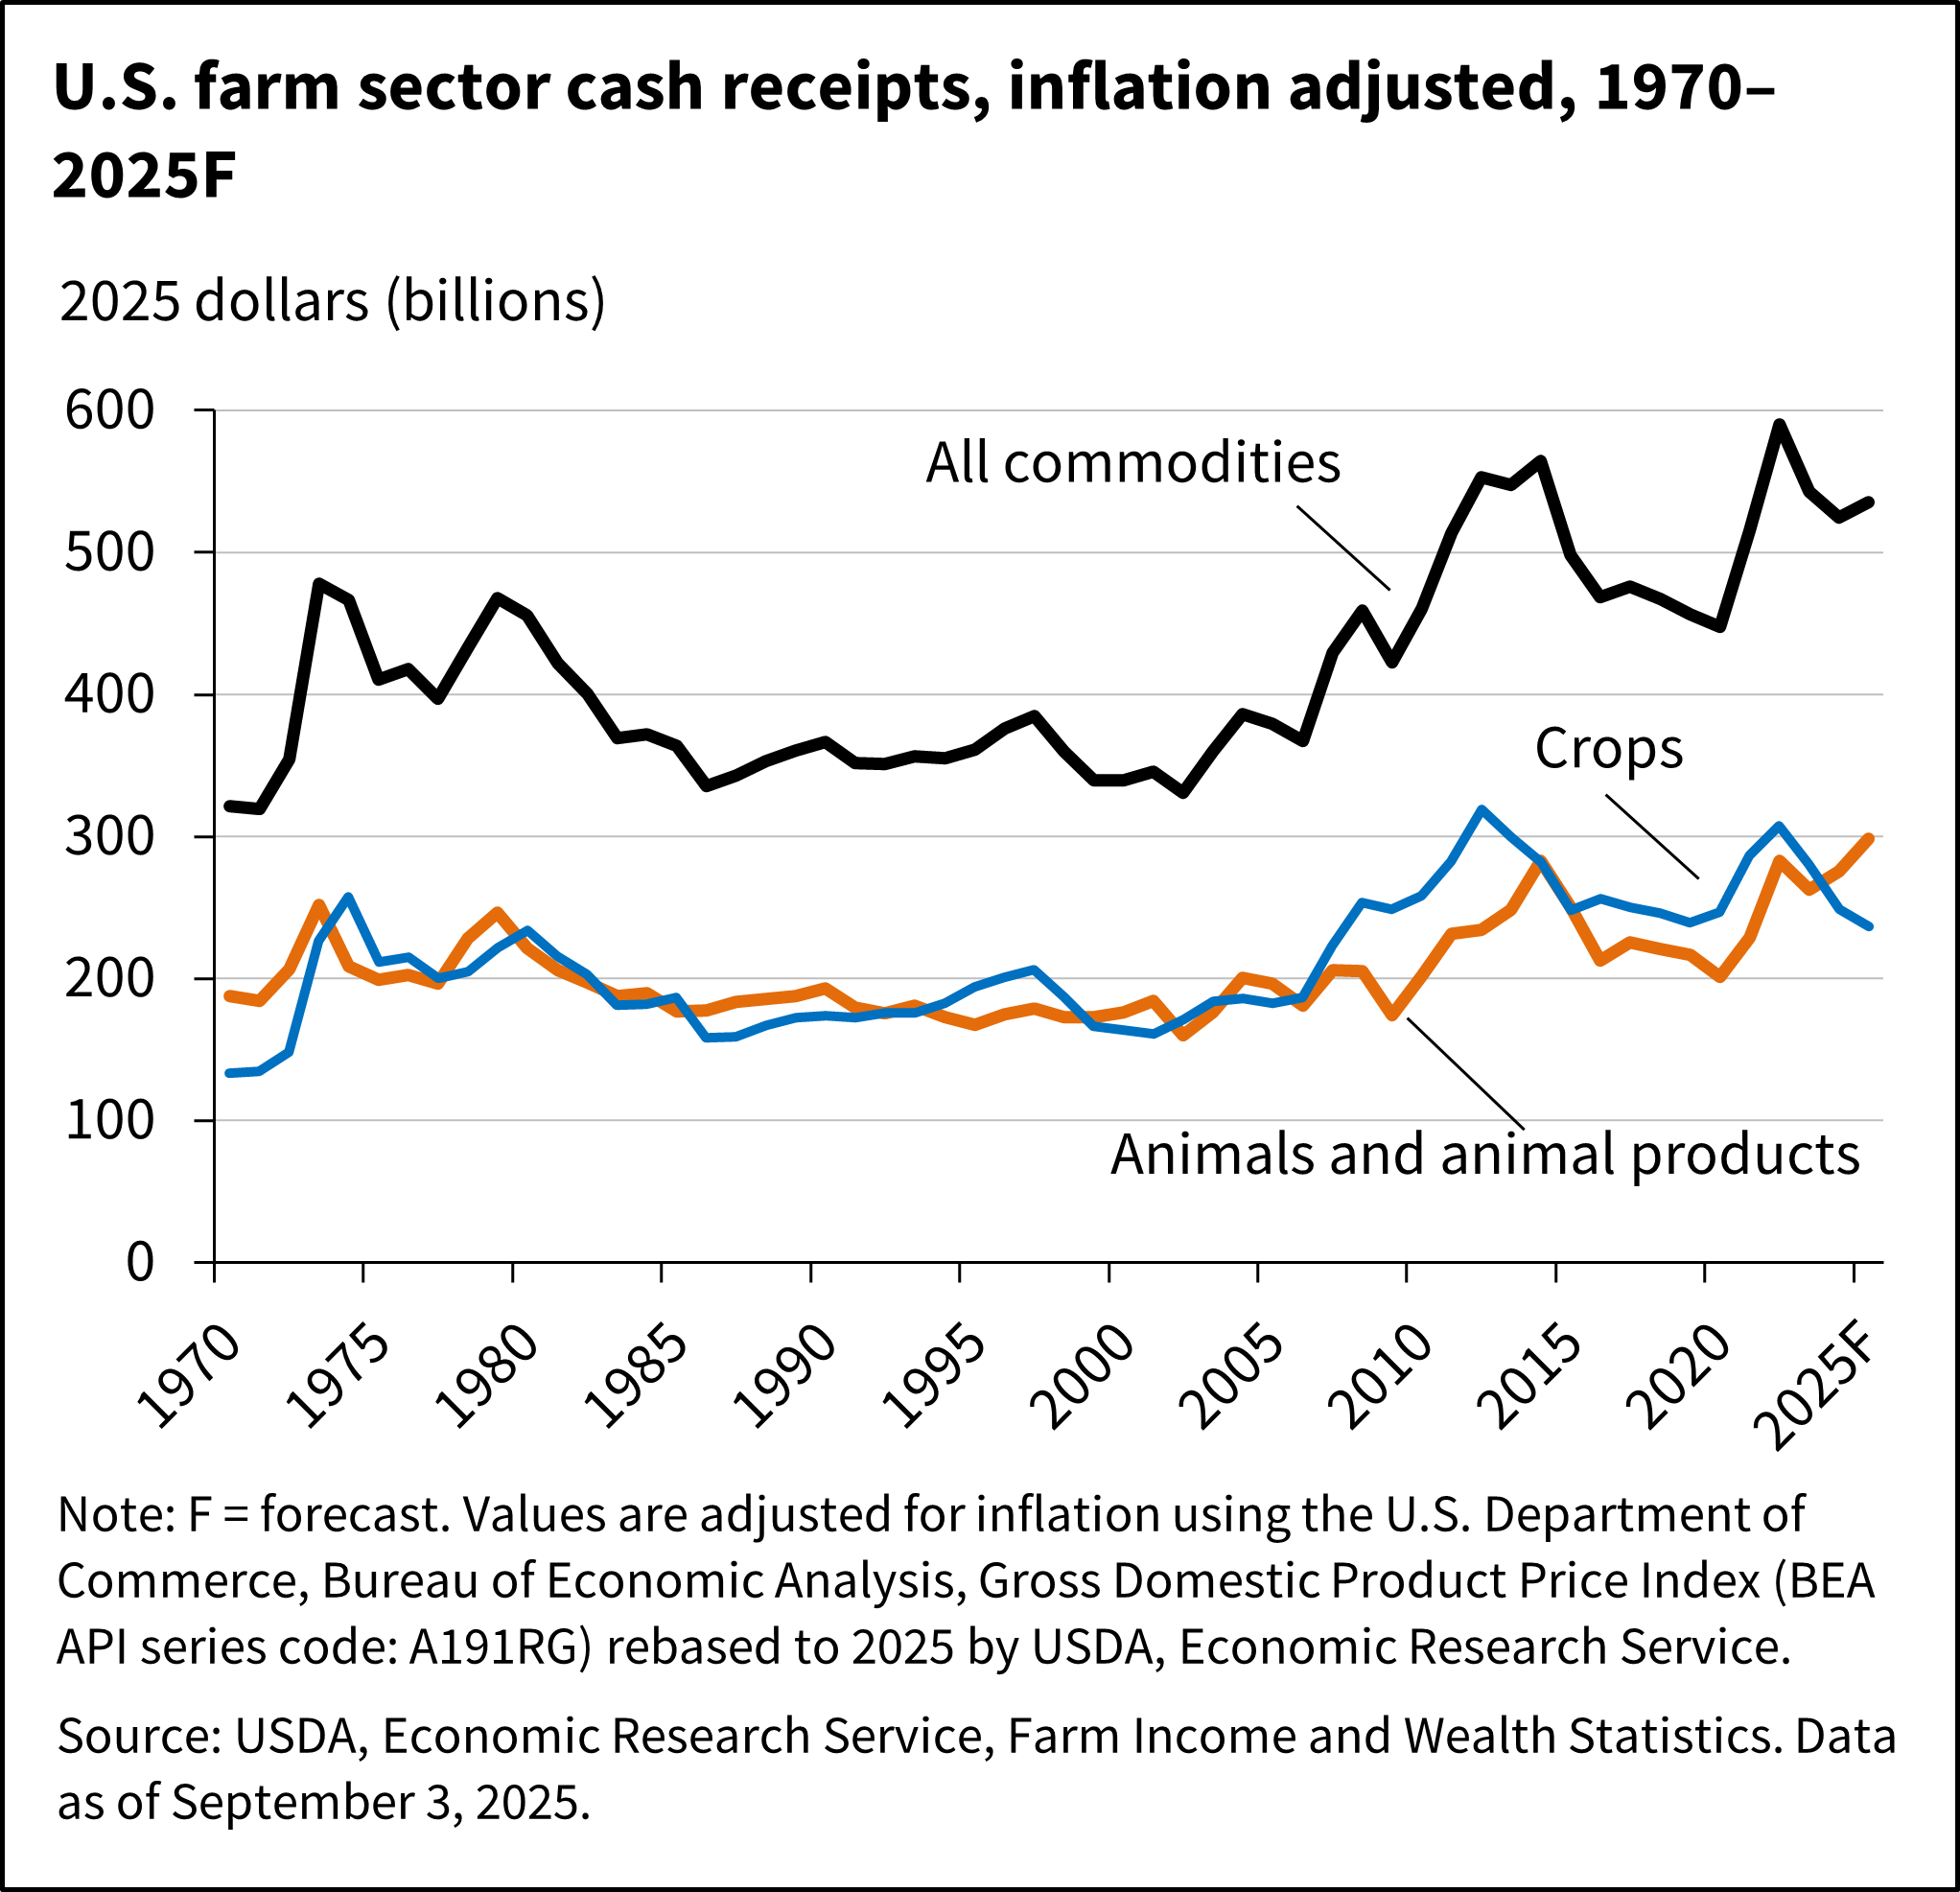
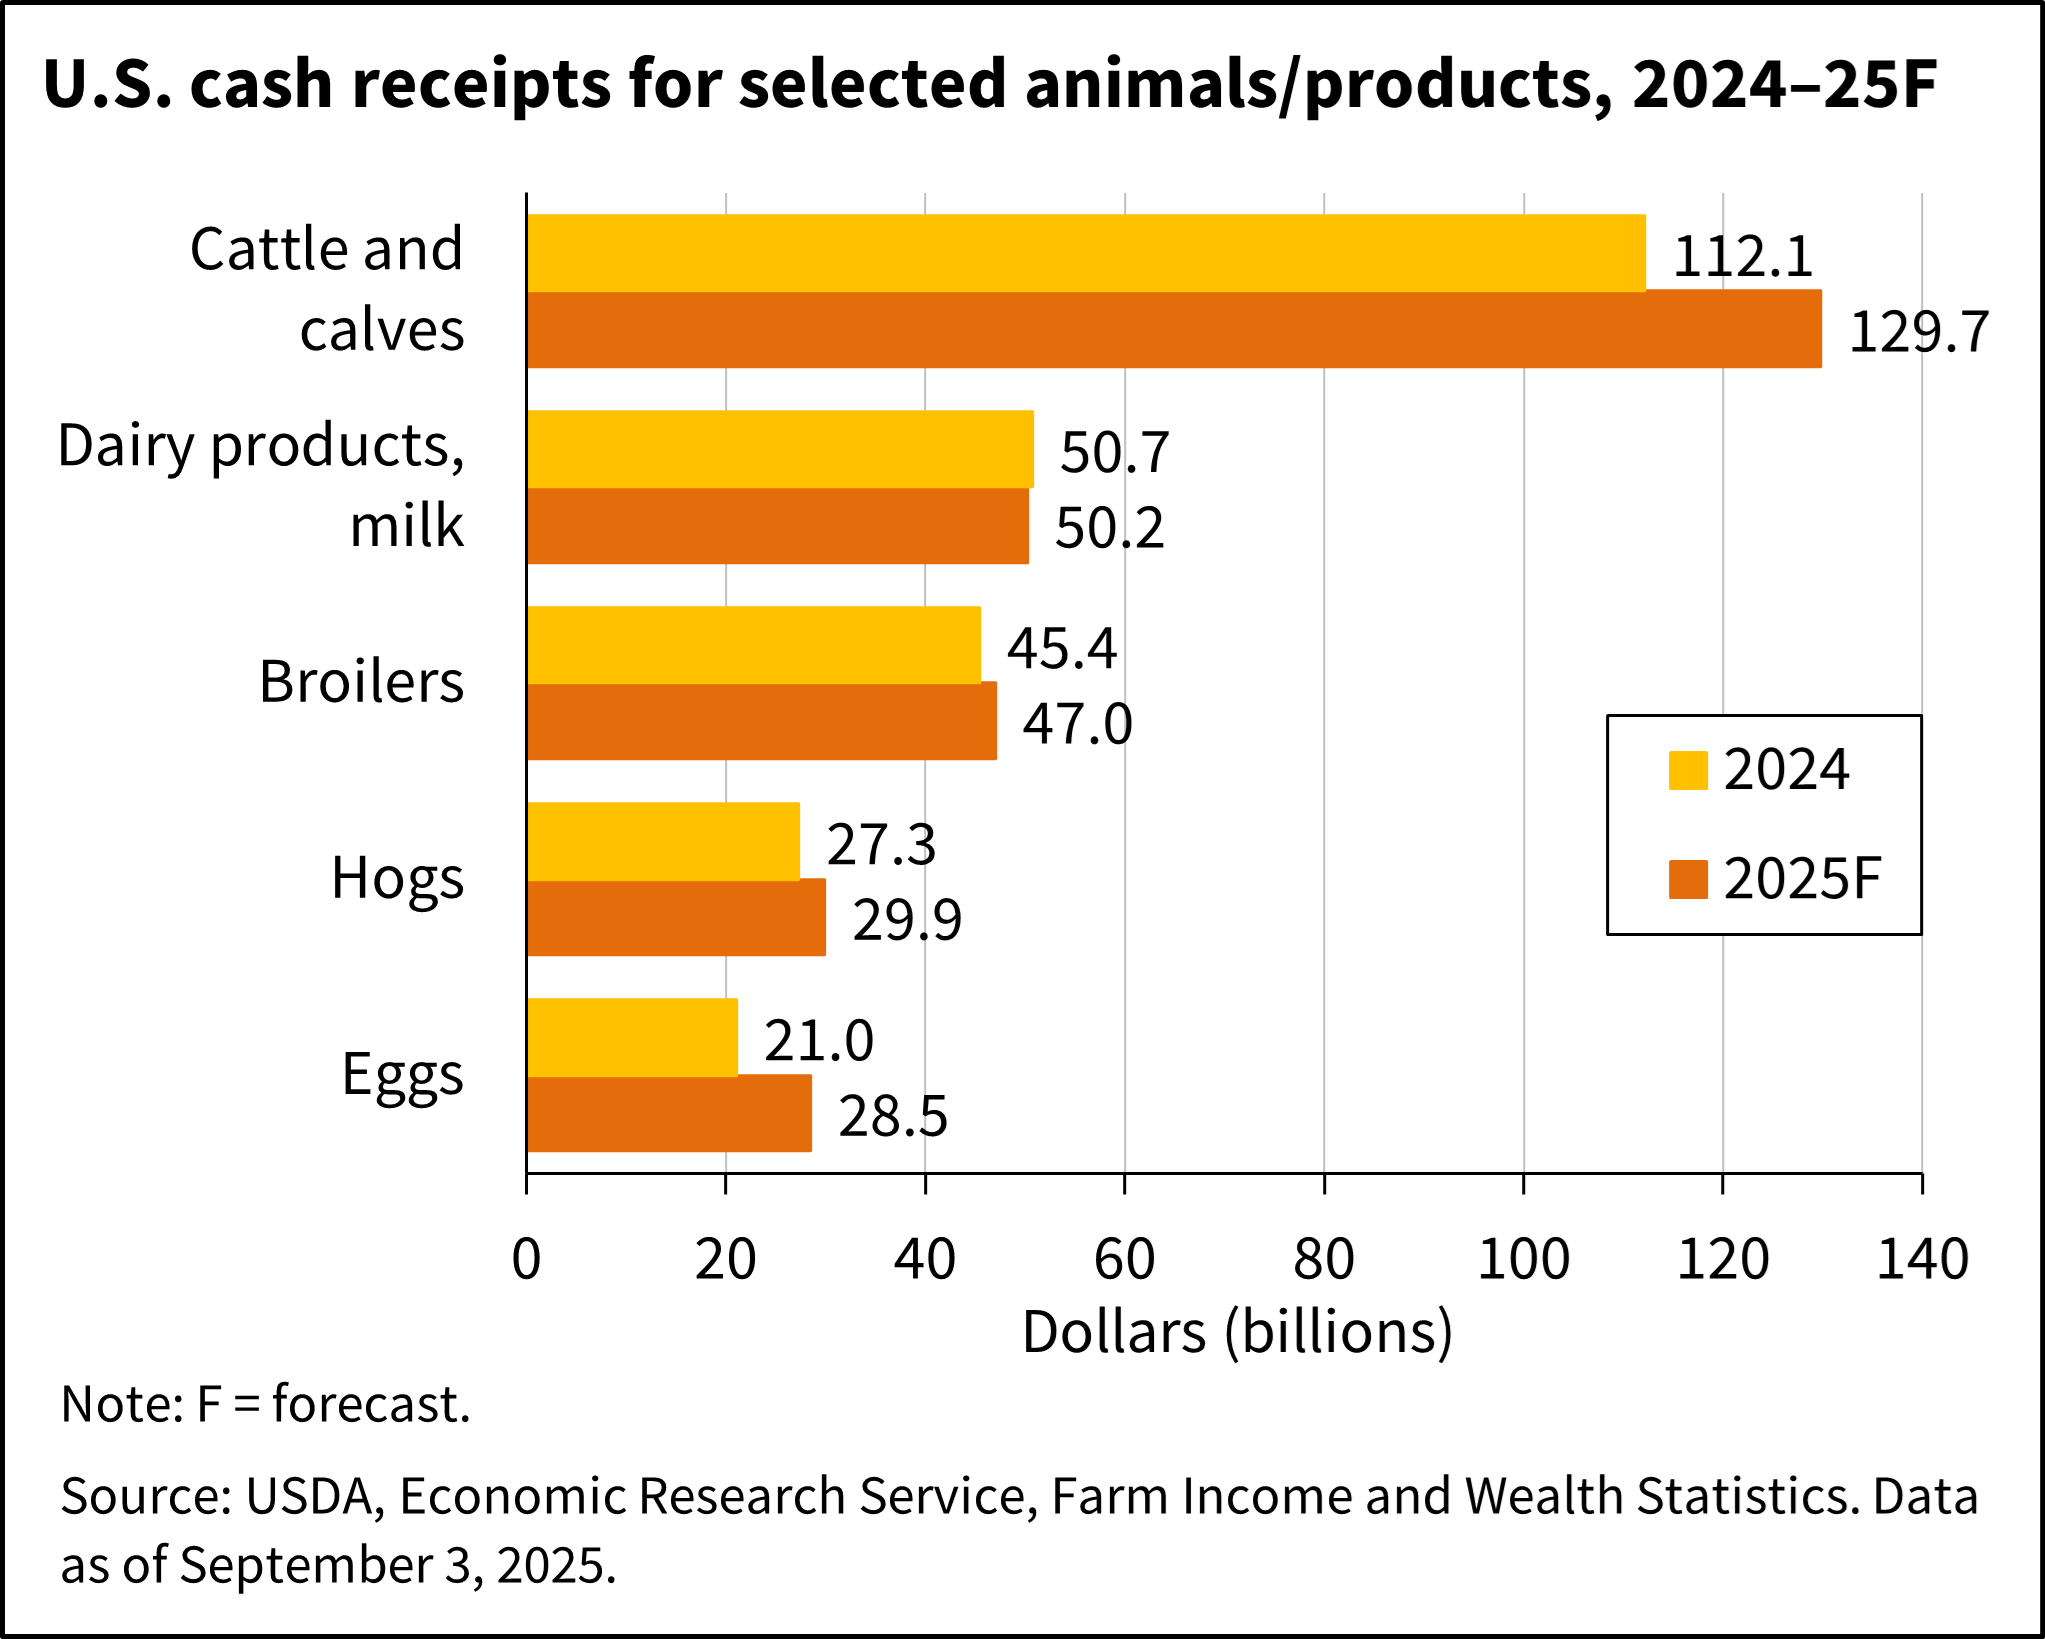
- Overall, farm cash receipts are forecast to increase by $24.0 billion (4.7 percent) from 2024 to $535.2 billion in 2025 in nominal dollars. Total crop receipts are forecast to decrease by $6.1 billion (2.5 percent) from 2024 levels to $236.6 billion in 2025 following lower receipts for soybeans, corn, and wheat. Conversely, total animal/animal product receipts are projected to increase by $30.0 billion (11.2 percent) to $298.6 billion in 2025. Receipts for cattle, eggs, hogs, broilers, and turkeys are forecast to rise relative to 2024.
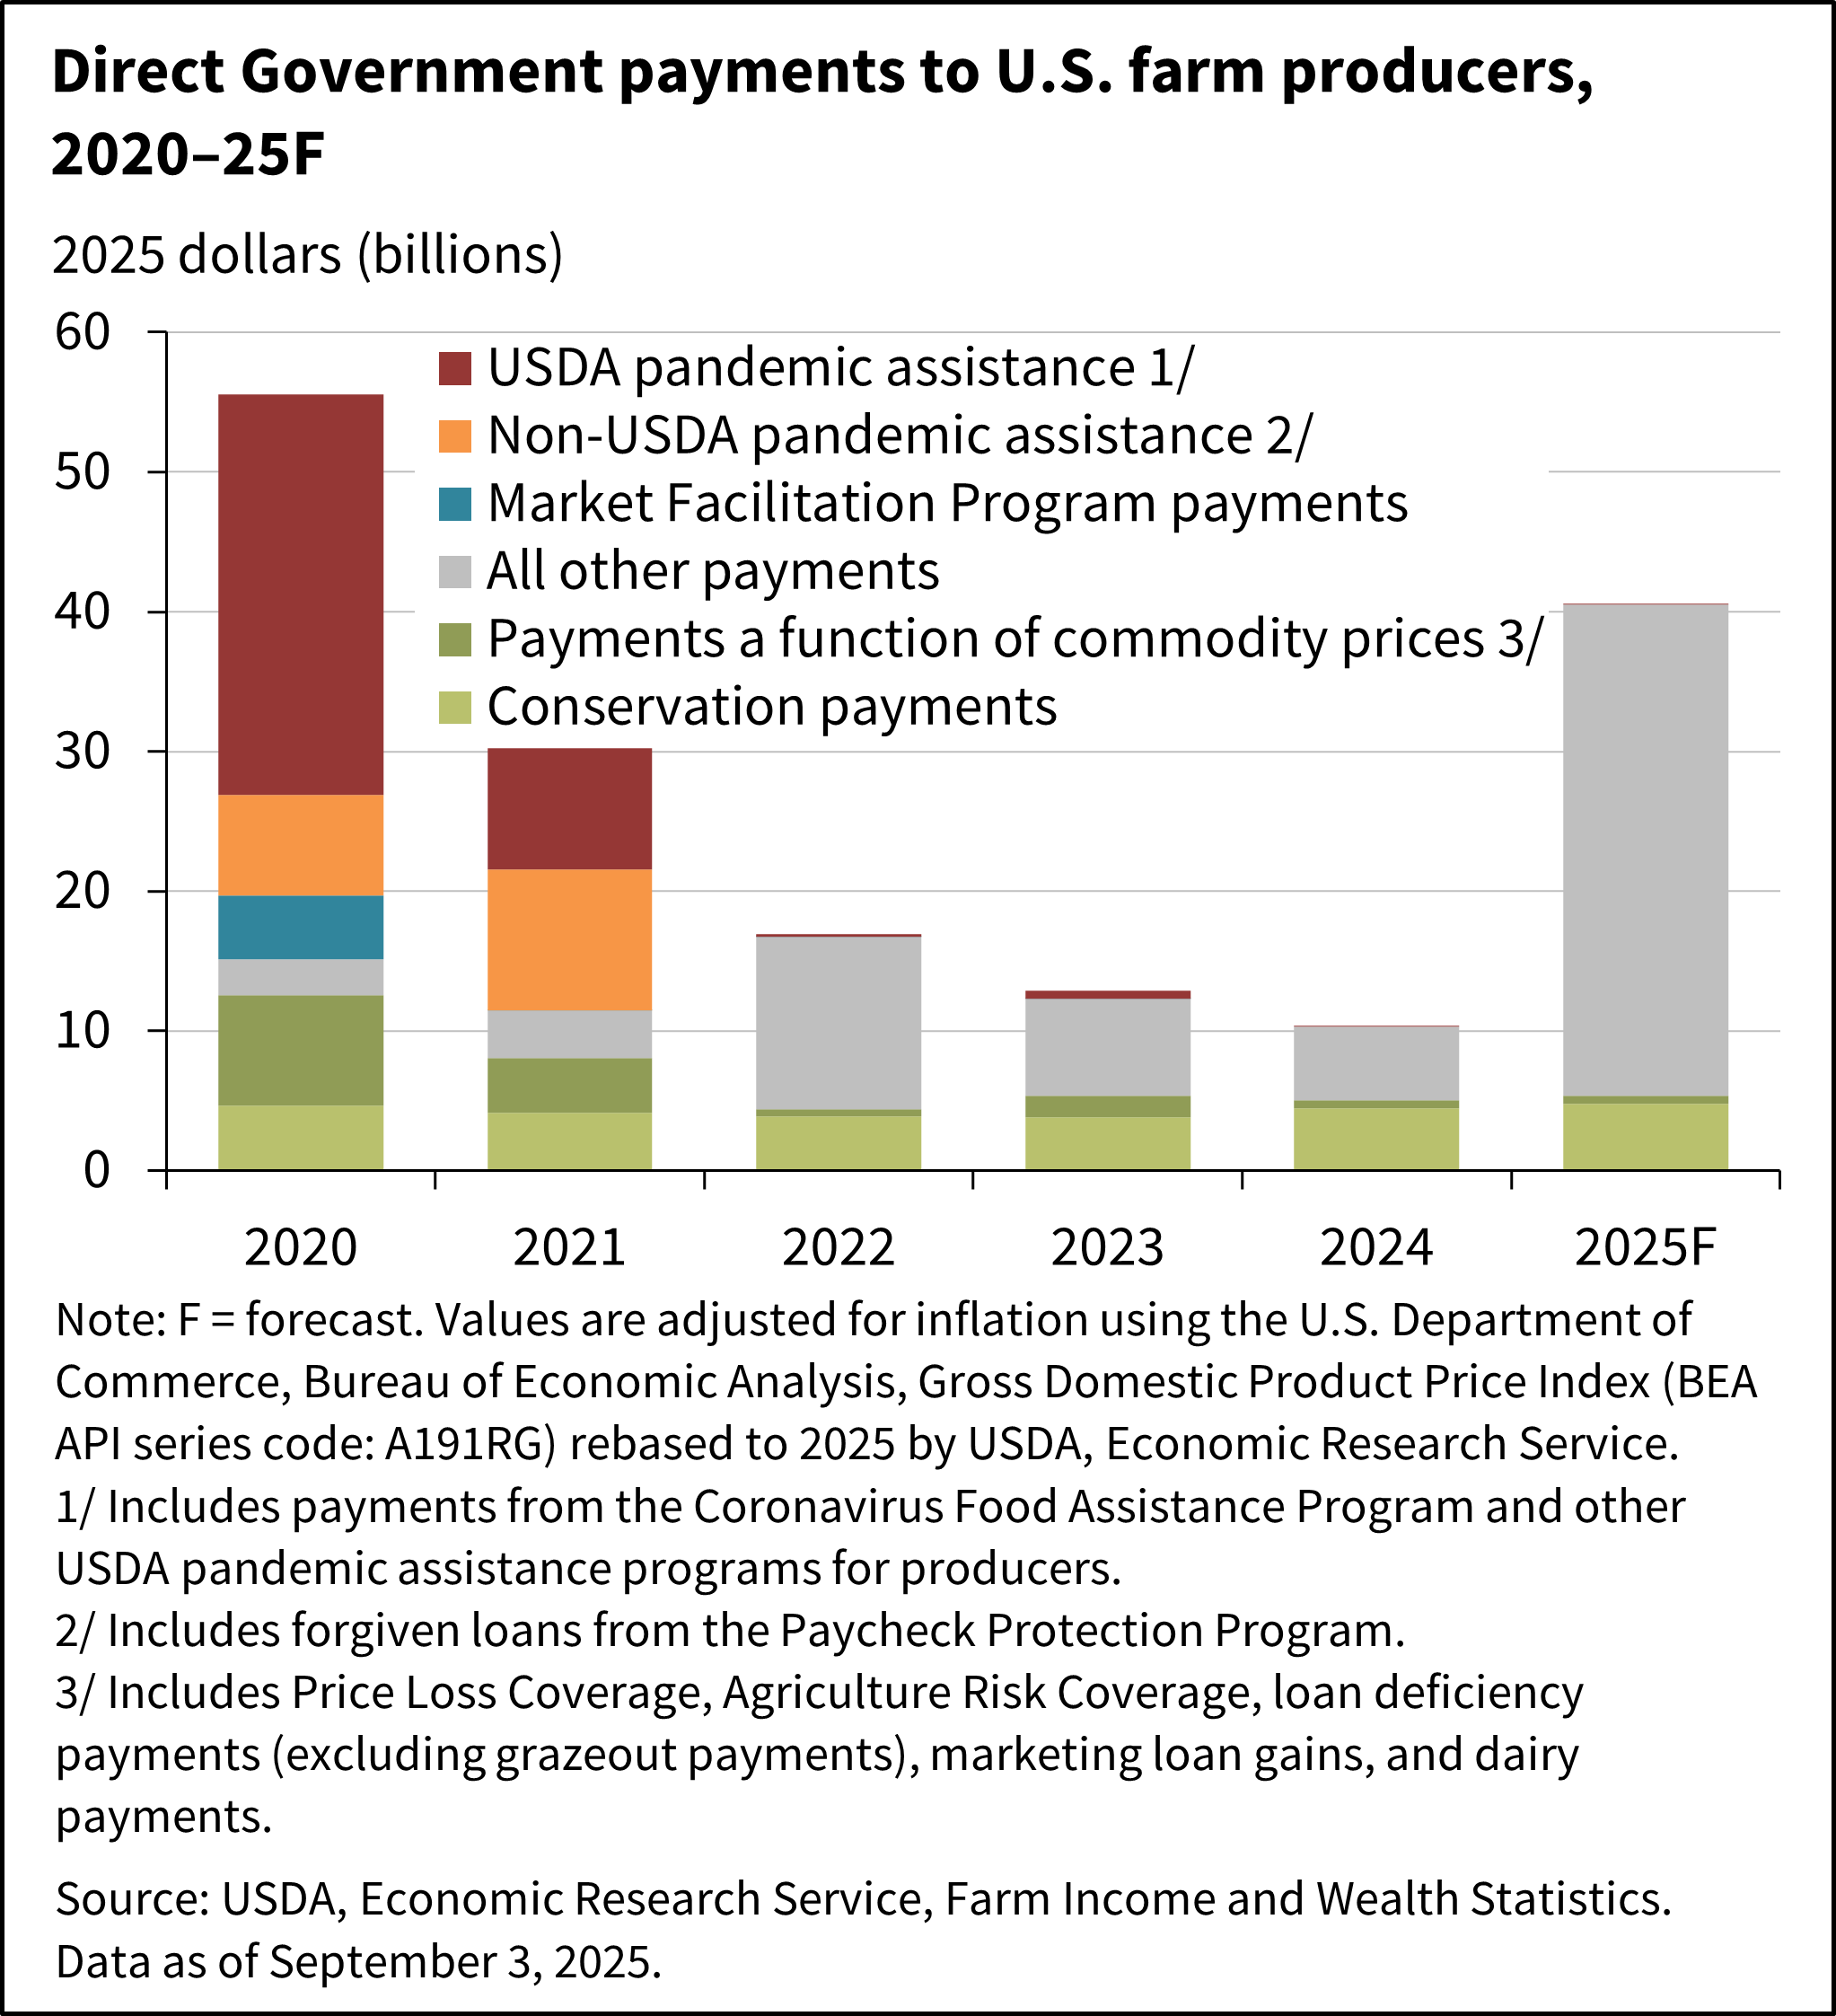
- Direct Government farm payments are forecast at $40.5 billion for 2025, a $30.4-billion increase from 2024. The forecast increase is largely because of supplemental and ad hoc disaster assistance to farmers and ranchers from the American Relief Act of 2025. Direct Government farm payments include Federal farm program payments paid to farmers and ranchers but exclude U.S. Department of Agriculture (USDA) loans and insurance indemnity payments made by the Federal Crop Insurance Corporation (FCIC).
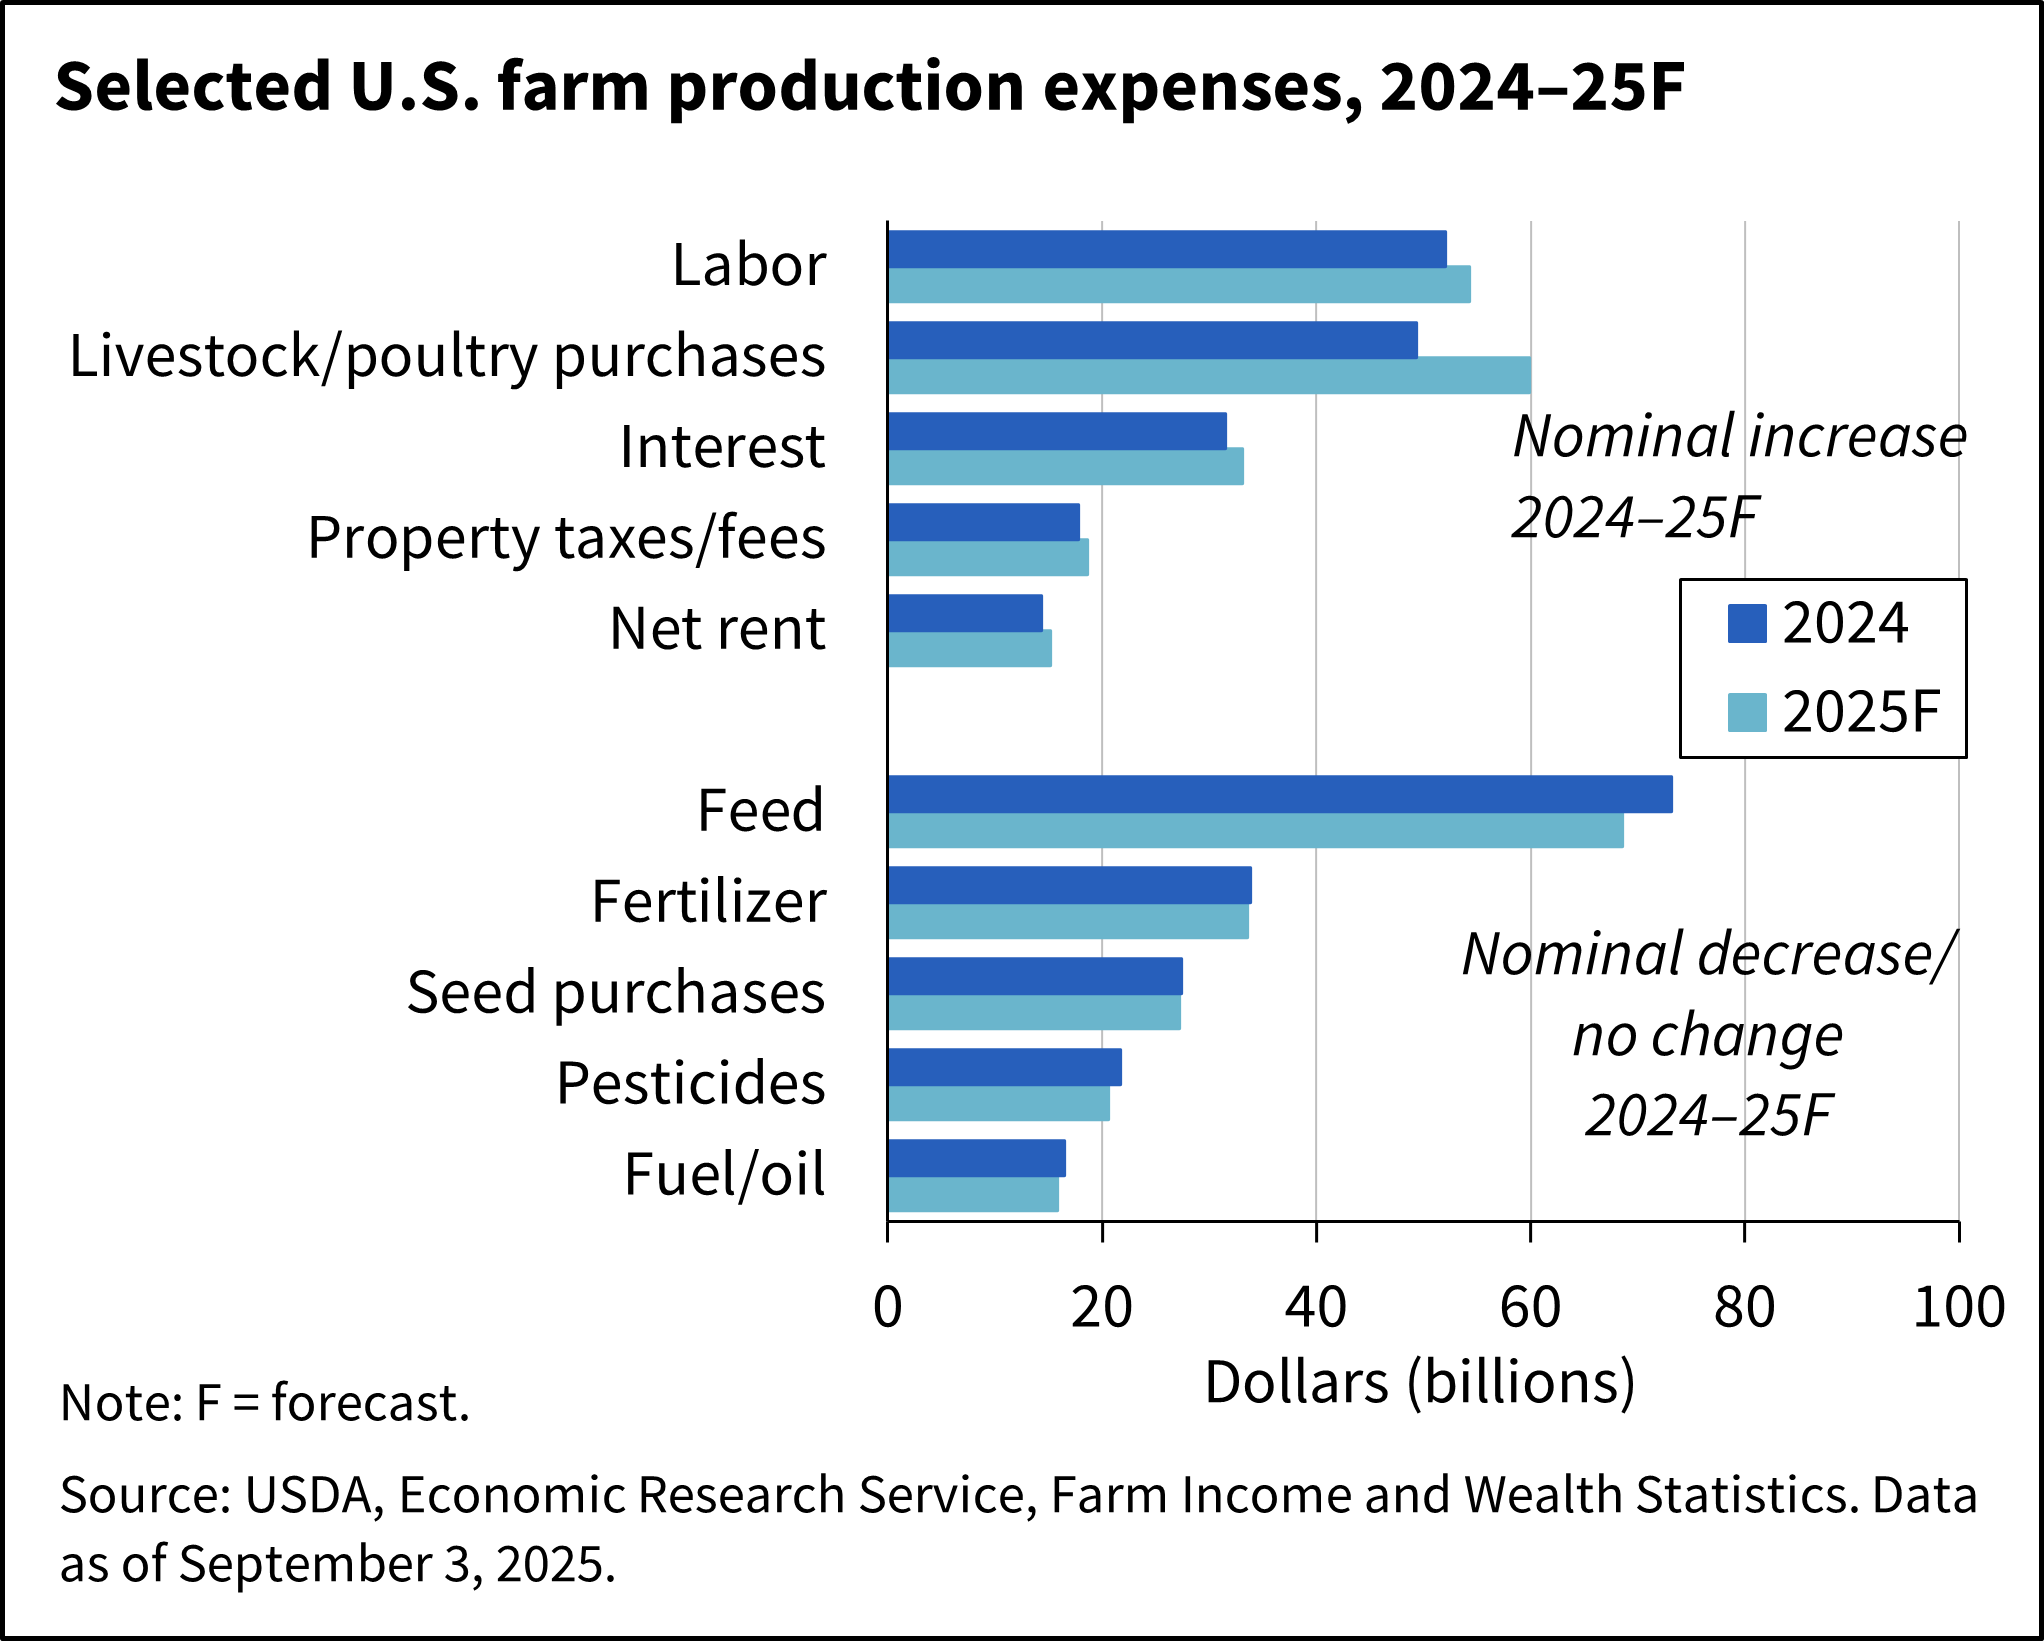
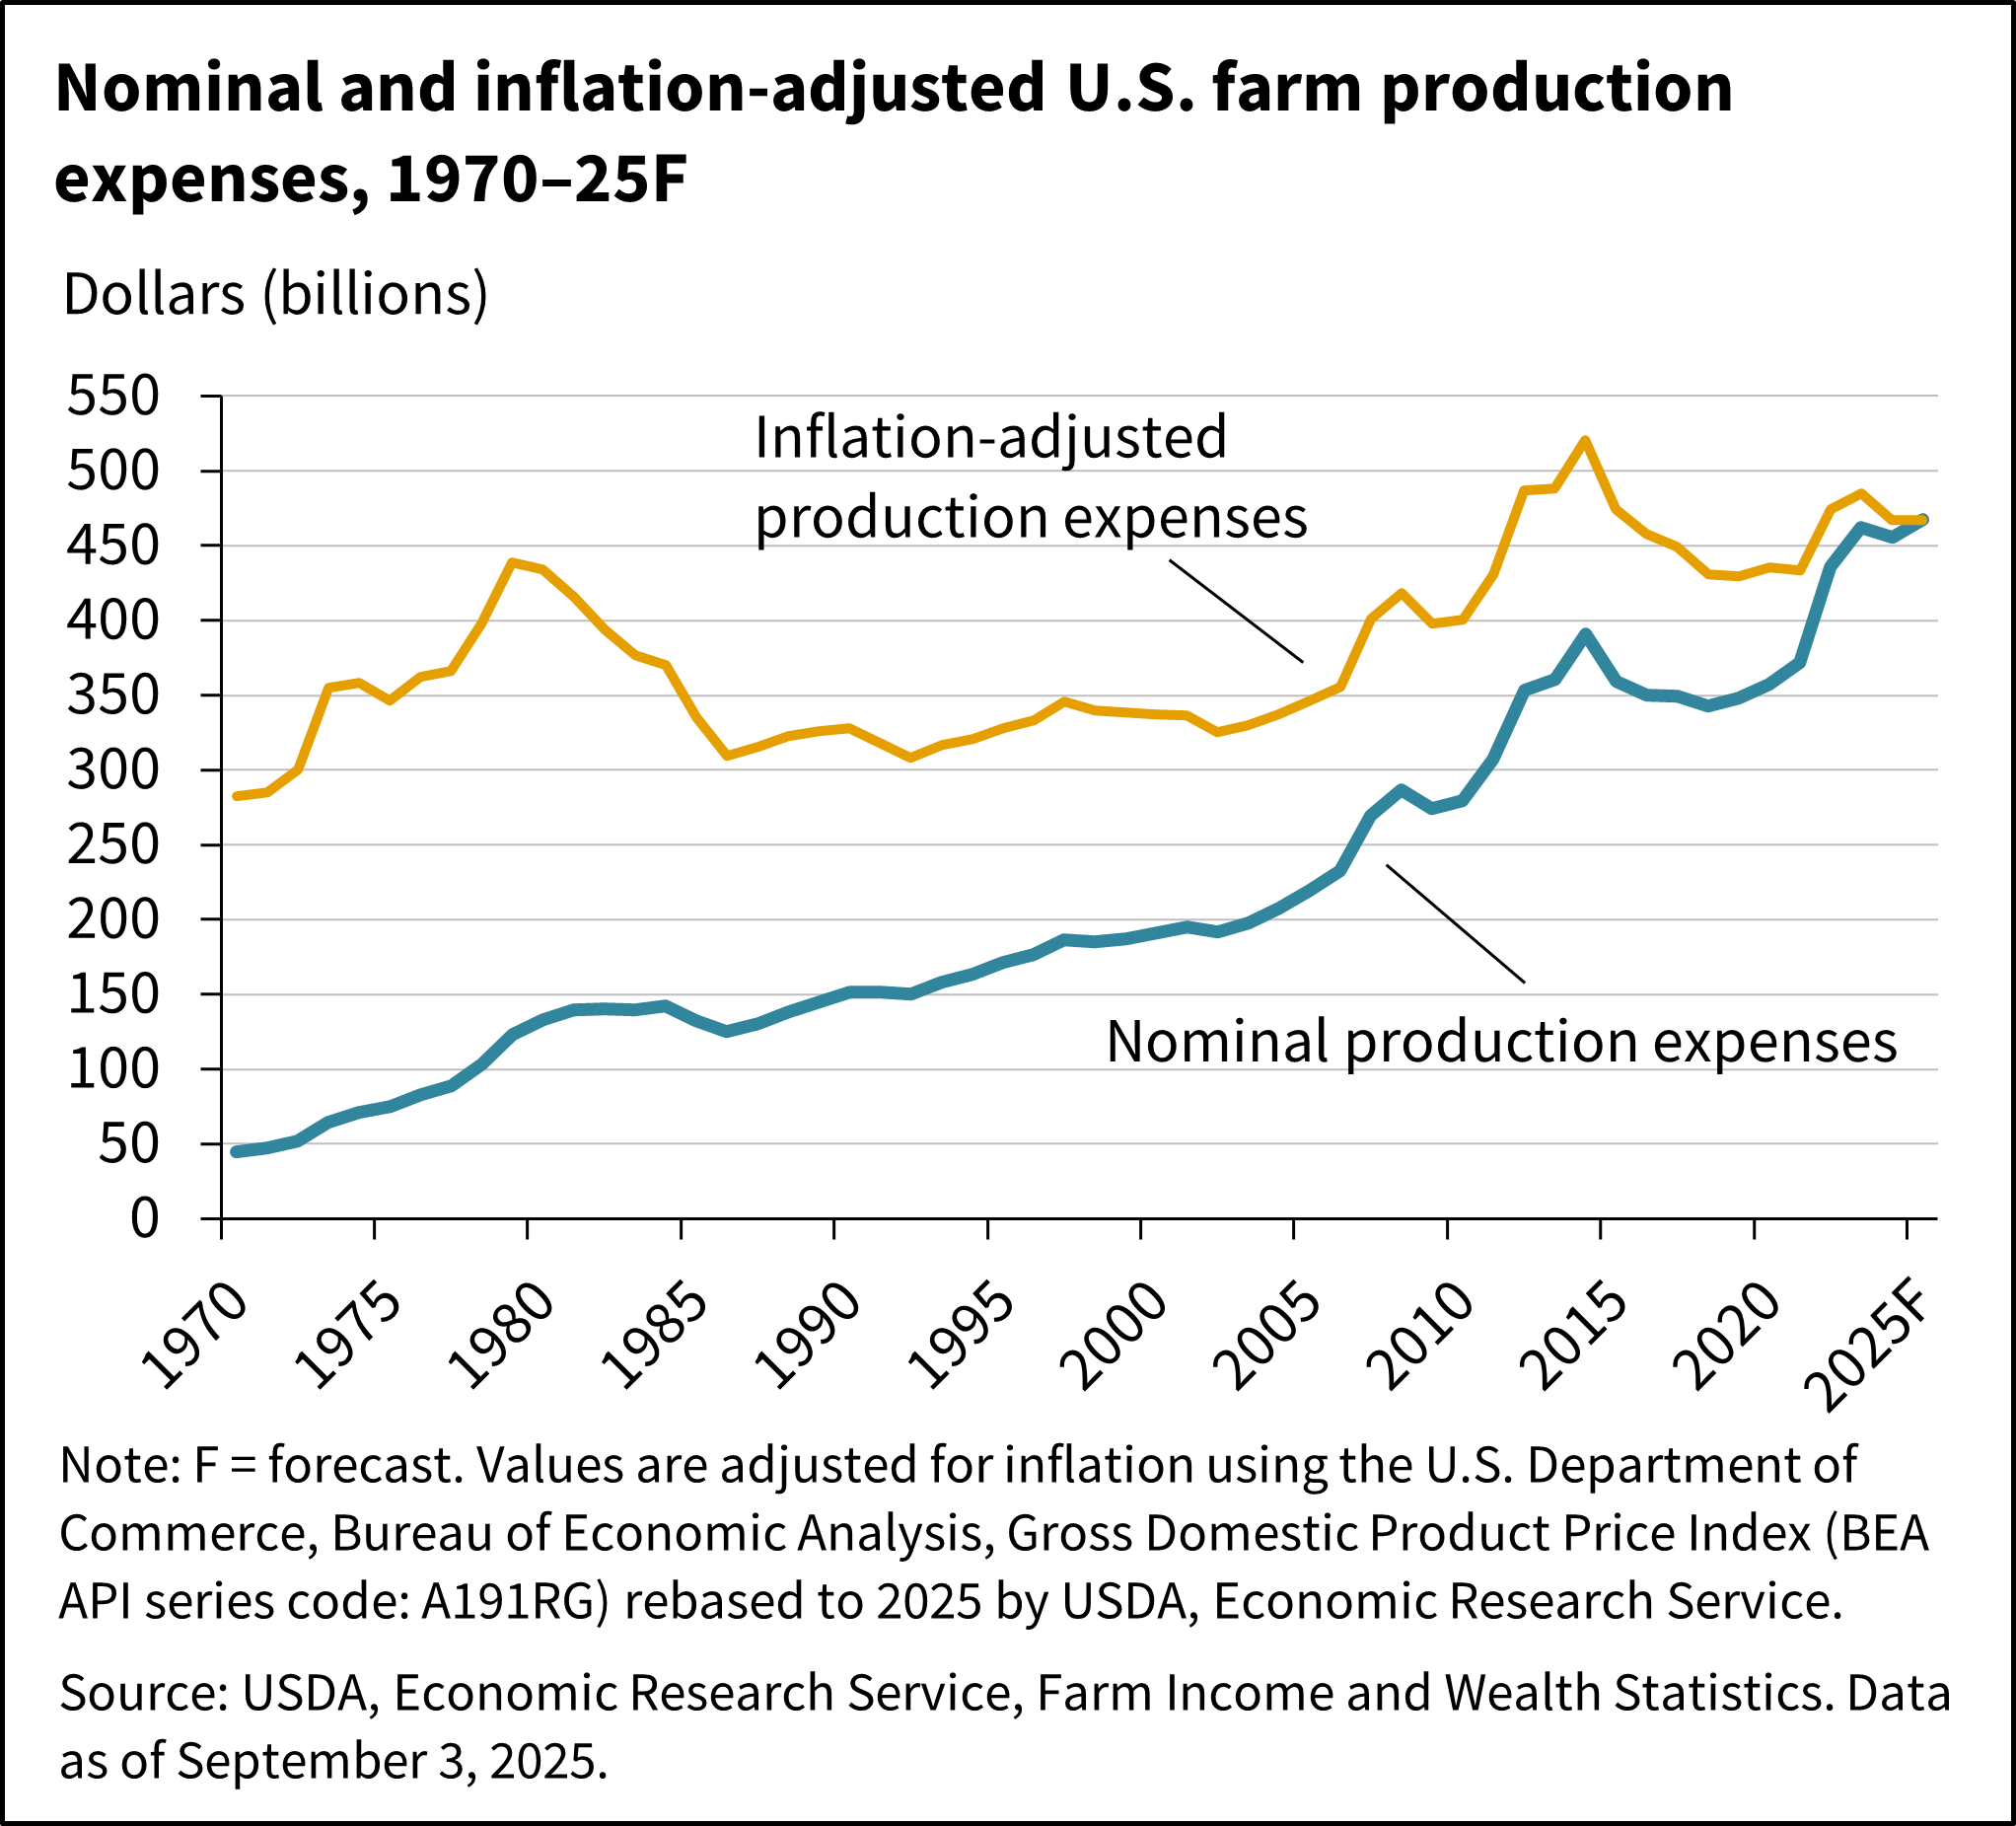
- Total production expenses, including those associated with operator dwellings, are forecast to increase $12.0 billion (2.6 percent) from 2024 to $467.4 billion in 2025. Spending on livestock/poultry purchases are expected to see the largest increase relative to 2024 at $10.6 billion (21.5 percent) while spending on feed is expected to decline in $4.6 billion (6.2 percent) in 2025.
Total Cash Receipts Forecast To Increase in 2025
Total inflation-adjusted cash receipts are forecast to grow $10.9 billion (2.1 percent) from 2024 to $535.2 billion in 2025. Crop cash receipts are projected to decline $12.3 billion (4.9 percent) during the year, while animal/animal product cash receipts are expected to grow by $23.2 billion (8.4 percent).
Crop Receipts Projected To Fall in 2025
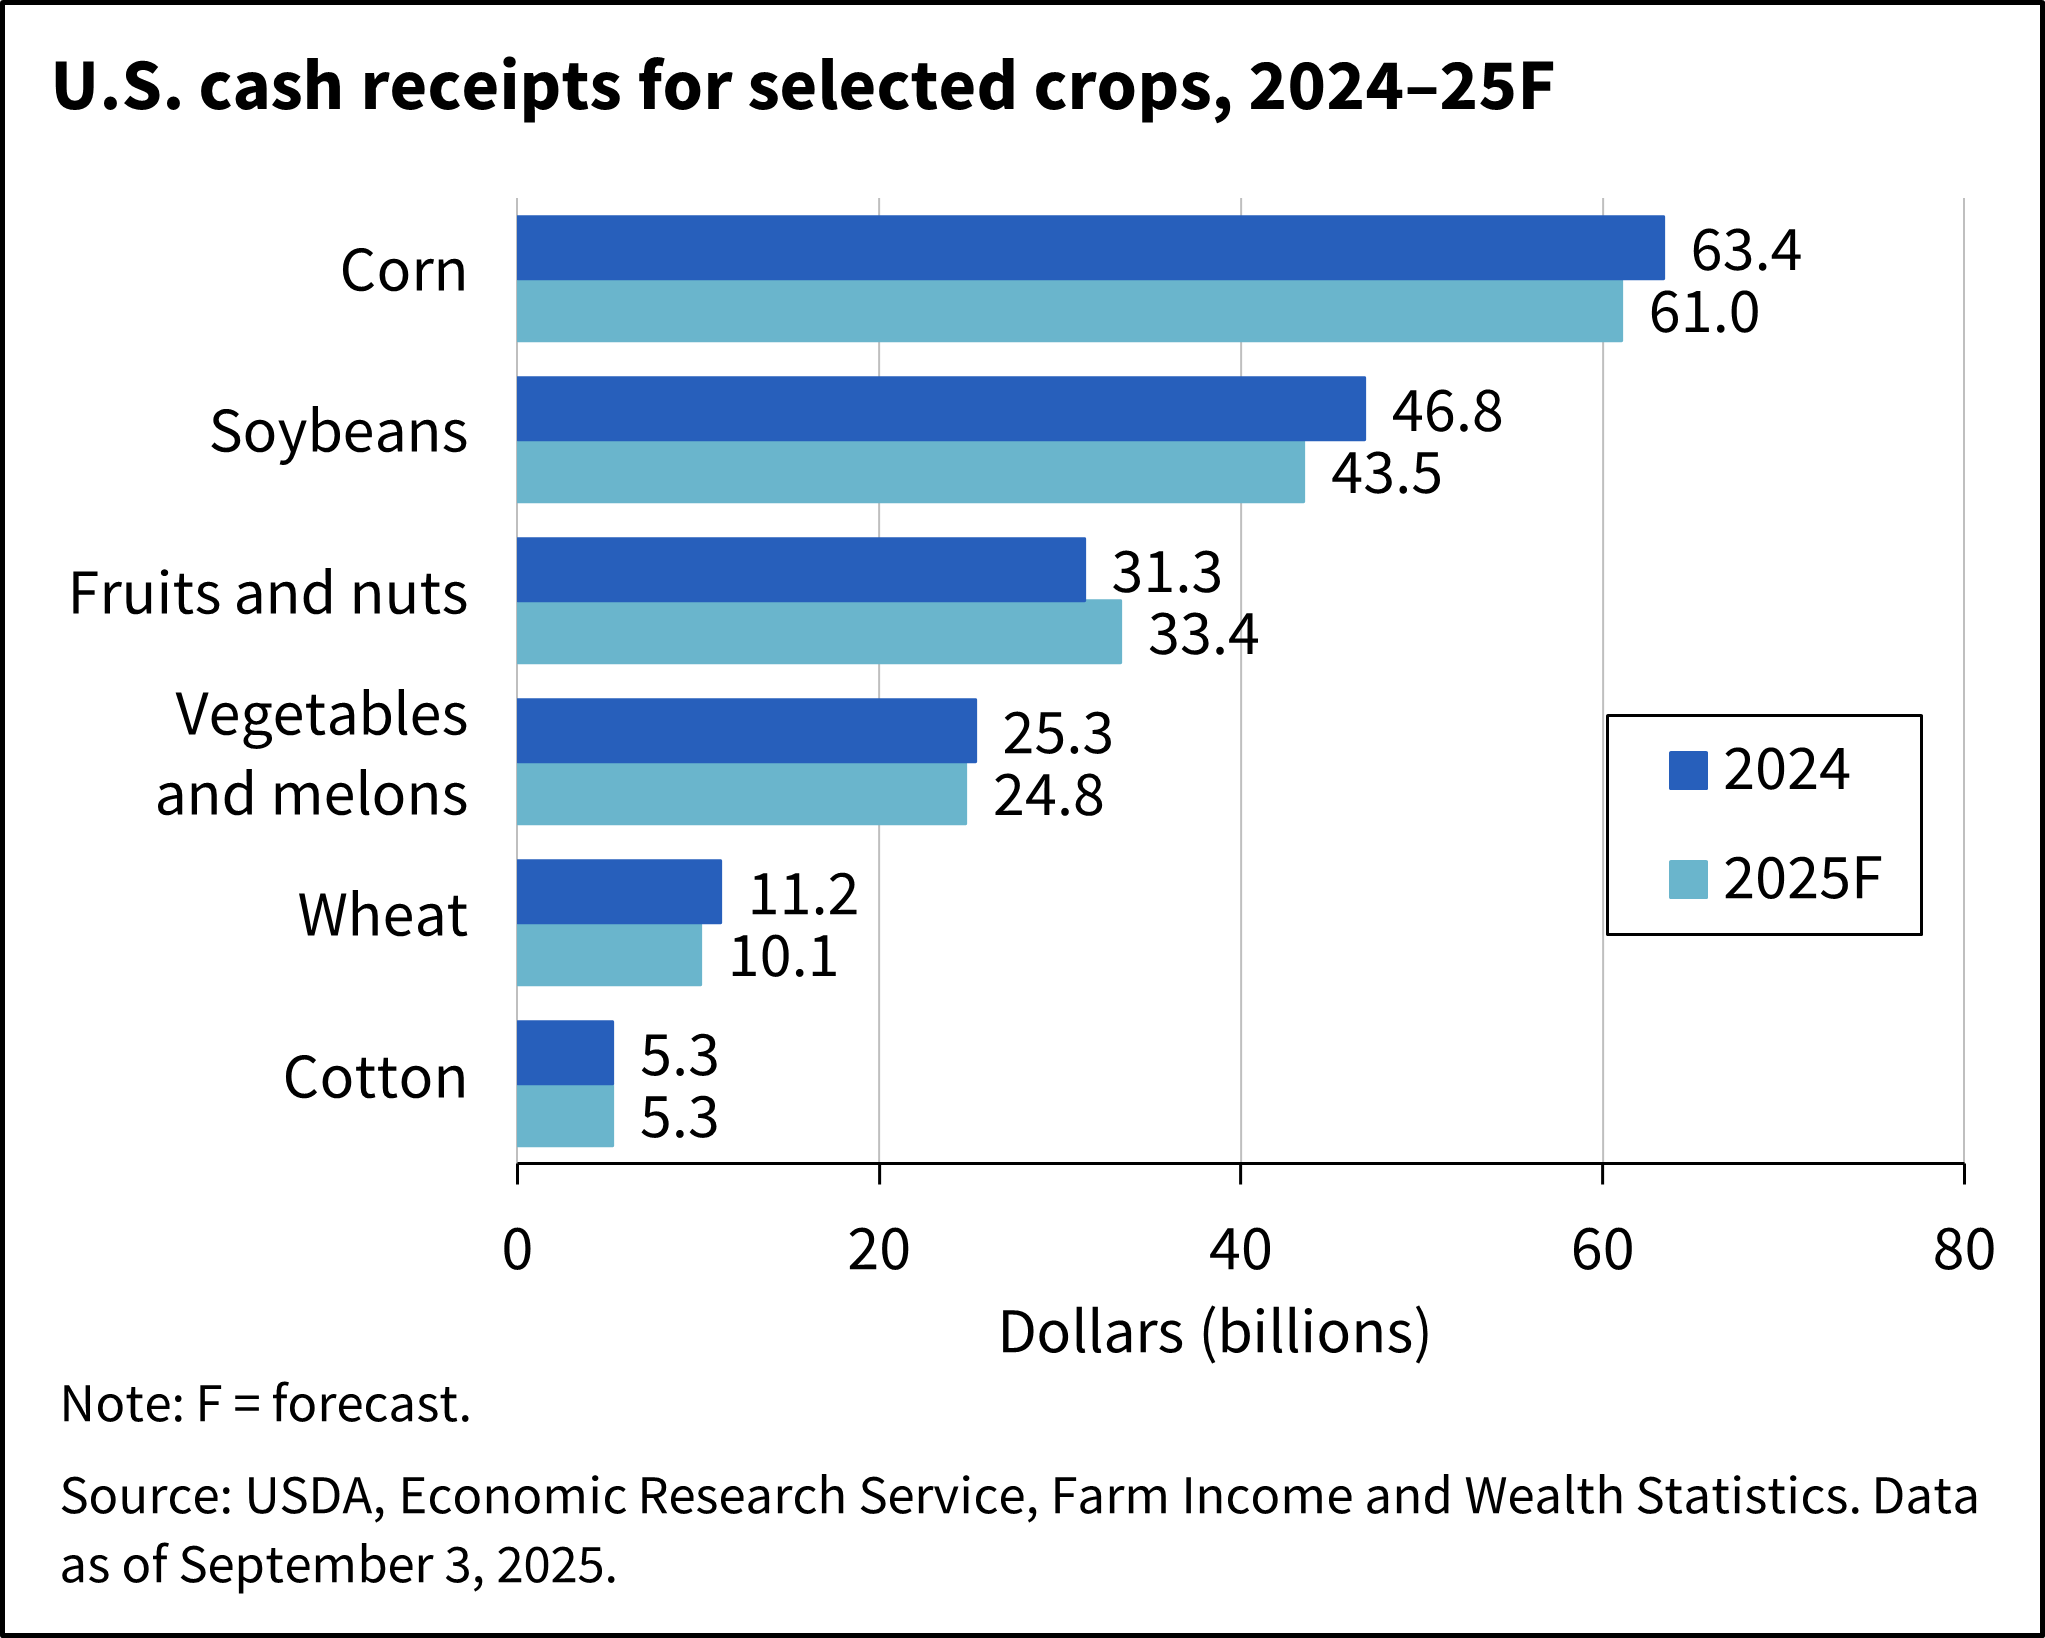
Crop cash receipts are forecast at $236.6 billion in 2025, a decrease of $6.1 billion (2.5 percent) from 2024 in nominal terms. The cash receipts were largely lower due to price declines across most crops (fruits and nuts were exceptions) relative to 2024 which were offset only partially by greater quantities for some commodities. Combined receipts for corn, soybeans and wheat are forecast to fall $6.8 billion in total, while receipts for fruits and nuts are expected to increase.
Corn receipts are expected to fall by $2.3 billion (3.7 percent) in 2025 primarily due to lower prices. Likewise, soybean receipts are forecast to decrease by $3.4 billion (7.2 percent). Falling prices and quantities sold are expected to result in a decline of $0.5 billion (14.8 percent) in rice receipts during the year. Wheat receipts are forecast to fall $1.1 billion (9.8 percent), due to lower prices and quantities sold. Receipts for hay are projected to fall by $0.2 billion (2.5 percent) in 2025, while cotton receipts are expected to remain near 2024 levels.
Vegetable and melon cash receipts are expected to fall $0.5 billion (2.1 percent) in 2025. Cash receipts for fruits and nuts in 2025, however, are forecast to increase $2.0 billion (6.5 percent) in nominal terms during the year due to both higher prices and quantities.
See data on value of crop production (in the value added table) and crop cash receipts.
Rising Animal/Animal Product Receipts Forecast in 2025
Total animal/animal product cash receipts are forecast at $298.6 billion in 2025, an increase of $30.0 billion (11.2 percent) in nominal terms from 2024. Receipts for all major animal/animal products are expected to grow largely due to higher prices with some offsetting effects of lower quantities, most notably for cattle and calves. Milk was an exception, with lower cash receipts.
Cash receipts from cattle and calves are expected to increase $17.7 billion (15.7 percent), due to sustained growth in prices only partially offset by lower quantities. Hog receipts are also forecast to rise by $2.6 billion (9.5 percent) due to higher prices in 2025. Milk receipts are expected to fall $0.5 billion (1.0 percent) nominally in 2025.
Broiler receipts are expected to increase $1.6 billion (3.5 percent) in 2025. Cash receipts for chicken eggs are also projected to grow in 2025, by $7.5 billion (35.4 percent).
See data on value of animal/product production (in the value added table) and animal/product cash receipts.
Direct Government Farm Payments Forecast To Increase in 2025
Direct Government farm program payments are those made by the Federal Government to farmers and ranchers with no intermediaries. Most direct payments to farmers and ranchers are administered by the USDA using the Farm Bill but can also come from supplemental programs authorized by the U.S. Congress. Government payments discussed here do not include Federal Crop Insurance Corporation (FCIC) indemnity payments (listed as a separate component of farm income) and USDA loans (listed as a liability in the farm sector’s balance sheet). Direct Government farm program payments are forecast at $40.5 billion for 2025, a $30.4 billion increase from the $10.1 billion total for 2024. This overall increase reflects higher anticipated payments from supplemental and ad hoc disaster assistance, mainly from the funding authorized in the Disaster Relief Supplemental Appropriations Act, 2025 contained in the American Relief Act, 2025.
- Supplemental and ad hoc disaster assistance payments in 2025 are forecast at $35.2 billion and consist primarily of payments from the Disaster Relief Supplemental Appropriations Act of 2025. The act included the Economic Assistance for Producers and other payments related to losses due to natural disasters in 2023 and 2024.
- Conservation payments from the financial assistance programs of USDA's Farm Service Agency and Natural Resources Conservation Service (NRCS) are expected to be $4.8 billion in 2025, an increase of $446.3 million (10.3 percent) from the 2024 level. The increase in conservation payments is due to an increase in payments from NRCS programs.
- Farm bill payments that are a function of commodity prices are forecast at $550.4 million for 2025, largely unchanged from 2024. Payments under the Agriculture Risk Coverage (ARC) and Dairy Margin Coverage programs are forecast to decrease, while payments from the Price Loss Coverage (PLC) program are forecast to increase relative to 2024.
See data table on Government payments.
Production Expenses Forecast To Increase in 2025
Farm sector production expenses are forecast at $467.4 billion in 2025, increasing by $12.0 billion (2.6 percent), compared with 2024. When adjusted for inflation, the expenses are projected to be comparable to their 2024 levels (increasing slightly by $0.3 billion or 0.1 percent compared with 2024).
See data tables on production expenses.
Spending on feed, livestock/poultry purchases, and labor are expected to represent the three largest categories of spending in 2025. Feed expenses, the largest single expense category, are forecast at $68.6 billion in 2025, falling by $4.6 billion or 6.2 percent compared with 2024. In turn, livestock and poultry purchases are projected at $59.9 billion, rising by $10.6 billion or 21.5 percent compared with 2024. Finally, labor expenses are forecast at $54.3 billion, rising by $2.2 billion (4.2 percent) compared with the 2024 level. Labor expenses here include both cash and noncash employee compensation.
Among other categories of spending, pesticide expenses (spending on agricultural chemicals and application costs) and fuel and oil expenses are forecast to fall in 2025 relative to 2024, while interest expenses and net rent are forecast to rise. All values and calculations are in nominal dollars. For full data on expenses by category, and for the values in both nominal and inflation-adjusted dollars, see the data tables on production expenses.