ERS Charts of Note
Subscribe to get highlights from our current and past research, Monday through Friday, or see our privacy policy.
Get the latest charts via email, or on our mobile app for  and
and 
Monday, November 20, 2023
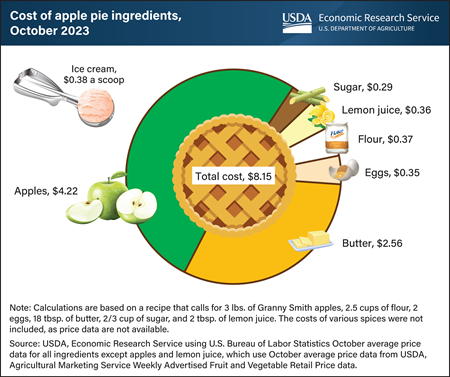
U.S. consumers baking a homemade apple pie for Thanksgiving this year can expect to pay about $8.15 for the ingredients, a decrease of 7.0 percent from last year. Price increases for flour, sugar, and lemon juice were offset by lower prices for apples, butter, and eggs, leading to a $0.61 decrease in the cost of a pie between 2022 and 2023. The price of the main ingredient, Granny Smith apples, fell 7.5 percent from $1.52 per pound in October 2022 to $1.41 per pound in October 2023. Prices decreased the most for eggs (38.6 percent), followed by butter (6.2 percent), between October 2022 and October 2023. Prices increased the most for lemons (20.0 percent) and sugar (16.0 percent), though those ingredients contribute only a small share to the total cost of a pie. If serving the apple pie à la mode, ice cream adds an additional $0.38 per scoop, an increase of $0.02 from last year. The most recent average price data are from October, meaning prices for Thanksgiving week may vary. For example, savings may occur if grocers offer holiday discounts. USDA, Economic Research Service tracks aggregate food category prices and publishes price forecasts in the monthly Food Price Outlook data product, which will next be updated on November 22, 2023.
Thursday, November 16, 2023
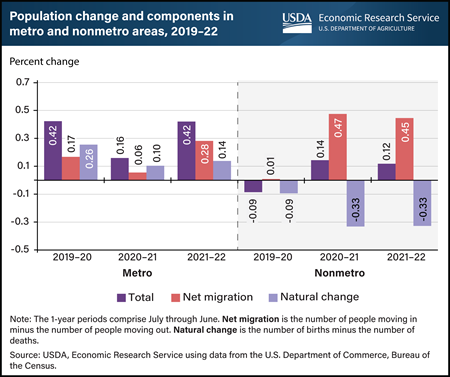
The rural (nonmetro) population growth that began with the Coronavirus (COVID-19) pandemic in 2020 continued into 2022, according to census population estimates. A sharp increase in net migration (the number of people moving in minus the number of people moving out) was the source of the growth. Migration to rural areas was 0.47 percent and 0.45 percent in 2020–21 and 2021–22, respectively, compared with 0.01 percent in the period before the pandemic. Overall, the rural population grew at 0.12 percent from mid-2021 through mid-2022 after accounting for the 0.33-percent decline caused by natural decrease (more deaths than births) in the same period. For rural areas, this recent growth is a reversal of population loss and near-zero migration in 2019–20 and comes after annual rural growth rates declined or were near zero in the previous 10 years. The population in metro areas followed a different trend in 2019–20 and 2020–21, dropping from 0.42 to 0.16 percent growth before returning to 0.42 percent in 2021–22. Roughly 46 million U.S. residents lived in rural areas in July 2022, making up 13.8 percent of the population. This chart is drawn from the ERS report Rural America at a Glance, published in November 2023.
Wednesday, November 15, 2023
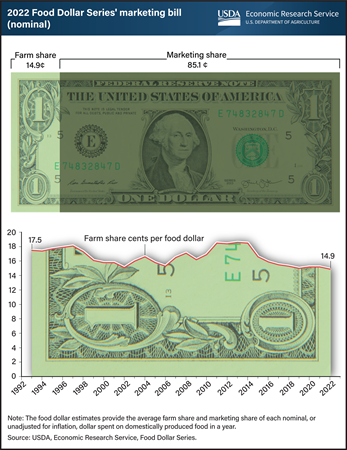
U.S. farm establishments received 14.9 cents per dollar spent on domestically produced food in 2022 as compensation for farm commodity production. This portion, called the farm share, is a decrease of 0.3 cents from a revised 15.2 cents in 2021. The farm share covers operating expenses as well as input costs from nonfarm establishments. The remaining portion of the food dollar, known as the marketing share, covers the costs of getting domestically produced food from farms to points of purchase, including costs related to transporting, processing, and selling to consumers. One of the factors behind the long-term downward trend in the farm share is an increasing proportion of food-away-from-home spending. Farm establishments receive a lower portion of dollars spent on food away from home because of the added costs of preparing and serving meals. The USDA, Economic Research Service (ERS) uses input-output analysis to calculate the farm and marketing shares of a food dollar, which is an average of all domestic expenditures on U.S. food. The data for this chart can be found in the ERS Food Dollar Series data product, updated November 15, 2023.
Tuesday, November 14, 2023
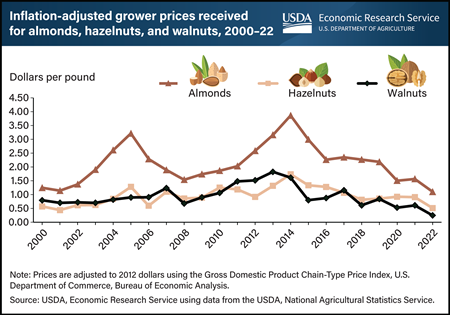
In 2022, tree nut prices fell to their lowest levels in at least two decades. Prices after adjusting for inflation, called real prices, were $1.10 per pound for almonds, $0.51 for hazelnuts, and $0.25 for walnuts. The last time real almond and hazelnut prices were this low was at the turn of the 21st century. Walnut (real) prices are at an all-time low, according to data from the USDA, Economic Research Service. Prior to 2020, the lowest real walnut price recorded was $0.58 per pound in 1999. In 2022, walnut prices were less than half of the previous record low and 14 percent of the high observed in 2013 ($1.82 per pound). Low prices have affected walnut producers’ production decisions. In September 2023, USDA’s National Agricultural Statistics Service forecast that 2023 would be the first year since 1999 that walnut-bearing acreage decreased. Acreage in California, the country’s leading walnut producer, was estimated to have dropped from 400,000 acres in 2022 to 385,000 acres in 2023 and was revised further downward to 375,000 acres in October 2023. Producers have not reduced bearing acreage for almonds or hazelnuts, but prices have decreased since 2014. The decision to reduce acreage stems not only from grower prices but also from a series of conditions growers face that include weather, prices of inputs, and competition from other exporting countries. This chart was drawn from the USDA, Economic Research Service Fruit and Tree Nuts Outlook Report, released September 2023.
Monday, November 13, 2023
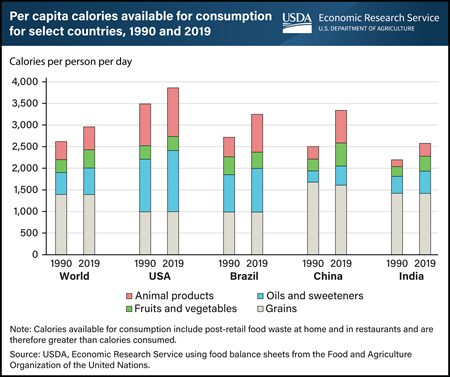
From 1990 through 2019, the calories available to consume per person increased 13 percent on average. The largest changes among the United States, Brazil, China, and India from 1990 to 2019 were in Brazil and China, with daily per capita food available for consumption increasing by 530 calories per person in Brazil and 840 calories in China (20 and 34 percent respectively). China was below the world average food consumption per person in 1990 but above the world average in 2019. The amount of different food types consumed in an individual country depends on income and culture, especially for animal products. Per capita consumption of animal products grew rapidly in Brazil and China but was still below the U.S. level in 2019. Per capita calorie consumption in India was lower than the world average in both 1990 and 2019. This chart appears in the USDA, Economic Research Service report Scenarios of Global Food Consumption: Implications for Agriculture published in September 2023.
Wednesday, November 8, 2023
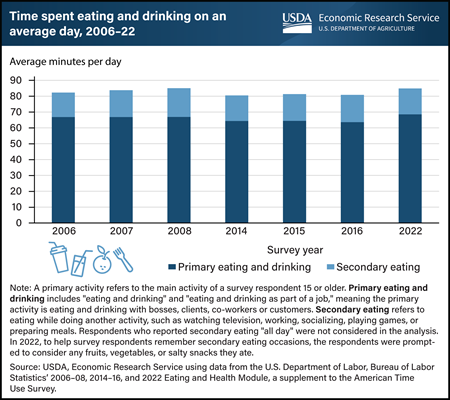
On an average day in 2022, individuals 15 and older spent 68.5 minutes engaged in eating and drinking as a “primary,” or main, activity. USDA, Economic Research Service (ERS) sponsors and maintains data on time spent eating and drinking for the Eating and Health Module, a supplement to the U.S. Department of Labor, Bureau of Labor Statistics’ American Time Use Survey (ATUS). Information about the time and location U.S. residents spend eating and drinking can offer valuable insights into how nutrition and health outcomes vary over time and can inform the design of food assistance and nutrition policies and programs. ERS researchers found that respondents devoted an extra 16.4 minutes to eating as a secondary activity, which means eating while doing something else, such as watching television, working, socializing, playing games, or preparing meals. In 2022, the top two places for primary eating and drinking and secondary eating were “own home or yard” and “workplace.” Overall, individuals in the United States aged 15 and older allocated 85 minutes to both primary eating and drinking and secondary eating on an average day in 2022. This is a modest increase of about 4 minutes compared with the survey data from 2016. This data and chart come from the ERS Eating and Health Module (ATUS) data product, which is part of the nationally representative ATUS.
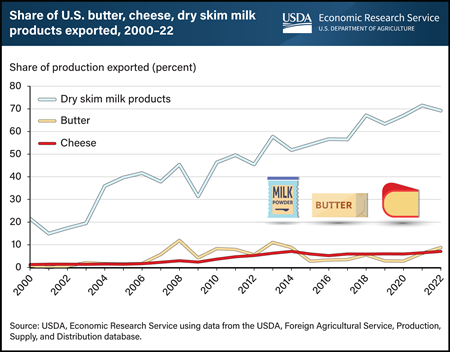
Most U.S. butter and cheese is consumed domestically, while most dry skim milk products are exported
Tuesday, November 7, 2023
The United States is a large producer and exporter of dairy products. Some dairy products are exported more than others. Exports-to-production ratios, which indicate the share of total U.S. production destined for export each year, show that U.S. dry skim milk products are increasingly exported. In 2022, U.S. exports of dry skim milk products (nonfat dry milk, skim milk powder, and dry skim milk for animal use) were equivalent to 69 percent of production by volume. Since 2000, the exports-to-production ratio of dry skim milk products has increased, more than tripling from 2000 to 2022. By contrast, U.S.-produced cheese and butter mostly are kept for use in domestic markets. Though the exports-to-production ratios of butter and cheese also have trended upward, U.S. exports of butter equated to less than 9 percent of 2022 production, and exports of cheese were equivalent to about 7 percent of production. Differences between exports of butter and cheese and exports of dry milk products partly can be explained by shelf stability and ease of transport. Dry skim milk products are much easier to ship internationally and have a lower risk of spoilage than fresh and/or refrigerated dairy products. Although relatively low proportions of U.S. cheese are exported, in 2022 the United States was the second largest exporter of cheese by value worldwide, with total cheese exports estimated at nearly $2.3 billion. This chart is drawn from the USDA, Economic Research Service report U.S. Trade Performance and Position in Global Meat, Poultry, and Dairy Exports published in April 2023.
Monday, November 6, 2023
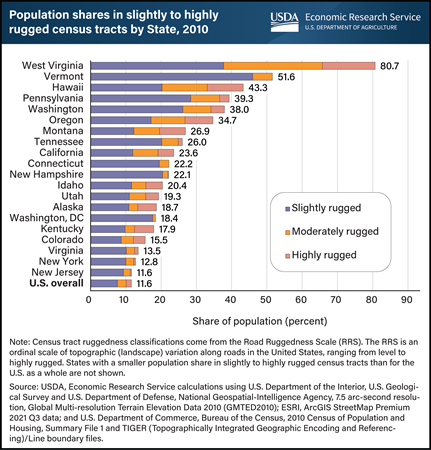
USDA, Economic Research Service (ERS) researchers analyzed the share of each State’s population living in rugged terrain using the Road Ruggedness Scale, a five-category measure created by ERS that classifies census tracts based on elevation changes along roads. They found that in 2010, West Virginia led the Nation with 80.7 percent of its population living in areas classified as either slightly, moderately, or highly rugged. It was followed by Vermont (51.6 percent), Hawaii (43.3 percent), Pennsylvania (39.3 percent), and Washington State (38.0 percent). In 19 States and the District of Columbia, a greater share of residents lived in slightly to highly rugged census tracts than for the Nation as a whole (11.6 percent). For most States near the top of the list, a large share of residents lived in highly rugged census tracts (the highest ruggedness category), notably West Virginia, Hawaii, Oregon, and Montana. However, despite having no highly rugged census tracts, Vermont and Connecticut still have enough residents in slightly and moderately rugged census tracts to be among the top 10 States with the highest population shares in rugged areas. While topographic variation, or “ruggedness,” is visually appealing and may spur economic growth, it can also make it more difficult to navigate land and waterways and limits space for residential and commercial expansion. Residents living in areas with rugged terrain may also require more time to travel to hospitals, schools, social services, grocery stores, and other critical destinations compared with those living in less rugged locations. This chart is drawn from data in the ERS report Characterizing Rugged Terrain in the United States, published in August 2023.
Thursday, November 2, 2023
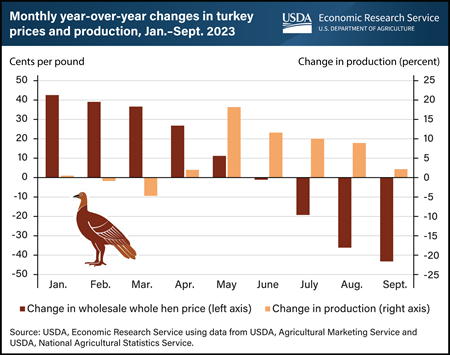
Just in time for the 2023 holiday season, wholesale prices of whole frozen turkeys are declining. Prices for frozen whole hens—the birds typically served for holiday dinners—averaged $1.27 per pound in August 2023. Prices dropped further to $1.25 per pound in September, down 43 cents from a year earlier, and the lowest monthly average price since July of 2021. The price reprieve comes after an outbreak of highly pathogenic avian influenza (HPAI) in 2022 resulted in major losses for the commercial turkey flock. Turkey production fell 6 percent to 5.222 billion pounds in 2022, down from about 5.558 billion in 2021, and prices rose to historic highs. The outbreak persisted for more than a year, winding down in April 2023. Even as the outbreak continued in the spring, turkey production had already begun to recover from the mid-2022 low point, when depopulation resulted in sharply lower turkey numbers. Since April 2023, production has been above the previous year’s levels, partly because birds were being slaughtered at heavier weights. Detections of HPAI in commercial turkey flocks in early October 2023 are not expected to have a major effect on the availability of turkeys in the 2023 holiday season. This chart is drawn from USDA, Economic Research Service’s Livestock, Dairy and Poultry Outlook, September 2023.
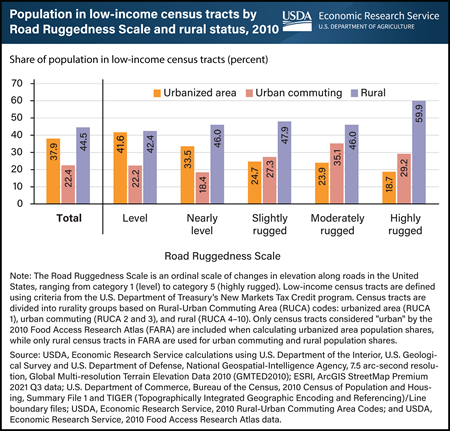
Uphill climb: The share of rural residents living in low-income areas increases with road ruggedness
Wednesday, November 1, 2023
In 2010, a higher share of rural residents lived in low-income census tracts, especially in places characterized by rugged terrain. Researchers with USDA, Economic Research Service (ERS) classified census tracts (the small geographic areas used to collect population data) by the change in elevation along their roads to create the new Road Ruggedness Scale. Using this scale in conjunction with data on income and how rural a place is, they found that as ruggedness increased, the share of rural residents living in low-income census tracts increased. In contrast, the share of residents in low-income census tracts in urbanized areas decreased as ruggedness increased. Nearly 60 percent of residents in highly rugged rural locations lived in low-income census tracts in 2010, compared with 42 to 48 percent of rural residents in less rugged census tracts. However, fewer than 20 percent of residents in highly rugged, urbanized areas lived in low-income census tracts, compared with nearly 42 percent of urbanized area residents in level census tracts. In urban commuting locations, the share of the population living in low-income census tracts generally increased with ruggedness, but with more variation in the trend. This chart appears in the ERS report Characterizing Rugged Terrain in the United States published in August 2023 and uses data available in ERS’s Ruggedness Scale data product.
Tuesday, October 31, 2023
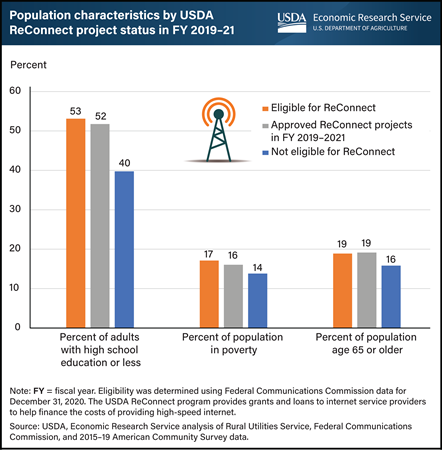
Households in nonmetro areas are more than four times as likely to lack broadband internet access as households in metro areas, according to December 2022 data from the Federal Communications Commission. To help bring broadband to rural areas, USDA’s ReConnect program—USDA’s largest rural broadband program—provides grants and loans to internet providers to help finance the costs of providing high-speed internet through broadband services. To be eligible for ReConnect funding, areas served by projects must be rural and have 90 percent or more of households without access to broadband at minimum upload and download speeds. USDA, Economic Research Service (ERS) researchers examined ReConnect projects proposed in fiscal years 2019 and 2020, finding that the populations of areas eligible for possible projects and areas of approved projects tended to have less formal educational attainment (a larger share of adults with high school or less), more poverty, and more people over the age of 65. About 53 percent of the population in ReConnect-eligible areas had high school or less educational attainment, compared with 40 percent in ineligible areas. Likewise, the poverty rate was higher in eligible areas (17 percent compared with 14 percent) as was the portion of the population over age 65 (19 percent compared with 16 percent). This chart appears in the ERS report Three USDA Rural Broadband Programs: Areas and Populations Served, published in October 2023.
Monday, October 30, 2023
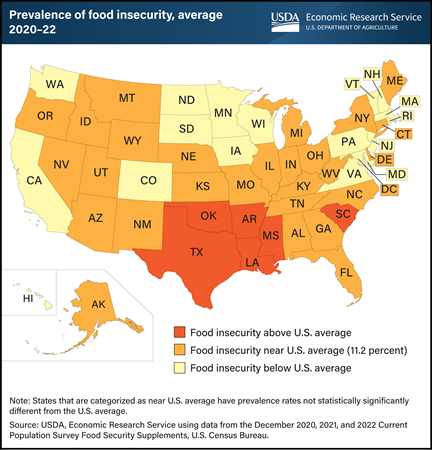
Food-insecure households sometimes have difficulty providing enough food for all their members because they lack resources. USDA, Economic Research Service (ERS) monitors the extent of food insecurity in U.S. households at the national and State levels through an annual U.S. Census Bureau survey. State-level estimates are obtained by averaging 3 years of data to generate a larger sample size in each State. This provides more precise estimates and more power to detect differences across States. The estimated prevalence rates of food insecurity during 2020–22 ranged from 6.2 percent in New Hampshire to 16.6 percent in Arkansas. The estimated national 3-year average for all States was 11.2 percent. The prevalence of food insecurity was statistically significantly higher than the national average in 6 States (AR, LA, MS, OK, SC, and TX) and statistically significantly lower than the national average in 17 States (CA, CO, HI, IA, MA, MD, MN, ND, NH, NJ, PA, RI, SD, VA, VT, WA, and WI). In the remaining 27 States and the District of Columbia, differences from the national average were not statistically significant. An interactive food insecurity map can be found on ERS’s Interactive Charts and Highlights page that allows users to view two measures of food insecurity over multiple years for each State. Users can see State trends in food insecurity, how States compare with national food insecurity prevalence rates, and how States compare with one another. This map appears on ERS’s Key Statistics & Graphics page.
Thursday, October 26, 2023
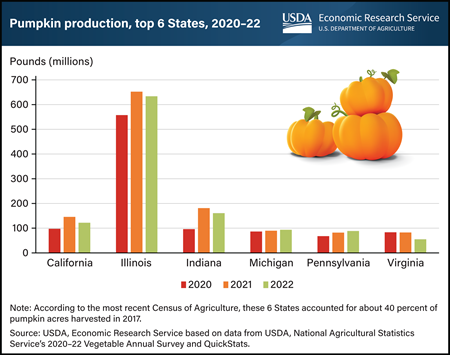
Pumpkins were one of the earliest cultivated crops in the Americas and have become one of the most distinctive symbols of fall. With a variety of uses, from pies and spiced coffee drinks to festive jack-o’-lanterns, pumpkins are grown commercially in every U.S. State. Production has trended up over the past two decades. In the early 2000s, about 4 pounds of the gourd were available per person, increasing to about 6 pounds per person in the 2020s. In the top 6 pumpkin-growing States, farms produced about 1.2 billion pounds in 2022. Illinois alone harvested 630 million pounds. The next 5 largest pumpkin-producing States by weight were Indiana with 160 million pounds, California with 120 million pounds, Michigan and Pennsylvania with 90 million pounds each, and Virginia with 50 million pounds. Most pumpkins are grown for decorative purposes, with a smaller amount processed into puree to be used in food products such as pies, muffins, or breads. However, in Illinois—the largest producer by both acres and weight—about 80 percent of the State’s harvested pumpkin acres are used for processing. This chart is drawn from the USDA, Economic Research Service’s Trending Topics Pumpkins: Background & Statistics page.
Wednesday, October 25, 2023
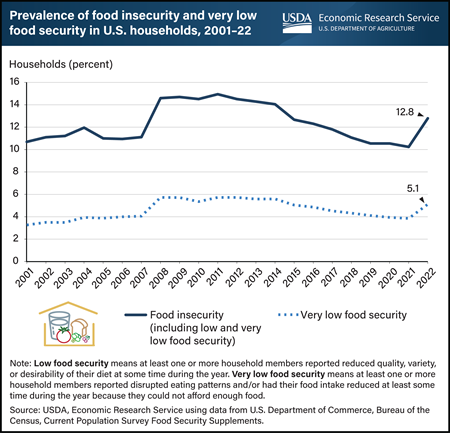
In 2022, 12.8 percent of U.S. households (17 million) were food insecure at some time during the year, meaning they had difficulty providing enough food for all their members because of a lack of resources. The prevalence of food insecurity in 2022 was statistically significantly higher than the 10.2 percent recorded in 2021 and the 10.5 percent in 2020. USDA, Economic Research Service (ERS) monitors the food security status of households in the United States through an annual nationwide survey. Very low food security is a more severe form of food insecurity in which the food intake of some household members was reduced and normal eating patterns were disrupted. The 2022 prevalence of very low food security was 5.1 percent, statistically significantly higher than the 3.8 percent in 2021 and the 3.9 percent in 2020. This chart appears on ERS’s Key Statistics & Graphics page and in the ERS report Household Food Security in the United States in 2022, published October 25, 2023.
Tuesday, October 24, 2023
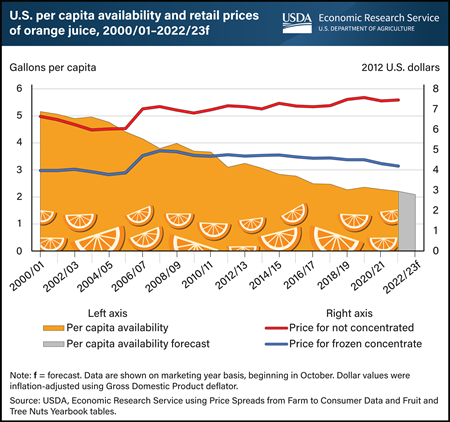
Orange juice, once a staple beverage in many U.S. households, has experienced a steady decline in consumption over the last two decades. While waning consumer demand has played a role, decreased domestic orange production has also negatively impacted per capita availability, a proxy measure for consumption. Orange juice imports from Brazil and Mexico have tempered some of this decline, however, availability of orange juice has fallen from about 5 gallons a person in the 2000/01 marketing year to a forecast of 2 gallons per person in 2022/23. Most oranges grown for the processing/juice market in the United States are harvested in Florida. In recent years, Florida’s citrus crop has suffered from disease and extreme weather events, resulting in smaller orange harvests. Reduced supply has contributed to generally higher orange juice prices. However, adjusted for inflation, prices for frozen concentrated orange juice and not from concentrate (the two main categories) increased at comparatively modest rates between 2000/01 and 2021/22. The price of frozen concentrated orange juice rose by 5 percent over 20 years, while orange juice not from concentrate rose by 12 percent over the same period. The modest increase in the real price highlights the impact of declining demand, somewhat muting the price effect associated with lower supply. This chart is based on the USDA, Economic Research Service (ERS) Fruit and Tree Nuts Outlook Report, released September 2023, and data from the ERS Fruit and Tree Nuts Yearbook and Price Spreads from Farm to Consumer.
Monday, October 23, 2023
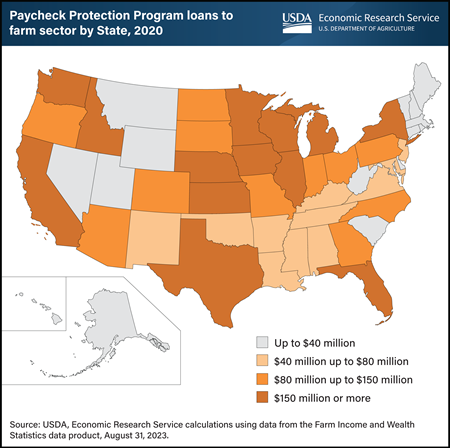
Researchers at the USDA, Economic Research Service estimate that the Paycheck Protection Program (PPP) provided $5.8 billion to the farm sector in 2020. The PPP was a non-USDA assistance program for small businesses adversely affected by the pandemic. Total Federal Government payments to the farm sector in 2020 were $45.6 billion, meaning that PPP payments were 13 percent of total payments. The Small Business Administration (SBA) administered the PPP, providing forgivable loans to eligible small businesses and certain other entities to allow them to cover some of their payroll costs. Businesses had to meet specific eligibility requirements, such as having positive payroll and/or making profits. The PPP loans were forgiven in full if the loan was used on eligible expenses, including at least 60 percent on payroll expenses. Agricultural producers in California were the largest recipients of PPP loans at $1.1 billion, followed by Washington at $285 million. California leads the Nation in the value of agricultural production and has the highest hired labor expense among States. Other top recipients of PPP loans included Texas ($281.5 million), Iowa ($252.6 million), Illinois ($251.8 million), and Florida ($247 million). The latest publicly available data from the SBA show almost all the PPP loans (98 percent) made to the farm sector in 2020 have been forgiven. This map updates information in COVID-19 Working Paper: Distribution and Examination of Coronavirus Food Assistance Program Payments and Forgivable Paycheck Protection Program Loans at the State Level in 2020, published August 2023.
Thursday, October 19, 2023
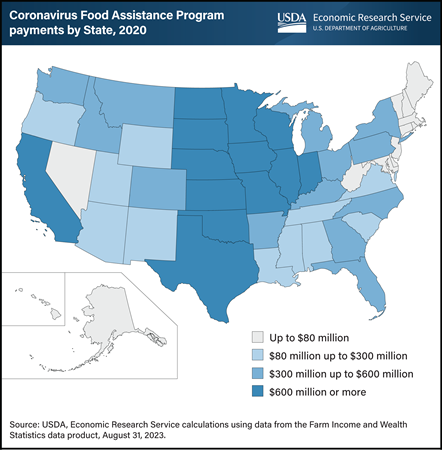
In 2020, two rounds of Coronavirus Food Assistance Program (CFAP) payments provided $23.5 billion to U.S. farmers and ranchers who faced sales losses, lower prices, or increased production and marketing costs associated with the Coronavirus (COVID-19) pandemic. The CFAP was USDA’s primary pandemic assistance program. According to the USDA, Economic Research Service data product Farm Income and Wealth Statistics, producers in nine States received more than a billion dollars each in estimated CFAP payments in 2020. Those States were: Iowa ($2.1 billion), California ($1.8 billion), Nebraska ($1.6 billion), Minnesota ($1.4 billion), Texas ($1.3 billion), Illinois ($1.3 billion), Kansas ($1.1 billion), Wisconsin ($1.0 billion), and South Dakota ($1.0 billion). In calendar year 2020, direct Federal payments to U.S. farmers and ranchers totaled $45.6 billion. Therefore, the payments made from CFAP were more than half of all direct government payments made that year. CFAP continued to make payments to U.S. producers and ranchers in 2021. This chart updates information that appeared in the USDA, Economic Research Service report COVID-19 Working Paper: Distribution and Examination of Coronavirus Food Assistance Program Payments and Forgivable Paycheck Protection Program Loans at the State Level in 2020, published August 2023.
Wednesday, October 18, 2023
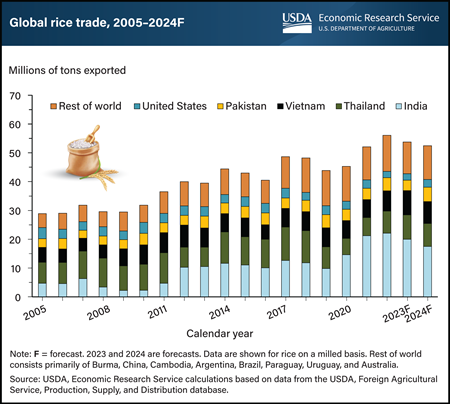
Global rice trade is projected to decline in 2023 and 2024 after India, the world’s largest rice exporter, implemented additional export restrictions on rice in July and August 2023. India accounted for more than 40 percent of global exports in 2022, supplying more rice than each of the next four largest suppliers—Thailand, Vietnam, Pakistan, and the United States. In summer 2023, India placed a ban on export sales of regular-milled white rice while imposing tariffs and additional restrictions on other types of exported rice. Global prices for rice then rose by 12 to 14 percent by the end of July. Prices continued to surge in August, reaching their highest since 2008, dropping slightly by mid-September as panic buying slowed. The impact is felt by many of the world’s food-insecure countries, especially in Sub-Saharan Africa, India’s largest export market. This region is expected to import less rice in 2023 and 2024 even as Thailand, Vietnam, and Pakistan pick up additional sales, despite tight supplies in Thailand and Vietnam. This chart is drawn from the October 2023 Rice Outlook, published by USDA, Economic Research Service. Also see the August 2023 and September 2023 Rice Outlook.
Tuesday, October 17, 2023
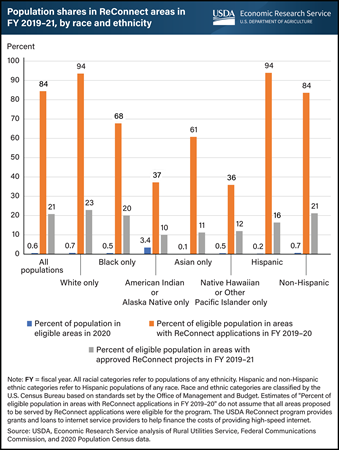
The ReConnect program is one of several USDA efforts to help improve broadband access in rural areas. Nearly 16 percent of households in nonmetro areas lacked access to broadband (high-speed internet) in December 2022, compared with about 3 percent of households in metro areas, according to data from the Federal Communications Commission. Researchers with the USDA’s Economic Research Service (ERS) examined the racial and ethnic characteristics of the people in areas eligible for ReConnect grant and loan projects to understand how well the program has served different rural groups. Based on data from the first two rounds of ReConnect funding, initiated in fiscal years 2019 through 2021, researchers found that 3.4 percent of the overall American Indian/Alaska Native (AIAN) population in 2020 lived in areas eligible for ReConnect, which is targeted to rural areas with no broadband access. That marked a higher share of the population being eligible than for any other race or ethnicity, with the next closest being 0.7 percent of the White population. However, project applications came from organizations, such as internet service providers or telephone cooperatives, that served areas with lower shares of eligible AIAN people. For instance, even if every proposal in areas with an AIAN population had been funded, only 37 percent of the eligible AIAN population would have been reached, the second-lowest proportion across racial and ethnic groups. Approved projects served 10 percent of the eligible AIAN population, the lowest proportion of any racial or ethnic group. Overall, approved first and second round ReConnect projects are extending broadband service to 21 percent of the eligible population. This chart is drawn from the ERS report Three USDA Rural Broadband Programs: Areas and Populations Served, published in October 2023.
Monday, October 16, 2023
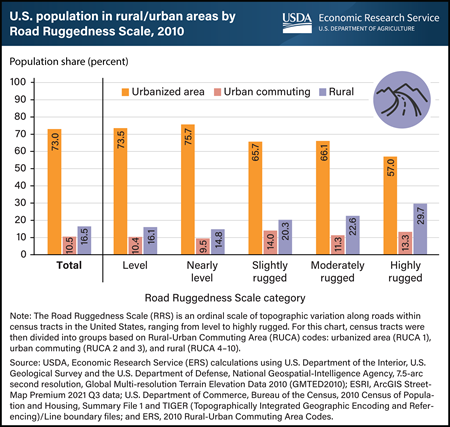
Researchers with USDA, Economic Research Service (ERS) developed the Road Ruggedness Scale—a five-category measure of topographic variability along roads—and used it to study the interplay of population, rurality, and ruggedness in the United States. They found that in 2010, as land became more rugged (had greater changes in elevation), generally more of the population lived in rural census tracts (the small geographic areas used to collect population data). For example, in level census tracts, the rural portion of residents was 16.1 percent, while the rural portion living in highly rugged census tracts was nearly double that amount (29.7 percent). The reverse was true for urbanized area census tracts, with the share of residents decreasing from 73.5 percent in level locations to 57.0 percent in highly rugged ones. However, even in the top ruggedness categories, most people lived in urbanized area census tracts, indicating that ruggedness and rurality are not synonymous. The relationship between ruggedness and rurality also varies by region. The rural population share in highly rugged census tracts of the Intermountain West (57.7 percent) and Appalachian Mountains (45.7 percent) was much higher than the national share of 29.7 percent, while the share in the Pacific Coast was much lower (18.6 percent). This chart appears in the ERS report Characterizing Rugged Terrain in the United States published on August 1, 2023.


