

Feeding the world: Global food production per person has grown over time
- by Ron Sands
- 11/13/2023
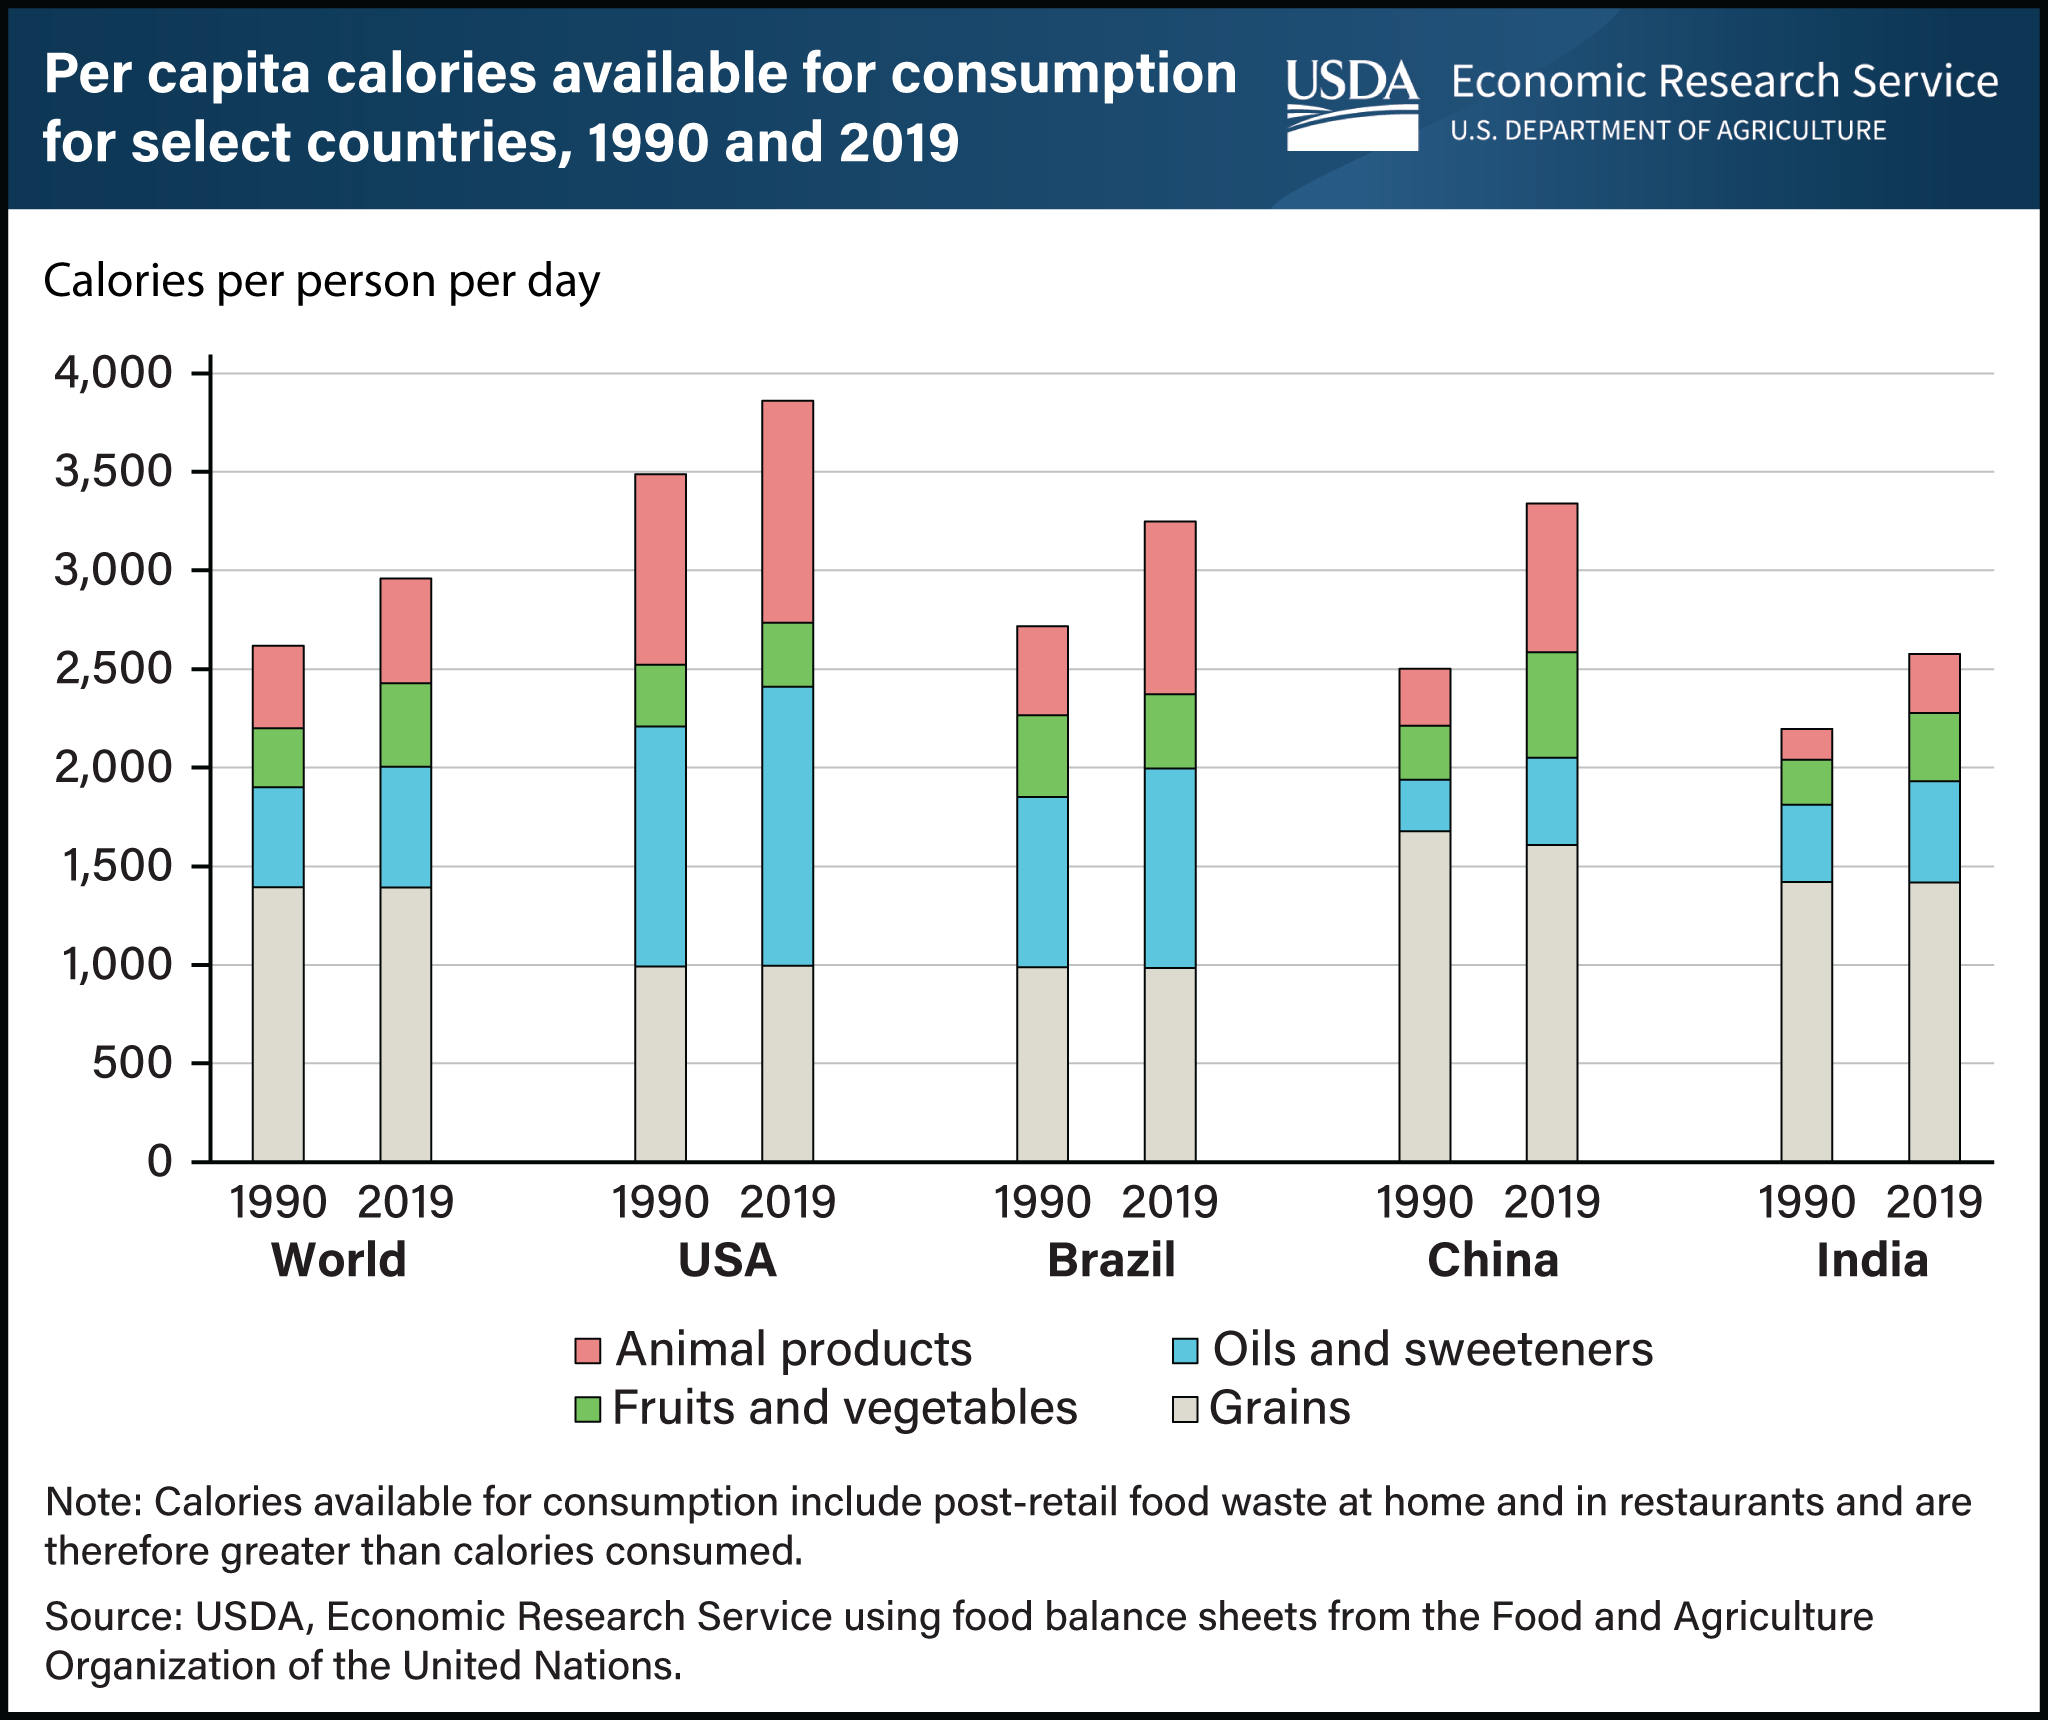
From 1990 through 2019, the calories available to consume per person increased 13 percent on average. The largest changes among the United States, Brazil, China, and India from 1990 to 2019 were in Brazil and China, with daily per capita food available for consumption increasing by 530 calories per person in Brazil and 840 calories in China (20 and 34 percent respectively). China was below the world average food consumption per person in 1990 but above the world average in 2019. The amount of different food types consumed in an individual country depends on income and culture, especially for animal products. Per capita consumption of animal products grew rapidly in Brazil and China but was still below the U.S. level in 2019. Per capita calorie consumption in India was lower than the world average in both 1990 and 2019. This chart appears in the USDA, Economic Research Service report Scenarios of Global Food Consumption: Implications for Agriculture published in September 2023.