
Newsroom
See what's new and what's trending from ERS.
Spotlight
-

Webinar: Farm Income and Financial Forecasts, February 2025 Update
During this webinar, ERS Economist Carrie Litkowski will present the first farm sector income and wealth forecasts for calendar year 2025.
New from ERS
-

United States and Global Macroeconomic Projections from 2024 to 2034
This report details the macroeconomic projections from 2024 to 2034, provides the state of the global economy, and an analysis of the influence of events over the past year in various regions and countries.
-
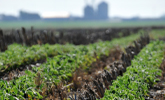
Economic Outcomes of Soil Health and Conservation Practices on U.S. Cropland
This report describes the complexity of producer decision making regarding soil health and conservation practices and provides new insights about the current rates of adoption and profitability of key practices in U.S. crop agriculture.
-

The Prevalence of Competing and Complementary Claims on U.S. Food Product Packaging: A Case Study of Claims on Milk and Yogurt
This report examines the use of food label claims on fluid milk and yogurt products including organic claims and other claims related to farm production methods.
-

Manufacturers' Bids for Infant Formula Rebate Contracts, 2013–23
This study summarizes trends in infant formula rebate contracts and examines factors that contribute to these trends. For contracts in effect in March 2023, WIC State agencies, on average, received rebates that exceeded manufacturers’ wholesale prices for their formula. This resulted in greater savings to WIC compared with previous contracts.
-

Who Regularly Uses the Nutrition Facts Label? Exploring Demographic, Socioeconomic, and Geographic Differences
Daily intakes of calories, fats, alcohol, sugars, and sodium were lower among adults who regularly used the Nutrition Facts label and disparities were found in label use by sex, race/ethnicity, education, income, and geographic area.
-

U.S. Household Food Spending Post COVID-19 and the Implications for Diet Quality
A combination of uncommon events—the Coronavirus (COVID-19) pandemic, food price inflation, and pandemic-related stimulus—induced significant changes in the types of foods purchased in the United States.
-

International Income and Price Elasticity Estimates: An Update
This report provides estimates of income and price elasticities for aggregate consumption categories as well as food subcategories. Income and price elasticity estimates vary across consumption categories and income groups.
-

Growing Demand for Broken Rice for Feed and Food: The Implications for Global Trade
Rice is one of the world’s most widely cultivated and consumed crops. Low-grade rice (or broken rice) has become an alternative substitute for animal feed, industrial processing, and blending into consumer products.
-

The Agricultural and Economic Value of Water
This report describes the ways the economic value of water is determined. It discusses challenges and opportunities associated with measuring the economic value of water, including the complexity of the systems involved, the diversity of preferences and usage, and the uncertainty of water availability
-

Assessing the Recent Shift in the Price Relationship Between India’s and Global Grain Markets
This report analyzes India’s trade restrictions and food programs following the Coronavirus (COVID-19) pandemic and international grain and oilseed prices and domestic market prices before and after the start of a new policy framework.