
Low-fat and nonfat ice cream production is heating up the market
- by Sara Scott and Angel Terán
- 7/18/2024
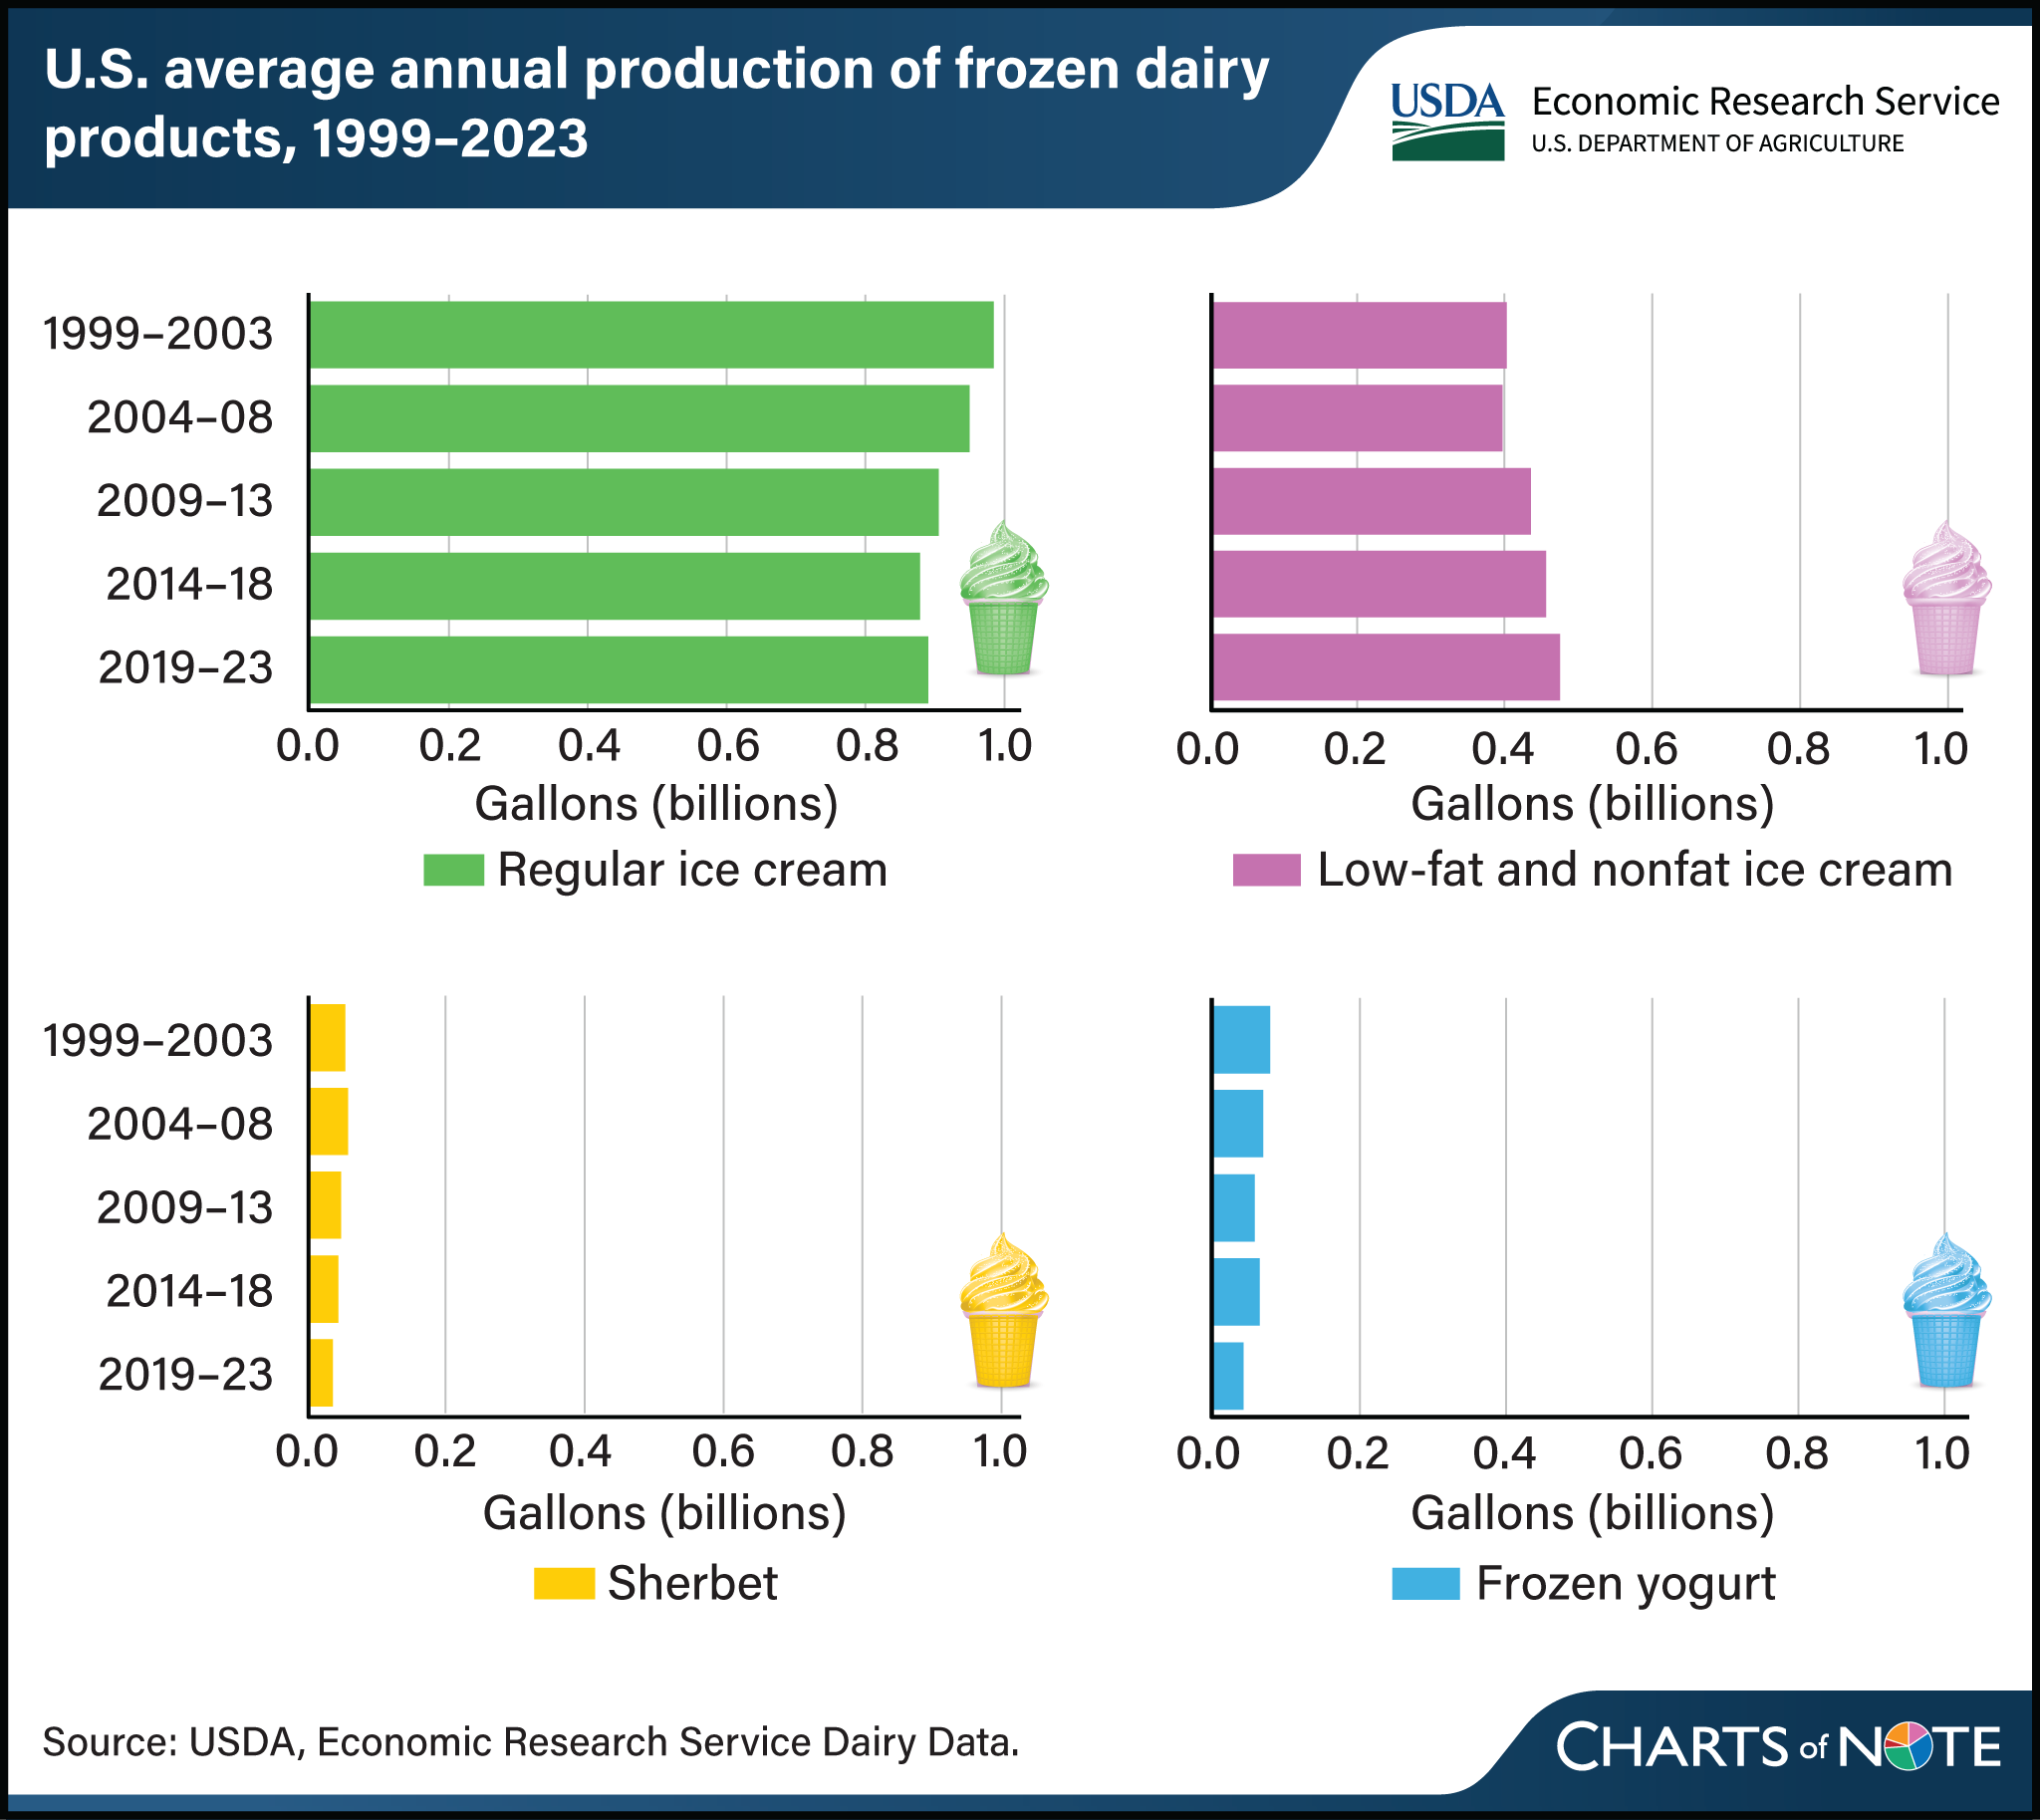
Production of ice cream in the United States totaled 1.3 billion gallons in 2023. While most frozen dairy product output is regular ice cream, consumer demand for lower-fat and lower-sugar options has increased production share and volume of low-fat and nonfat varieties over time. Average annual production of regular ice cream decreased after peaking in 2002 then increased again in 2019–23, while production of low-fat and nonfat ice cream increased during 2019–23 in part because of elevated ice cream demand during the Coronavirus (COVID-19) pandemic. In 2019–23, low-fat and nonfat ice cream production accounted for more than 35 percent of the total volume of ice cream churned in the United States, compared with 29 percent in 1999–2003. Production of frozen dairy treats such as sherbet and frozen yogurt remains relatively low by comparison. In aggregate, production of ice cream and other frozen dairy products have trended lower, declining from 1.5 billion gallons annually in 1999–2003 to 1.4 billion gallons in 2019–23. This decrease is in line with reduced deliveries of caloric sweeteners (an indicator of consumption of refined sugar and high-fructose corn syrup, among others) which peaked in 1999, reflecting shifting consumer preferences. This chart is drawn from Dairy Data and Sugar and Sweeteners Yearbook Tables, published by USDA, Economic Research Service.