

U.S. residents scooped more ice cream in 2000 than in 2019
- by Jerry Cessna and Angel Terán
- 7/14/2021
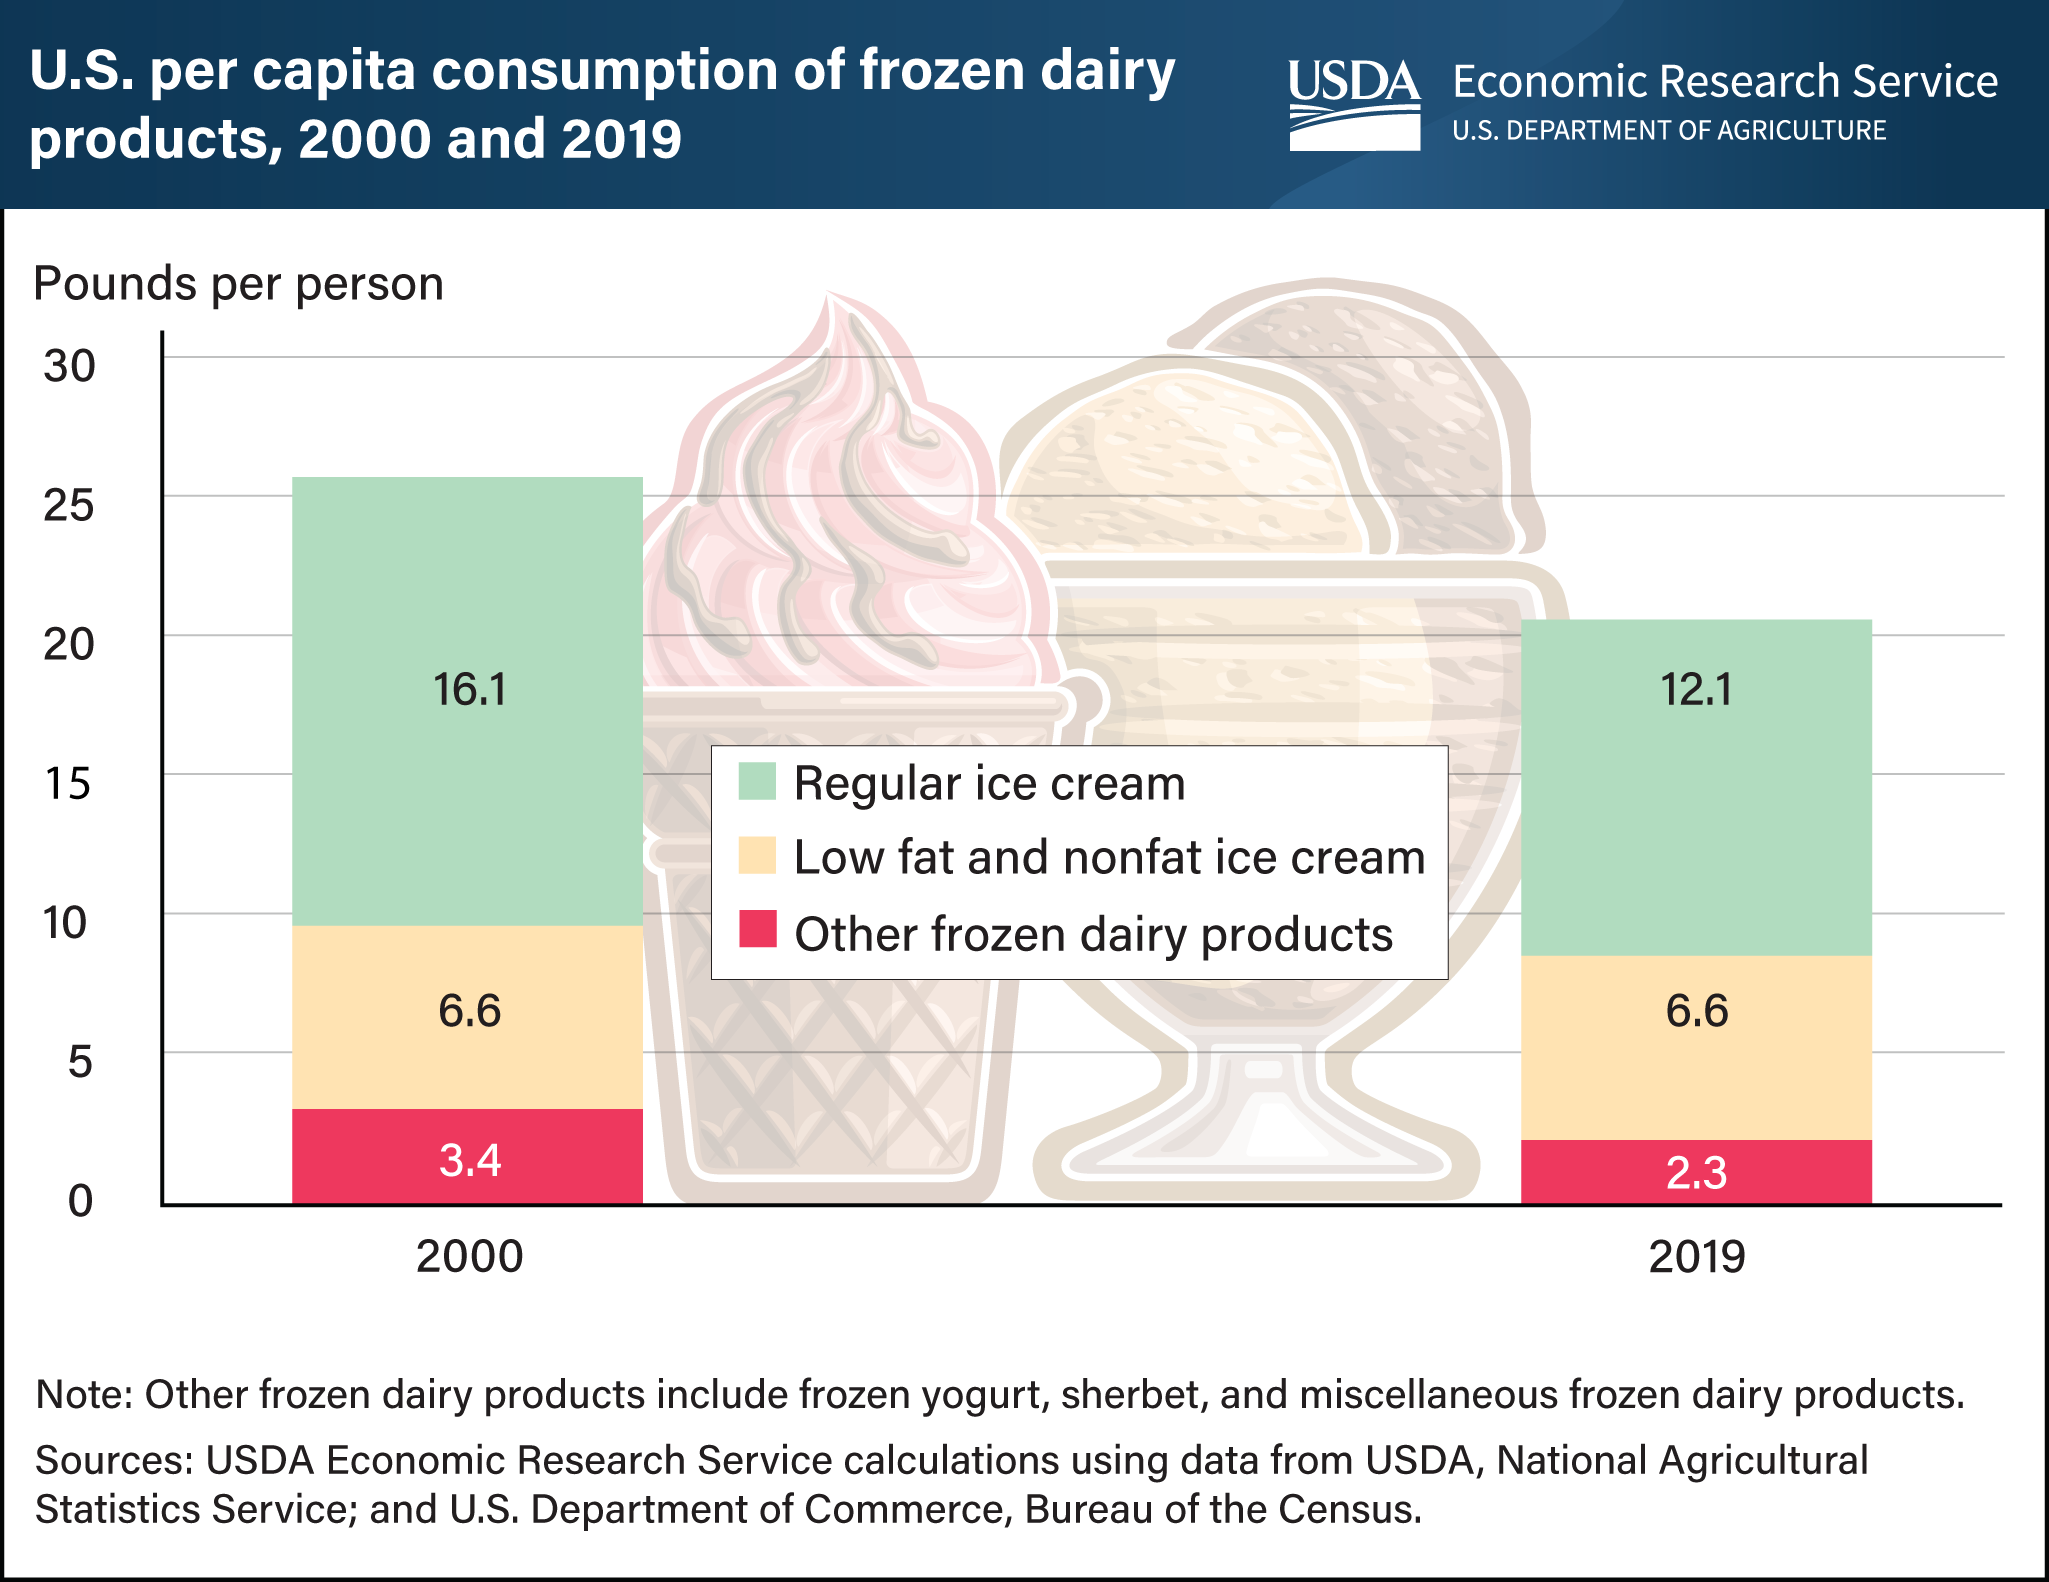
U.S. residents have been scooping less of their favorite frozen treats than two decades ago. In 2019, the most recent year for which complete data are available, U.S. residents consumed around 21 pounds of frozen dairy products per capita, about 4 pounds per capita less than in 2000. Consumption of regular ice cream in 2019 totaled 12.1 pounds per person, a decrease of about 4 pounds, or 25 percent, from 2000. At 6.6 pounds, per capita consumption of low fat and nonfat ice cream was about the same in 2019 as in 2000. Consumption of other frozen dairy products, which include frozen yogurt, sherbet, and miscellaneous frozen dairy products, decreased from 3.4 to 2.3 pounds per person. The downward trend in consumption of frozen dairy products corresponds with a 17 percent decline in consumption of caloric sweeteners between 2000 and 2019, reflecting increased consumer awareness about sugar intake. This chart is drawn from Dairy Data published by USDA, Economic Research Service (ERS). Information concerning caloric sweeteners is from ERS Sugar and Sweeteners Yearbook Tables.