



Some farms cover all economic costs in all size categories
- by Jeffrey Gillespie and Eric Njuki
- 2/13/2026
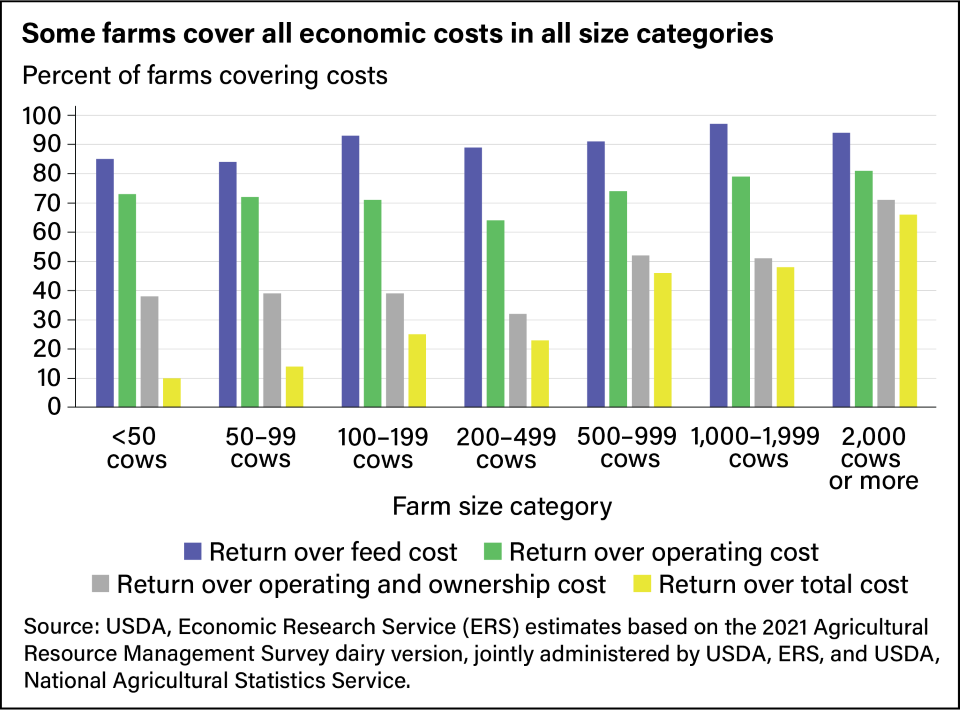
U.S. milk production has increased over the past 20 years, while the number of dairy farms has decreased. Larger farms, on average, produce milk at lower costs per unit, reflecting efficiencies gained through scale and technology adoption.
We’d welcome your feedback!
Would you be willing to answer a few quick questions about your experience?