
Retail food prices partially reflect farm-level commodity prices, but other costs of bringing food to the market (such as processing and retailing) have a greater role in determining prices on supermarket shelves and restaurant menus. Monthly price swings in grocery stores for individual food categories, as measured by the Consumer Price Index (CPI), tend to smooth out into modest yearly increases for food in general. In 2024, U.S. consumers, businesses, and government entities spent $2.58 trillion on food and beverages.
Food Prices and Spending
- Updated: 9/29/2025
- Contact: Anikka Martin
-
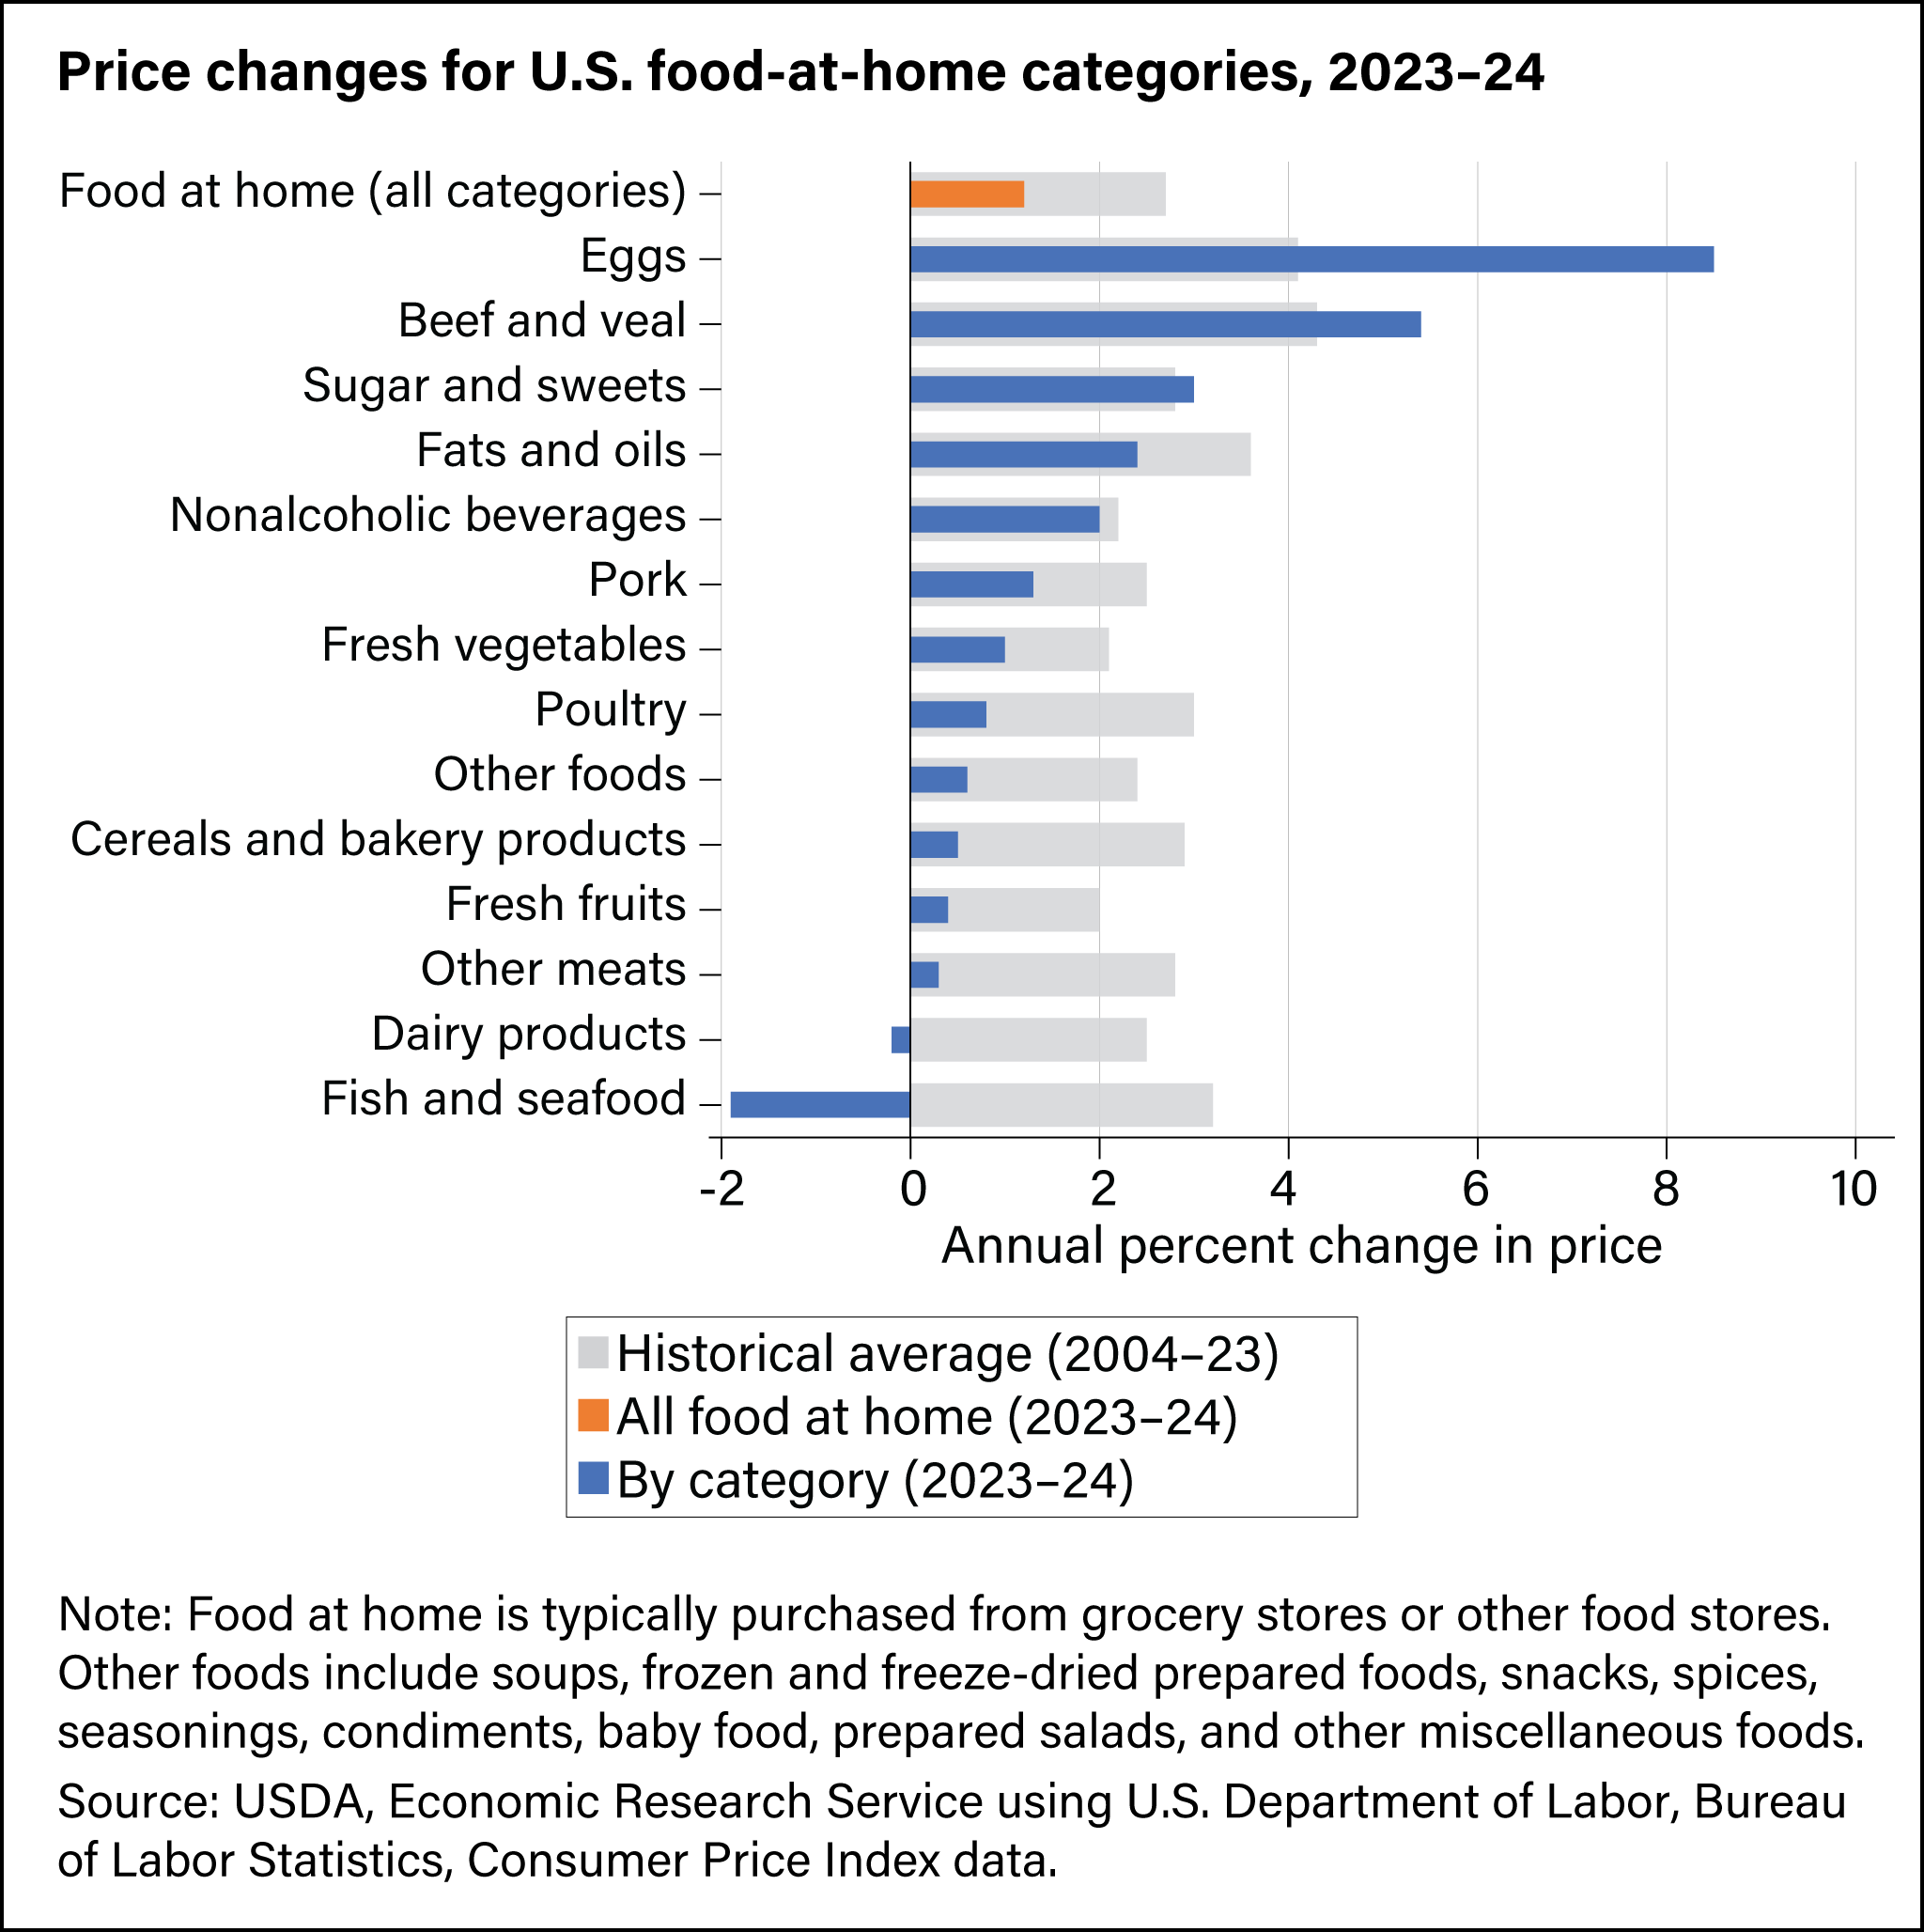
U.S. food-at-home prices increased 1.2 percent in 2024 compared with 2023
- by Victoria Davidenko and Megan Sweitzer
- 2/14/2025
Average annual food-at-home prices were 1.2 percent higher in 2024 than in 2023. For context, the 20-year historical level of retail food price inflation (2004–23) is 2.7 percent per year. Price growth continued to slow in 2024 compared with the increases in 2023 (5.0 percent) and 2022 (11.4 percent). Due to a resurgence of a highly pathogenic avian influenza (HPAI) outbreak that began in 2022, egg prices rose the most (8.5 percent) across products in 2024. The second largest price increase in 2024 was in beef and veal prices (5.4 percent), followed by sugar and sweets (3.0 percent). Prices for these three categories grew faster in 2024 compared with their historical averages. Prices for the remaining food-at-home categories grew slower than their historical averages in 2024. Prices for two categories declined in 2024, fish and seafood prices (1.9 percent) as well as dairy products (0.2 percent). Other than the categories that declined, those with the largest discrepancies from their historical averages included other meats (0.3 percent in 2024 compared with 2.8 percent, historically), cereals and bakery products (0.5 percent in 2024 compared with 2.9 percent, historically), and poultry (0.8 percent in 2024 compared with 3.0 percent, historically). -
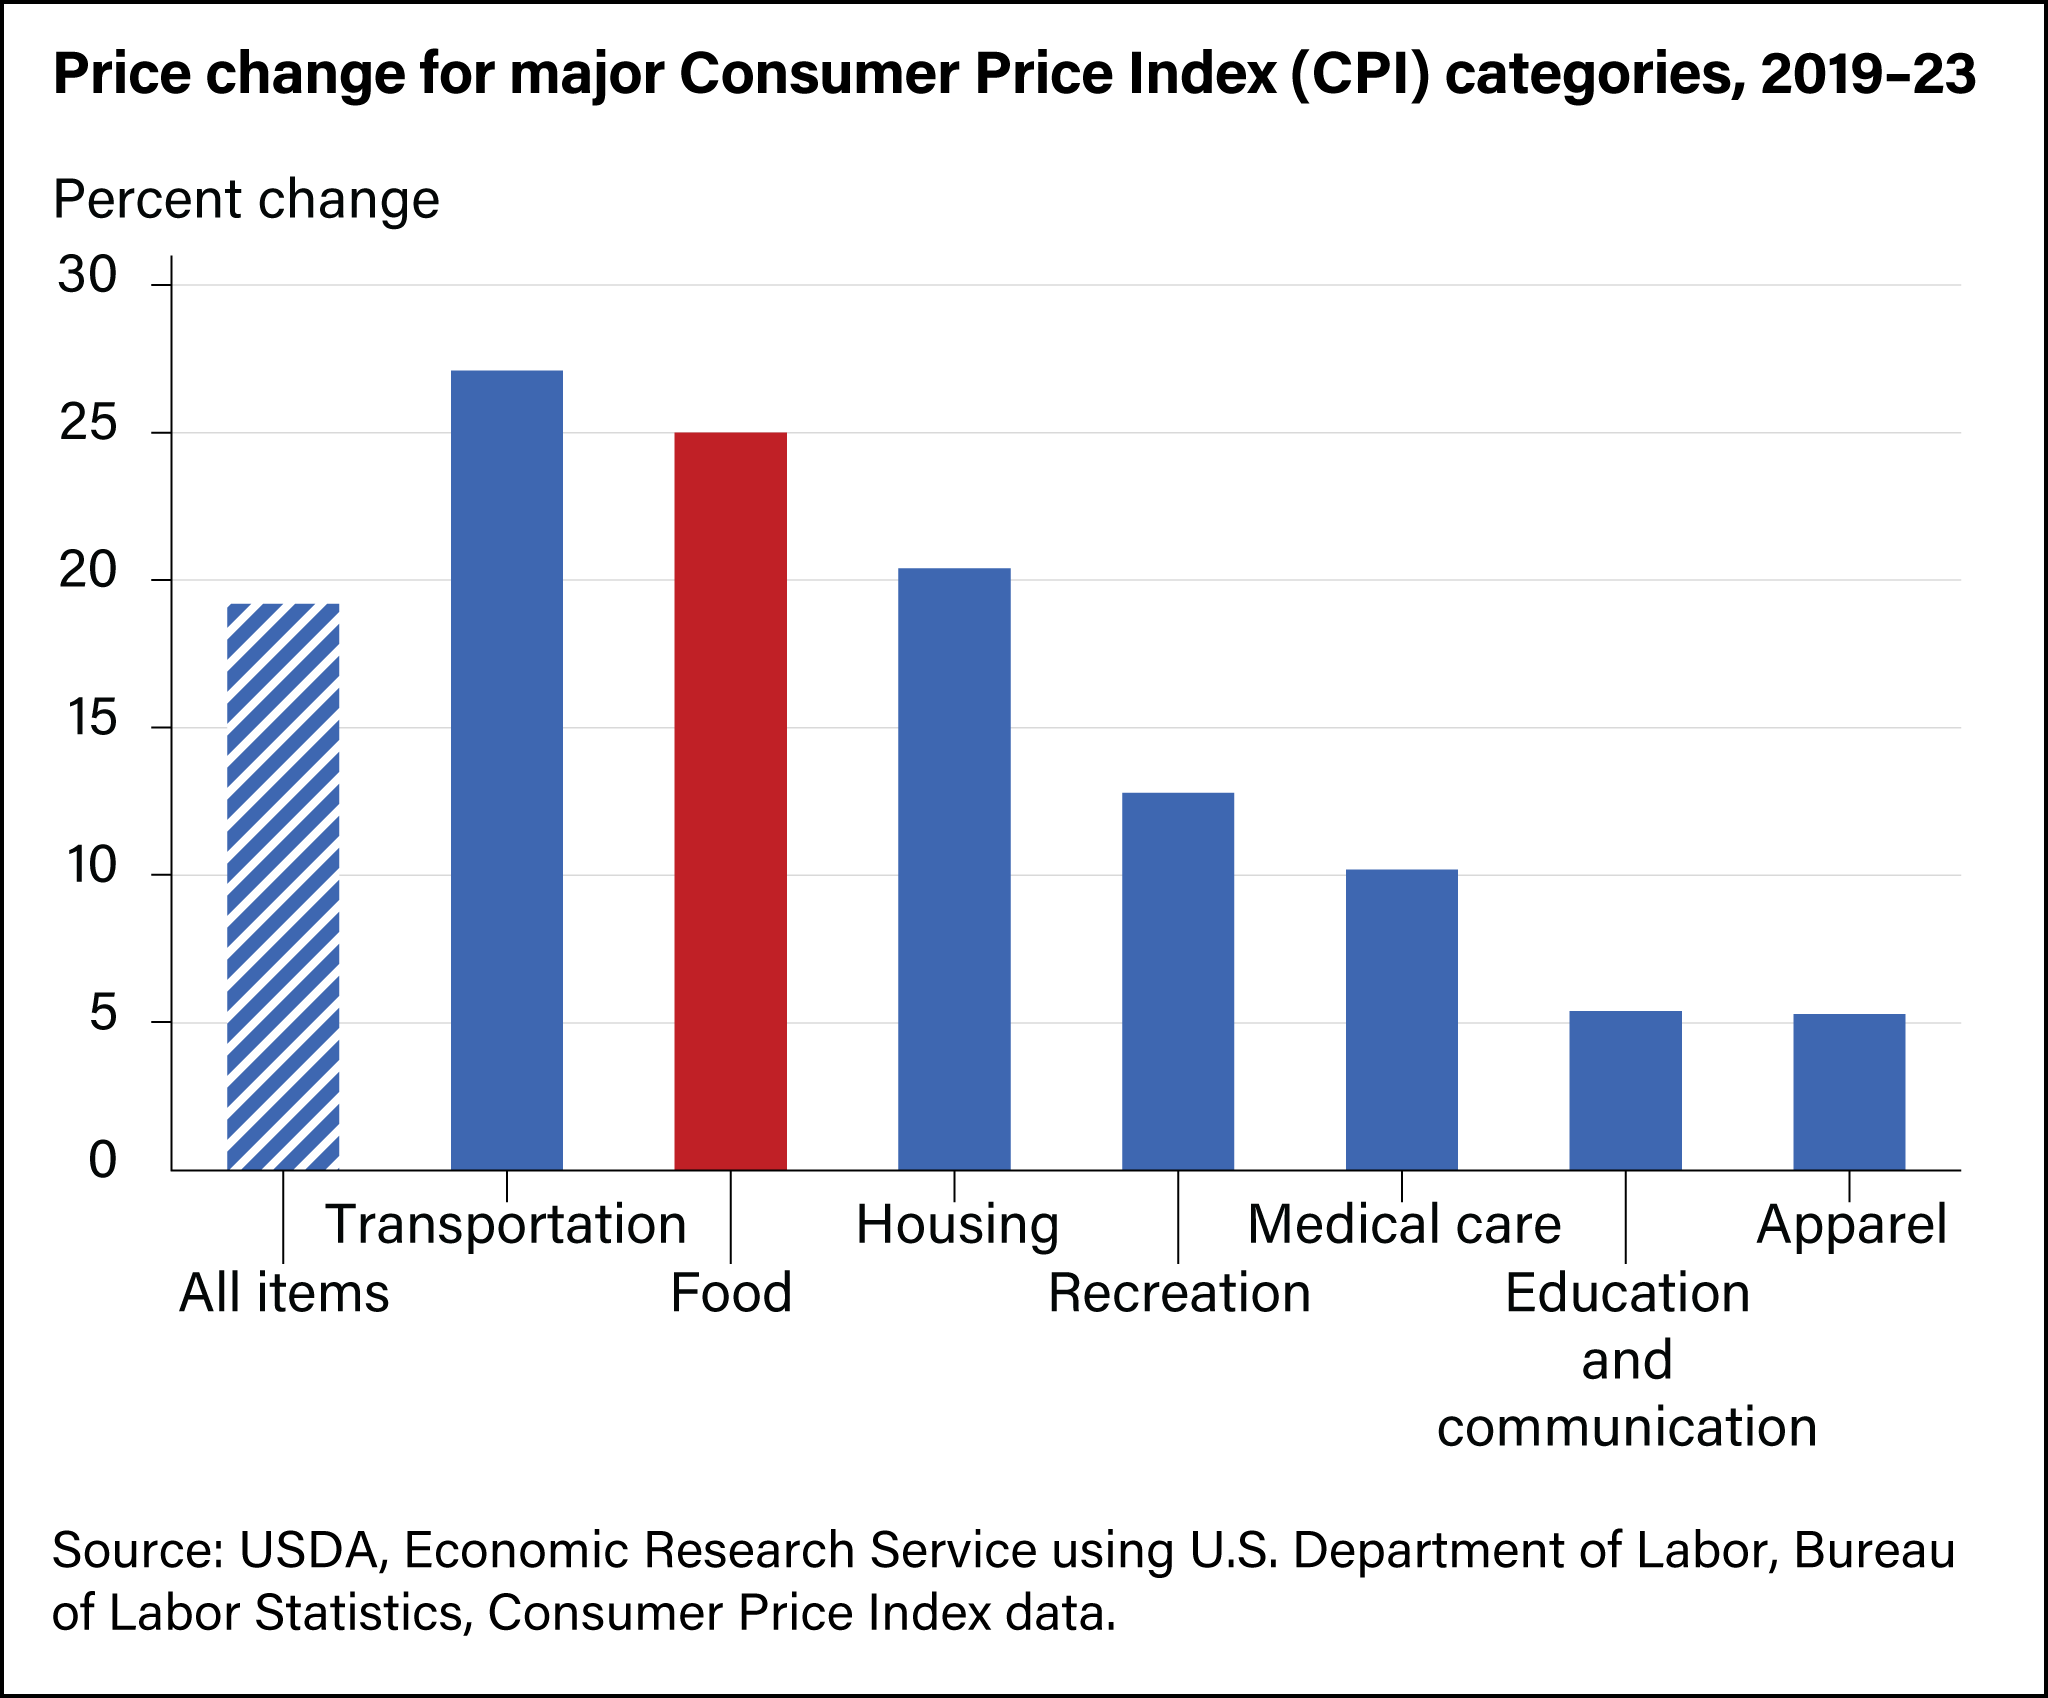
U.S. food prices rose by 23.6 percent from 2020 to 2024
- by Victoria Davidenko and Megan Sweitzer
- 2/14/2025
From 2020 to 2024, the all-food Consumer Price Index (CPI) rose 23.6 percent, a higher increase than the all-items CPI, which grew 21.2 percent over the same period. Transportation prices grew the fastest across categories, with an increase of 34.4 percent between 2020–24, while housing increased at a similar rate as food, by 23.0 percent. Food price increases in 2020–21 were largely driven by shifting consumption patterns and supply chain disruptions resulting from the Coronavirus (COVID-19) pandemic. In 2022, food prices increased faster than any year since 1979, due in part to a highly pathogenic avian influenza (HPAI) outbreak and the Russian invasion of Ukraine, which compounded other economy-wide inflationary pressures such as high energy costs. Food price growth slowed in 2023 and 2024 as wholesale food prices and these other inflationary factors eased across industries. -
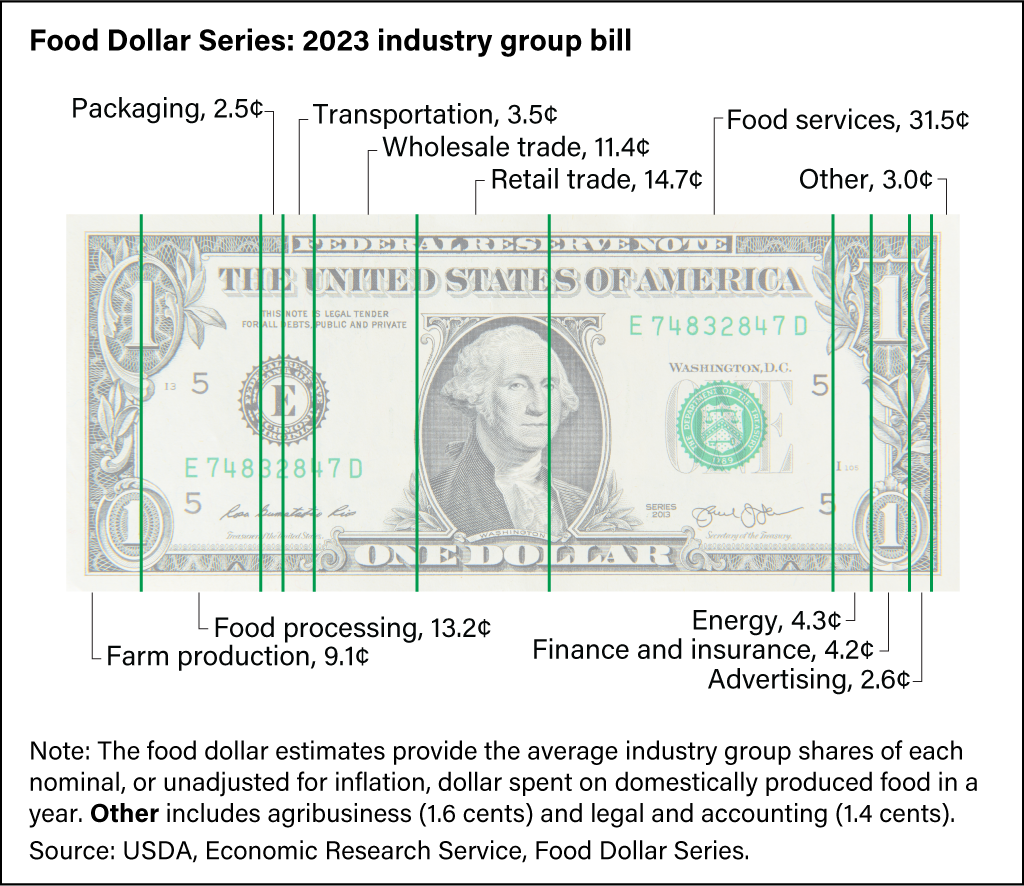
Retail and wholesale trade together accounted for more than one-quarter of the U.S. food dollar in 2023
- by Quinton Baker and James Chandler Zachary
- 11/18/2024
For a typical dollar spent in 2023 by U.S. consumers on domestically produced food, a combined 26.1 cents went to wholesale (11.4 cents) and retail (14.7 cents) trade establishments such as grocery stores, wholesale clubs, restaurant supply stores, and other food distribution outlets. After reaching a series high at a combined 28.2 cents in 2020, both the wholesale and retail trade shares have remained above their series averages of 10.6 cents and 13.9 cents, respectively. In 2023, food services was 31.5 cents, and food processing continued its trend downward to 13.2 cents, its lowest share since 1993, the first year recorded in the series. -
U.S. retail food prices are less volatile than farm prices
- by Megan Sweitzer and Victoria Davidenko
- 11/1/2024
Corn, wheat, and soybeans are the top three U.S. field crops and comprise the majority of field crop inputs to the U.S. food supply. The average farm price of these crops, weighted by total production, regularly rises or falls by more than 10 percent from one year to the next. However, these price swings have relatively small impacts on food prices. In 2023, the production-weighted price of these crops fell by 12.1 percent, while food prices increased by 5.8 percent. Intermediate foods and feeds price fluctuations generally fall between swings in field crop and food prices. -
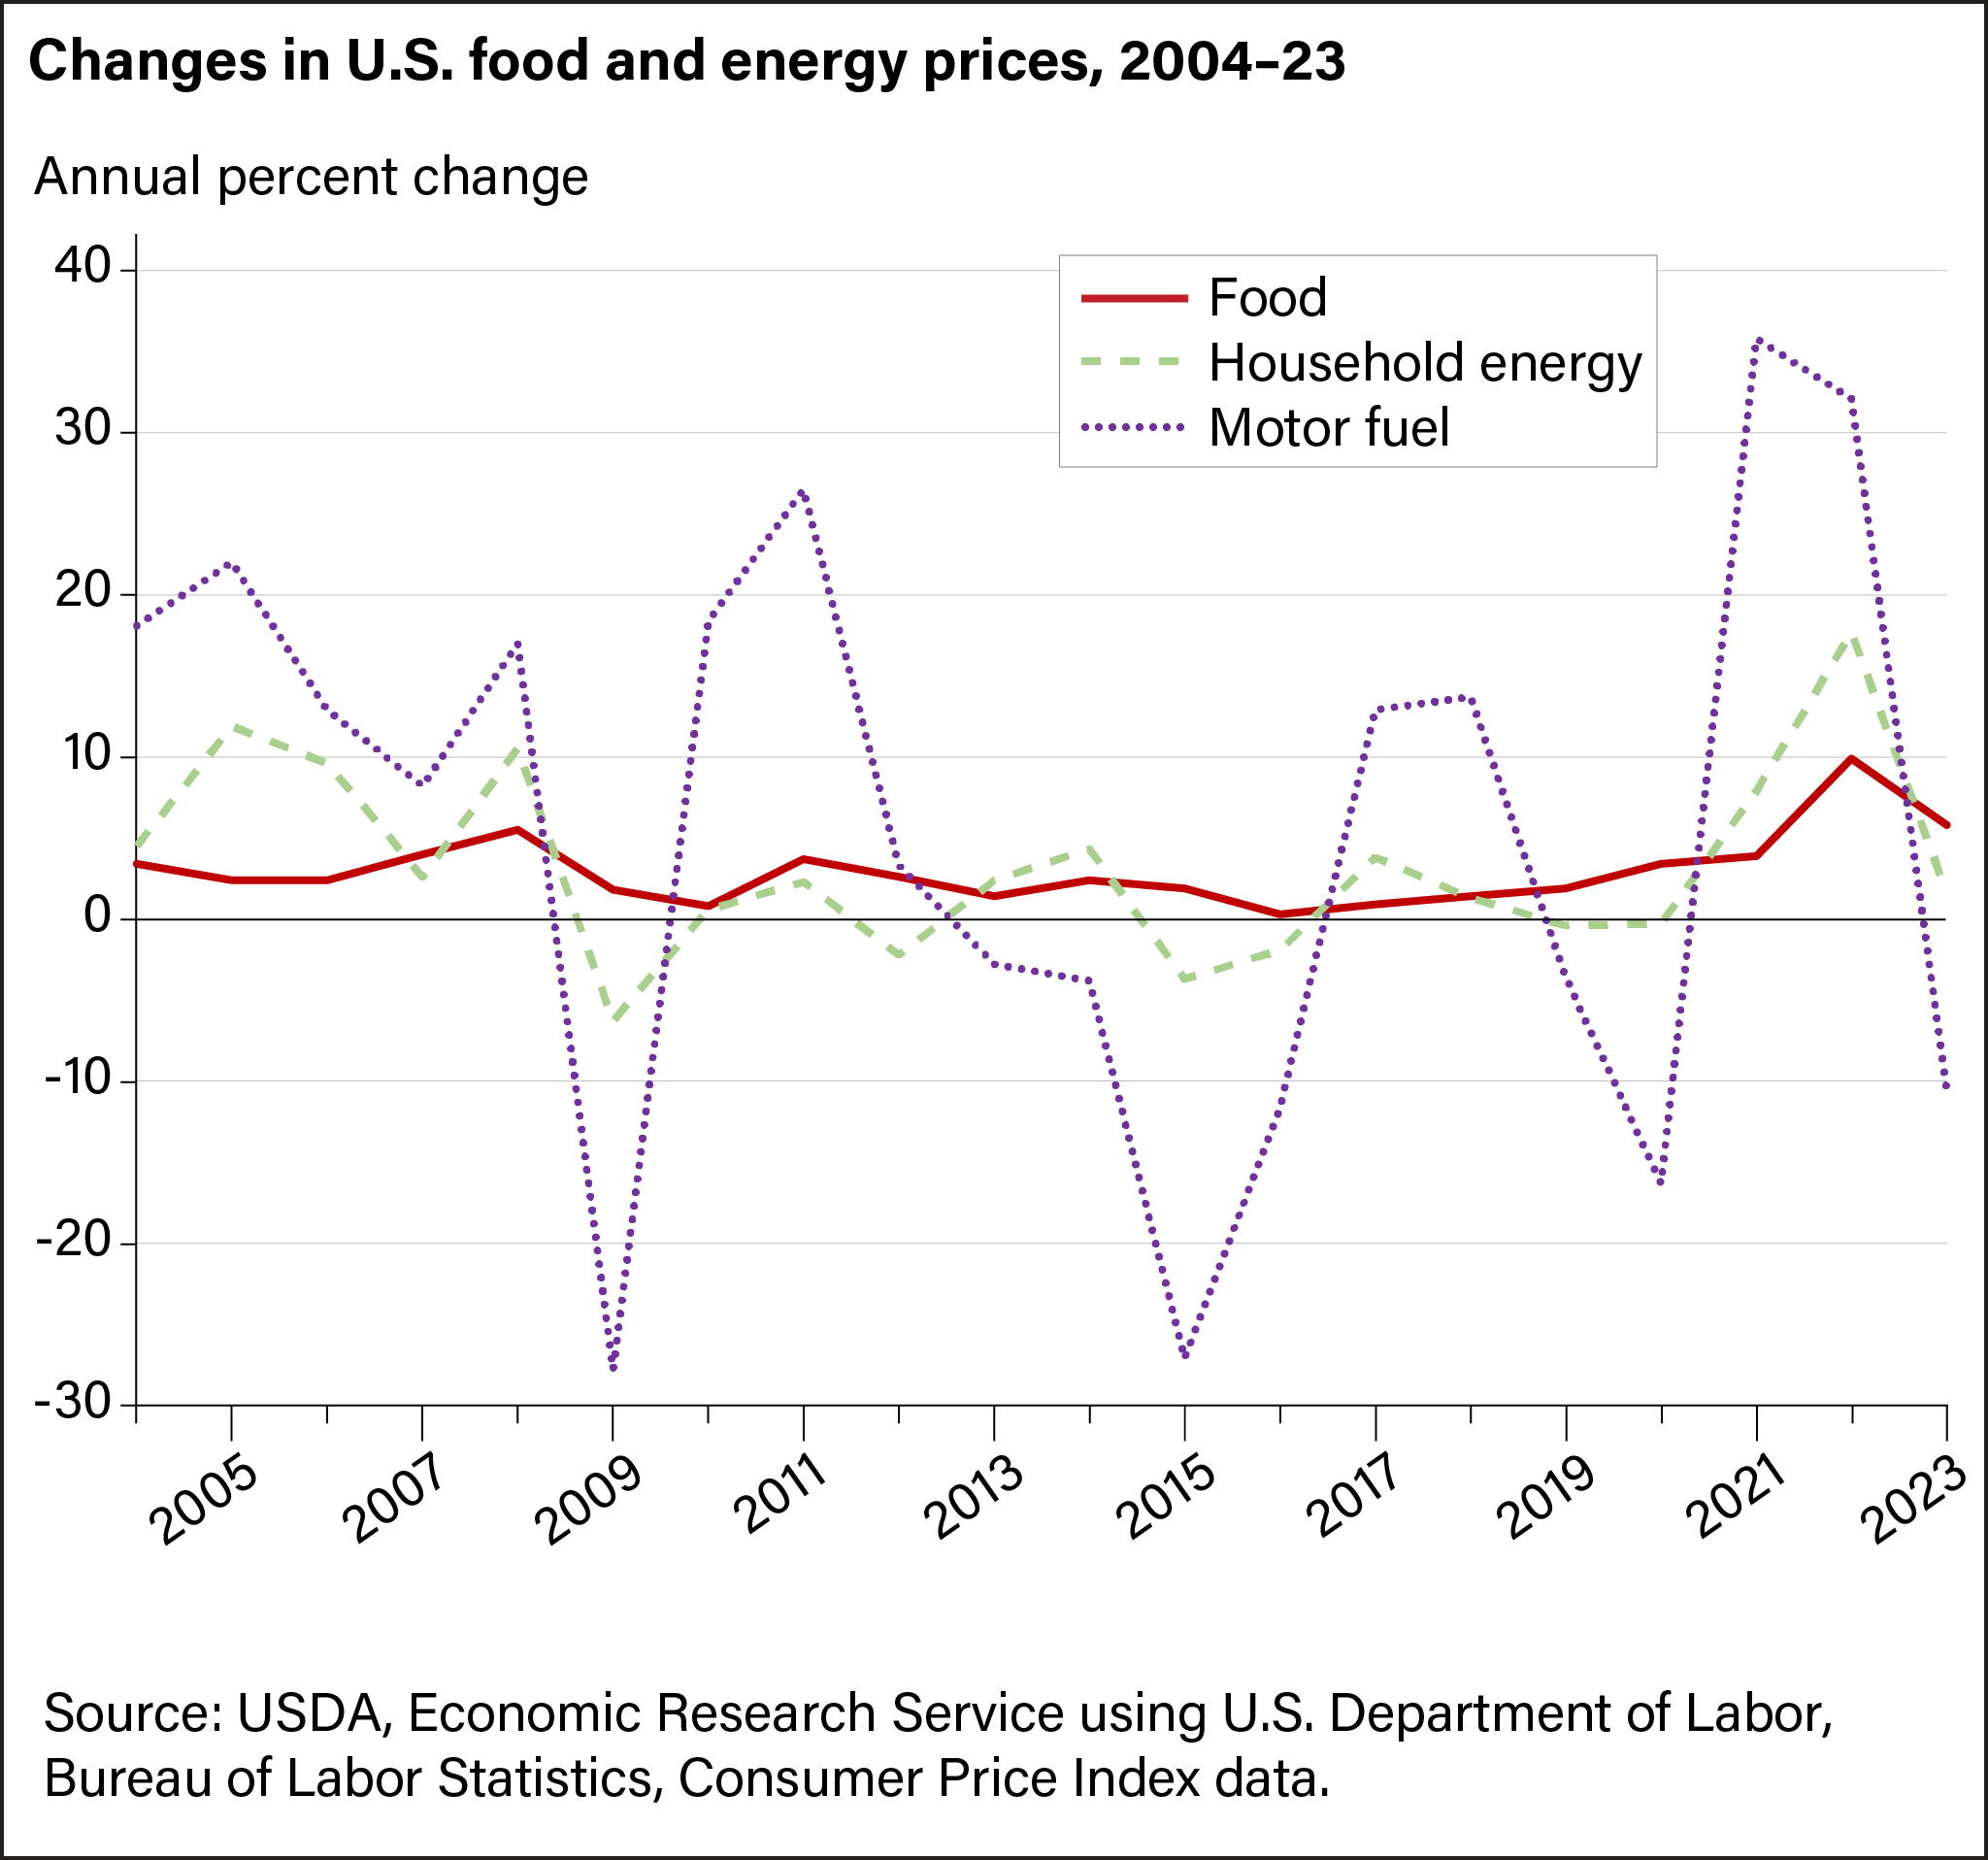
U.S. food prices are less volatile than fuel prices
- by Megan Sweitzer and Victoria Davidenko
- 2/14/2025
U.S. food and fuel prices are typically more volatile than other consumer spending categories but the sizes of the price swings differ. Over the past two decades, motor fuel prices often experienced double-digit annual price swings, and the average annual change in food prices (2.9 percent) was lower than household energy (3.2 percent) and motor fuel prices (4.7 percent). In 2024, food prices grew by 2.3 percent, while household energy prices increased by 2.4 percent and motor fuel prices declined by 5.3 percent. This followed relatively large increases for each of these categories in 2022 and a cooling period beginning in 2023. -
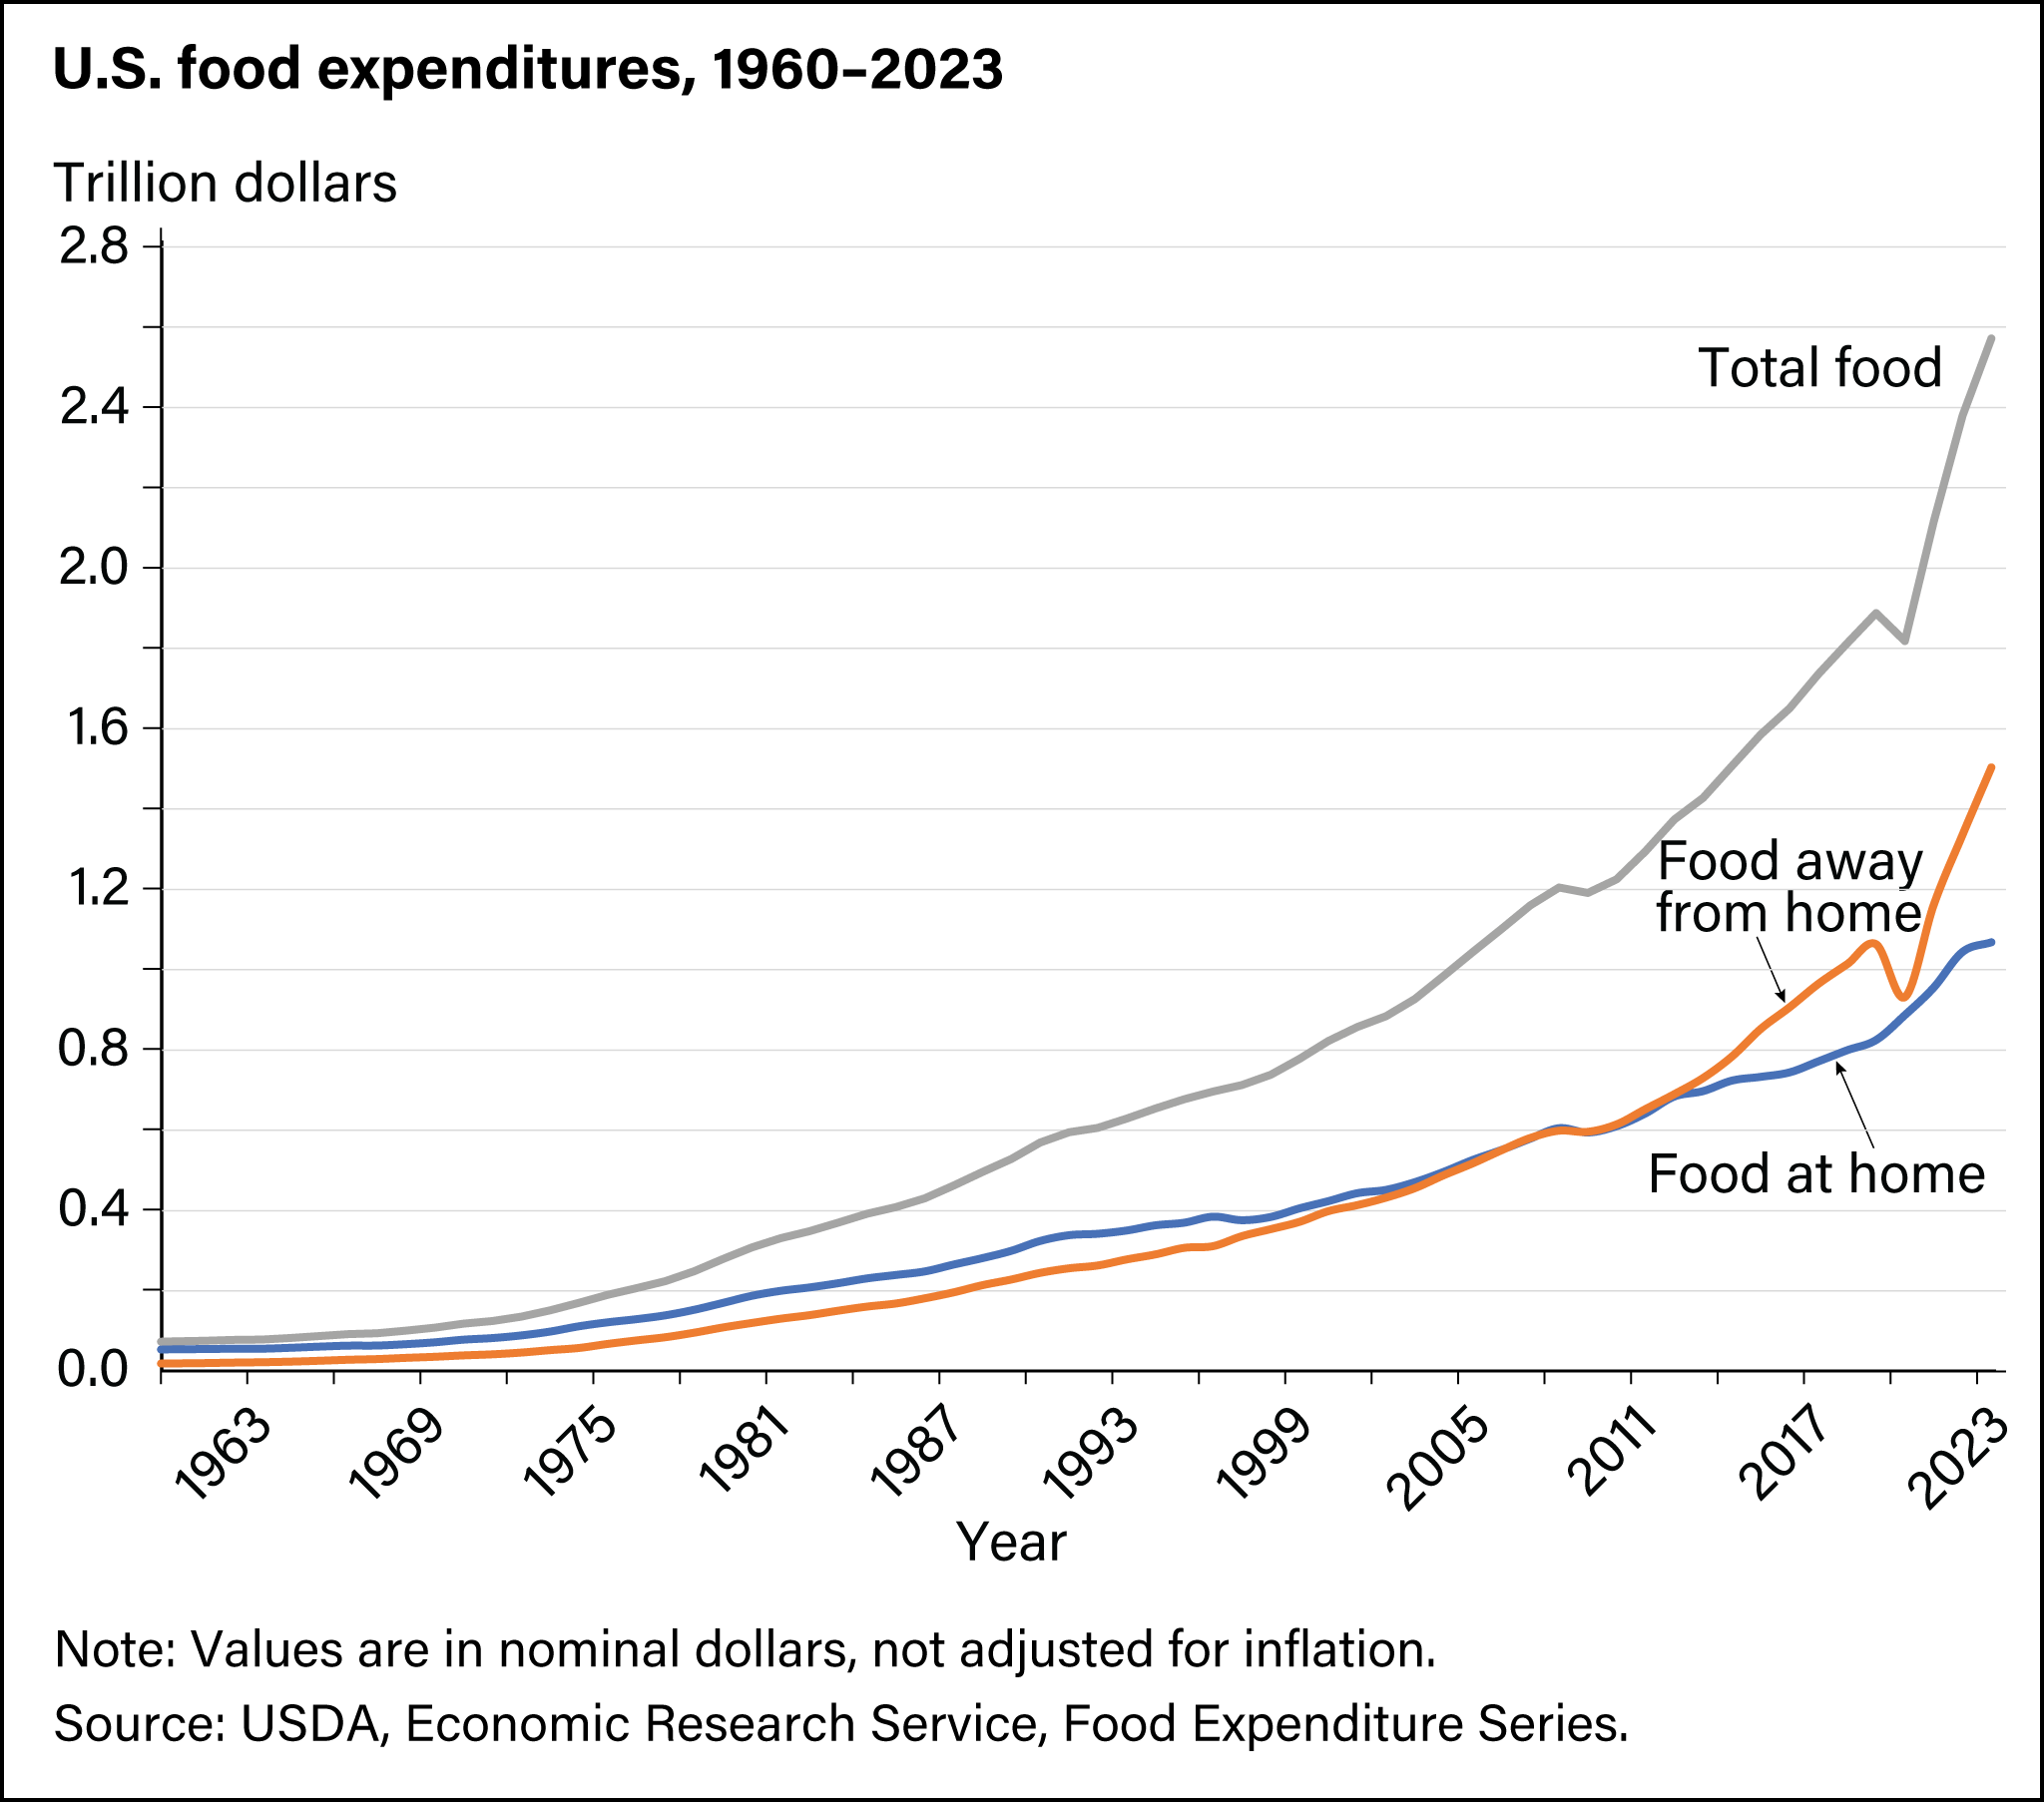
Total food spending reached $2.58 trillion in 2024
- by Eliana Zeballos and Wilson Sinclair
- 9/29/2025
In 2024, nominal (i.e., not adjusted for inflation) food expenditures by U.S. consumers, businesses, and government entities reached $2.58 trillion, up from $2.48 trillion in 2023. This increase was mainly driven by growth in food-away-from-home spending, climbing from $1.45 trillion in 2023 to $1.52 trillion in 2024. Meanwhile, food-at-home spending increased from $1.04 trillion in 2023 to $1.06 trillion in 2024. Food-away-from-home expenditures as a share of total food expenditures reached a high of 58.9 percent in 2024. -
Share of disposable personal income spent on food continues to decline in 2024
- by Eliana Zeballos and Wilson Sinclair
- 9/29/2025
In 2024, U.S. consumers spent an average of 10.4 percent of their disposable personal incomes on food, a decrease from 10.6 percent in 2023. This decline shows a small shift in consumer spending habits. Specifically, the budget share allocated to food-at-home spending decreased from 5.0 percent in 2023 to 4.9 percent in 2024. This indicates that consumers are spending a smaller portion of the money they have left after taxes on groceries and other food items they prepare and consume at home. The share of disposable income allocated to food-away-from-home spending, such as dining out at restaurants, remained unchanged at 5.5 percent in 2024. -
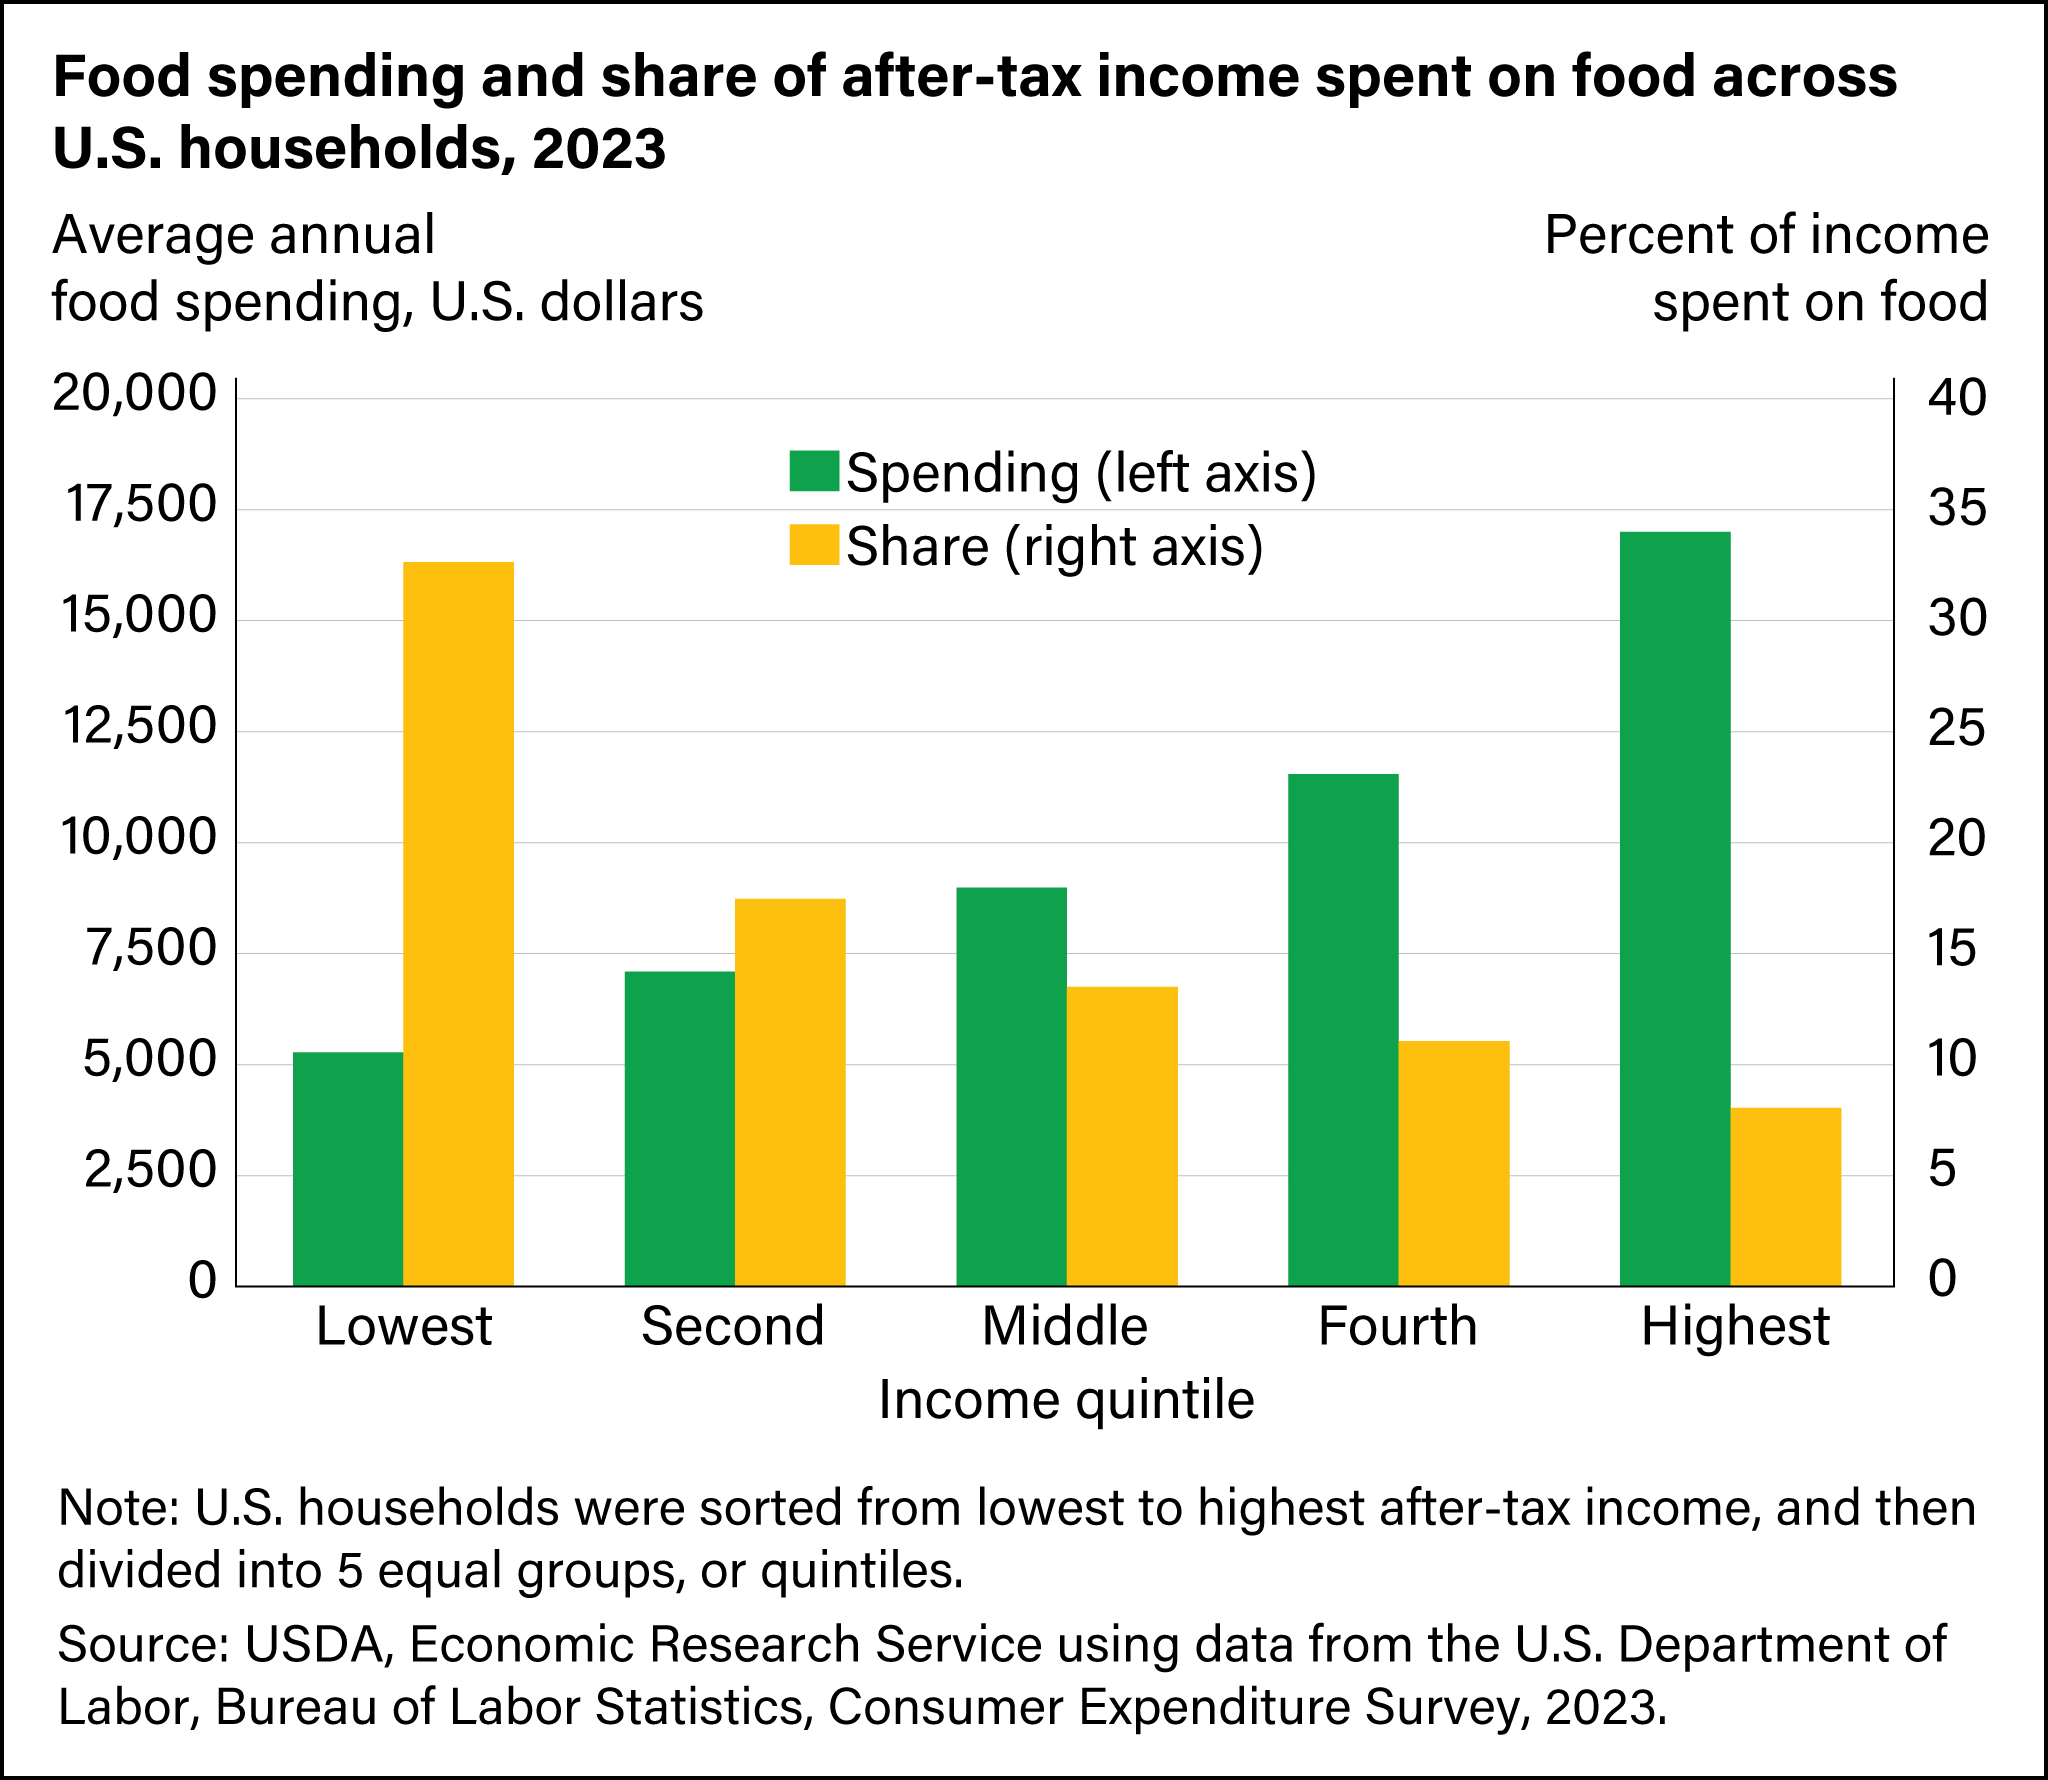
Food spending as a share of income declines as income rises
- by Megan Sweitzer and Victoria Davidenko
- 11/1/2024
As their incomes rise, U.S. households spend more money on food, but it represents a smaller share of their income. In 2023, households in the lowest income quintile spent an average of $5,278 on food (representing 32.6 percent of after-tax income). Households in the middle income quintile spent an average of $8,989 on food in 2023 (representing 13.5 percent of after-tax income). In 2023, households in the highest income quintile spent an average of $16,996 on food (representing 8.1 percent of after-tax income). -
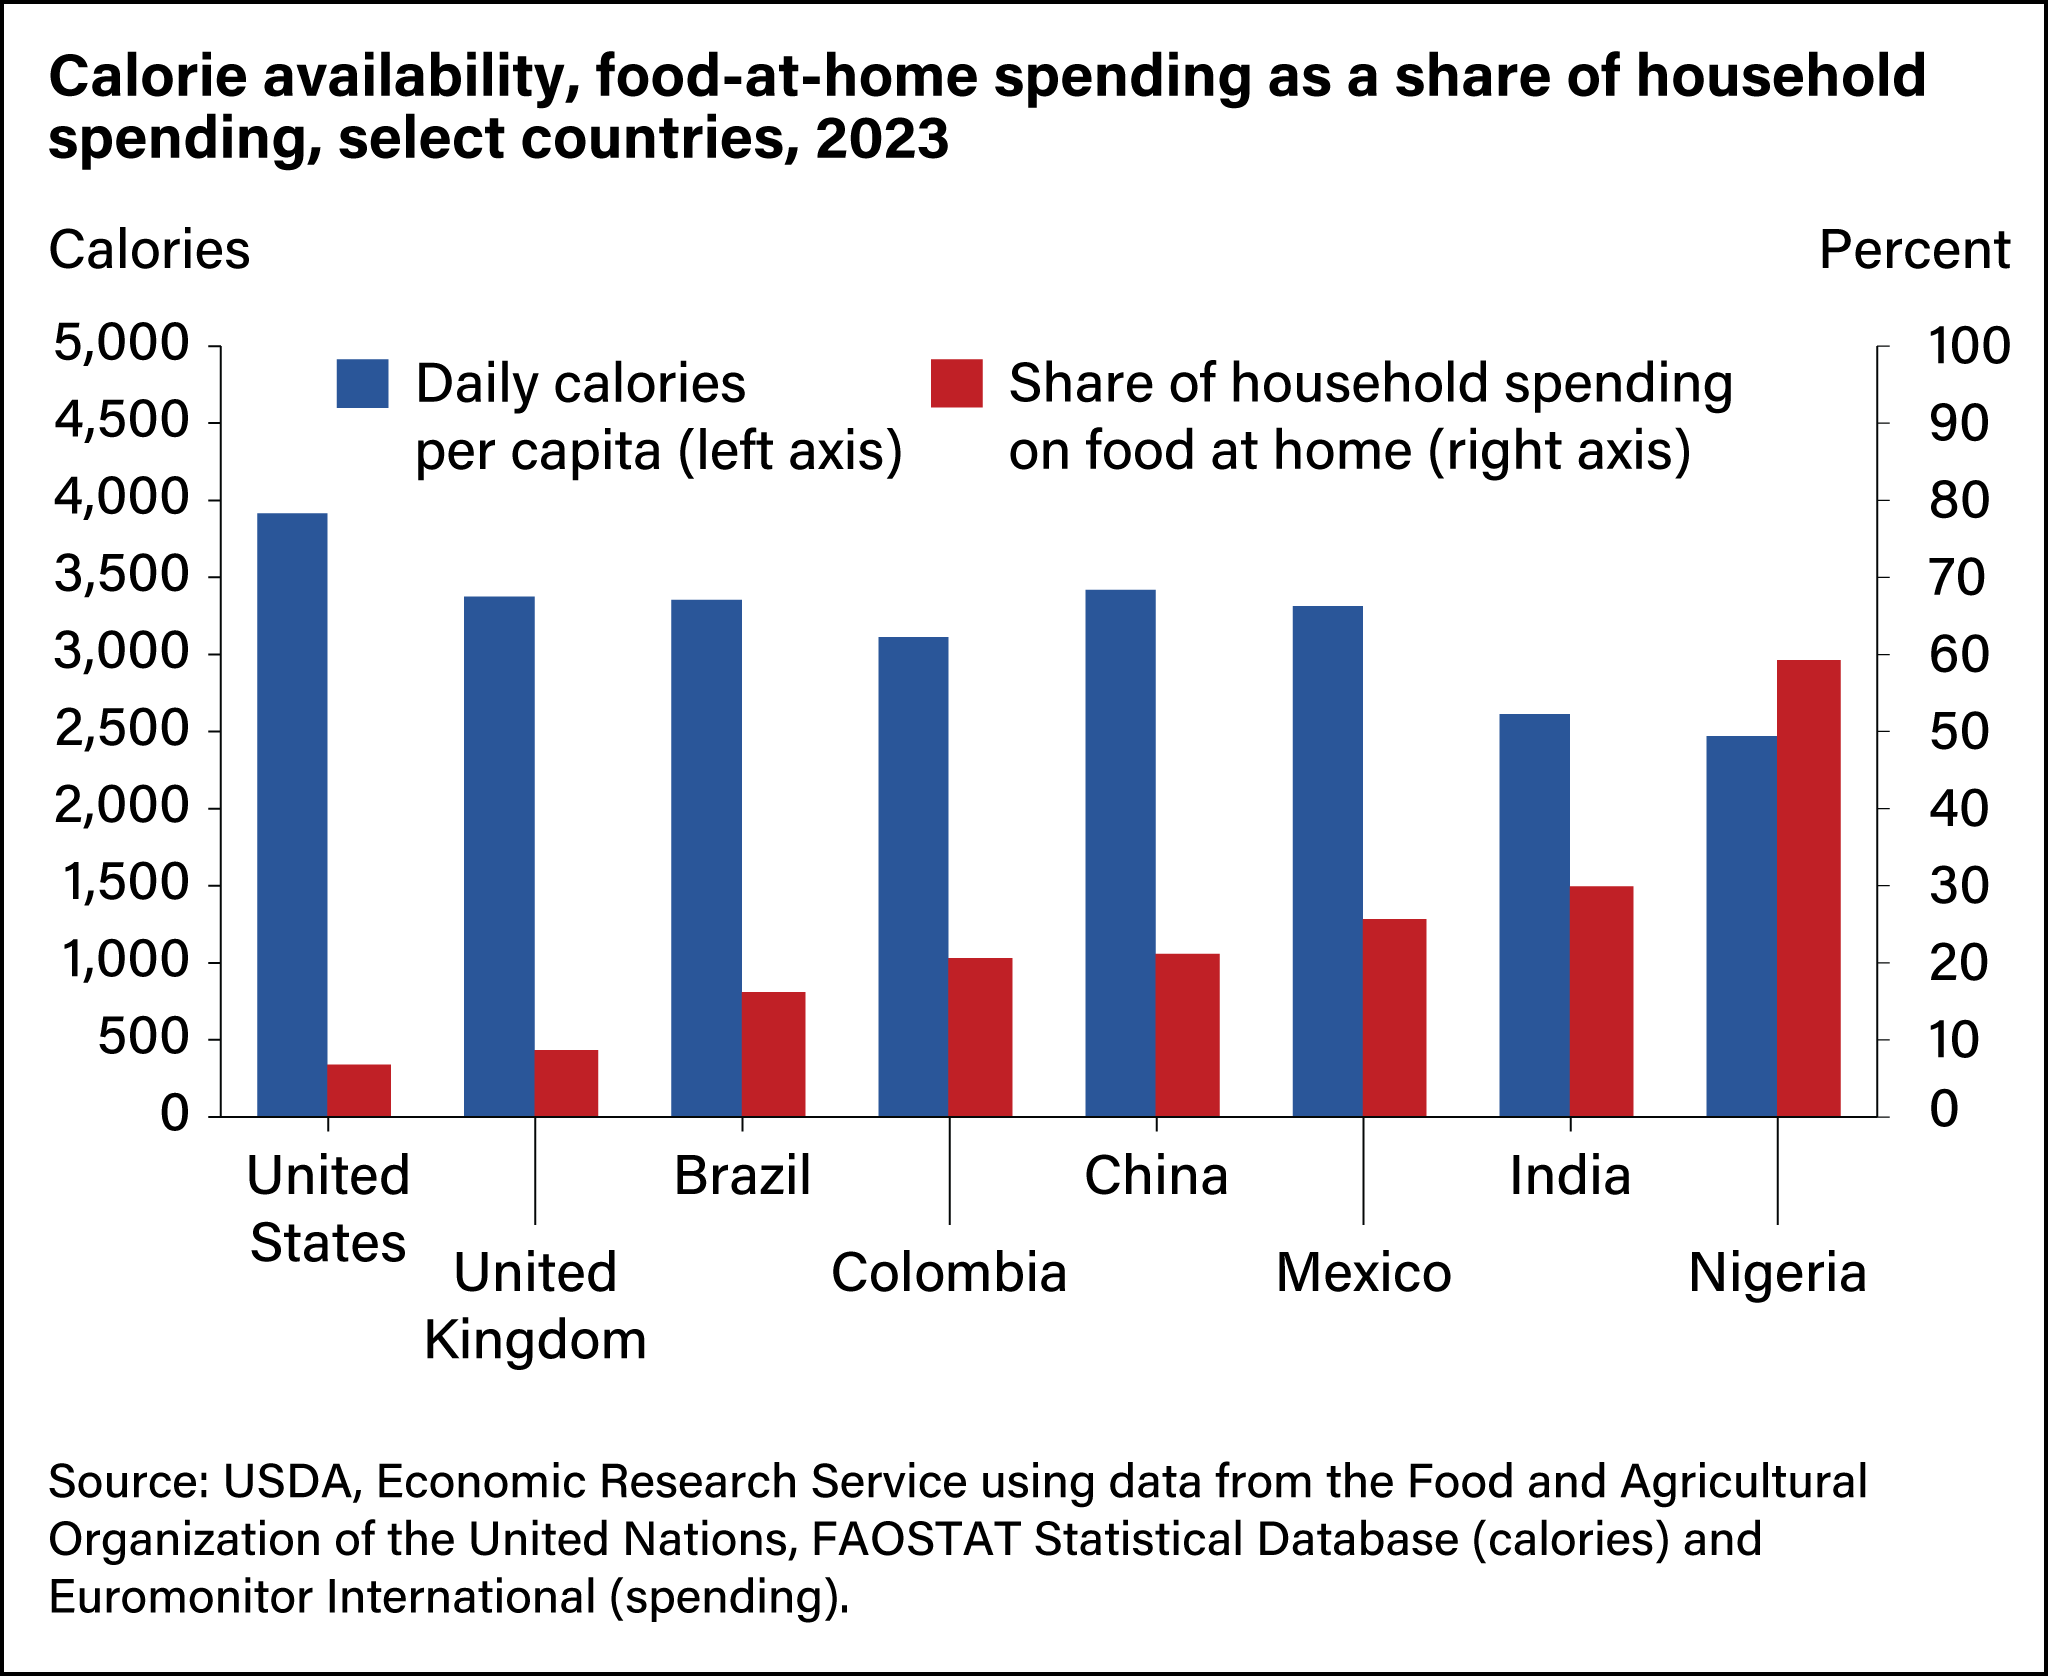
Globally, calorie availability and the prominence of food in household spending are inversely related
- by Constanza Valdes
- 1/22/2025
Low-income countries allocate a greater portion of their per capita income to food. As countries become more affluent, more of their disposable income is allocated to other categories. In countries with higher incomes (such as the United States and the United Kingdom), the share of household spending devoted to food purchased for preparing and eating at home is relatively low—less than 10 percent. In lower-income countries (such as Nigeria), at-home food spending can reach nearly 60 percent. Per capita calorie availability follows a reverse trend, with U.S. calorie availability averaging 3,914 calories per person per day in 2023, compared with Nigeria’s at 2,469 calories per person per day.


We’d welcome your feedback!
Would you be willing to answer a few quick questions about your experience?