ERS’s Food Availability data measure annual supplies of several hundred raw and semi-processed food commodities moving through the U.S. marketing system, providing per capita estimates of the types and amounts of food available to U.S. consumers over time and identifying shifts in eating patterns and food demand. A second data series covering 1970 onward—the Loss-Adjusted Food Availability data—adjusts for losses from the farmgate to the fork, including damaged products, spoilage, plate waste, and other losses to more closely approximate per capita consumption.
Food Availability and Consumption
- Updated: 1/8/2025
- Contact: Andrzej Blazejczyk or Linda Kantor
-
U.S. diets are out of balance with Federal recommendations
- by Linda Kantor and Andrzej Blazejczyk
- 4/20/2021
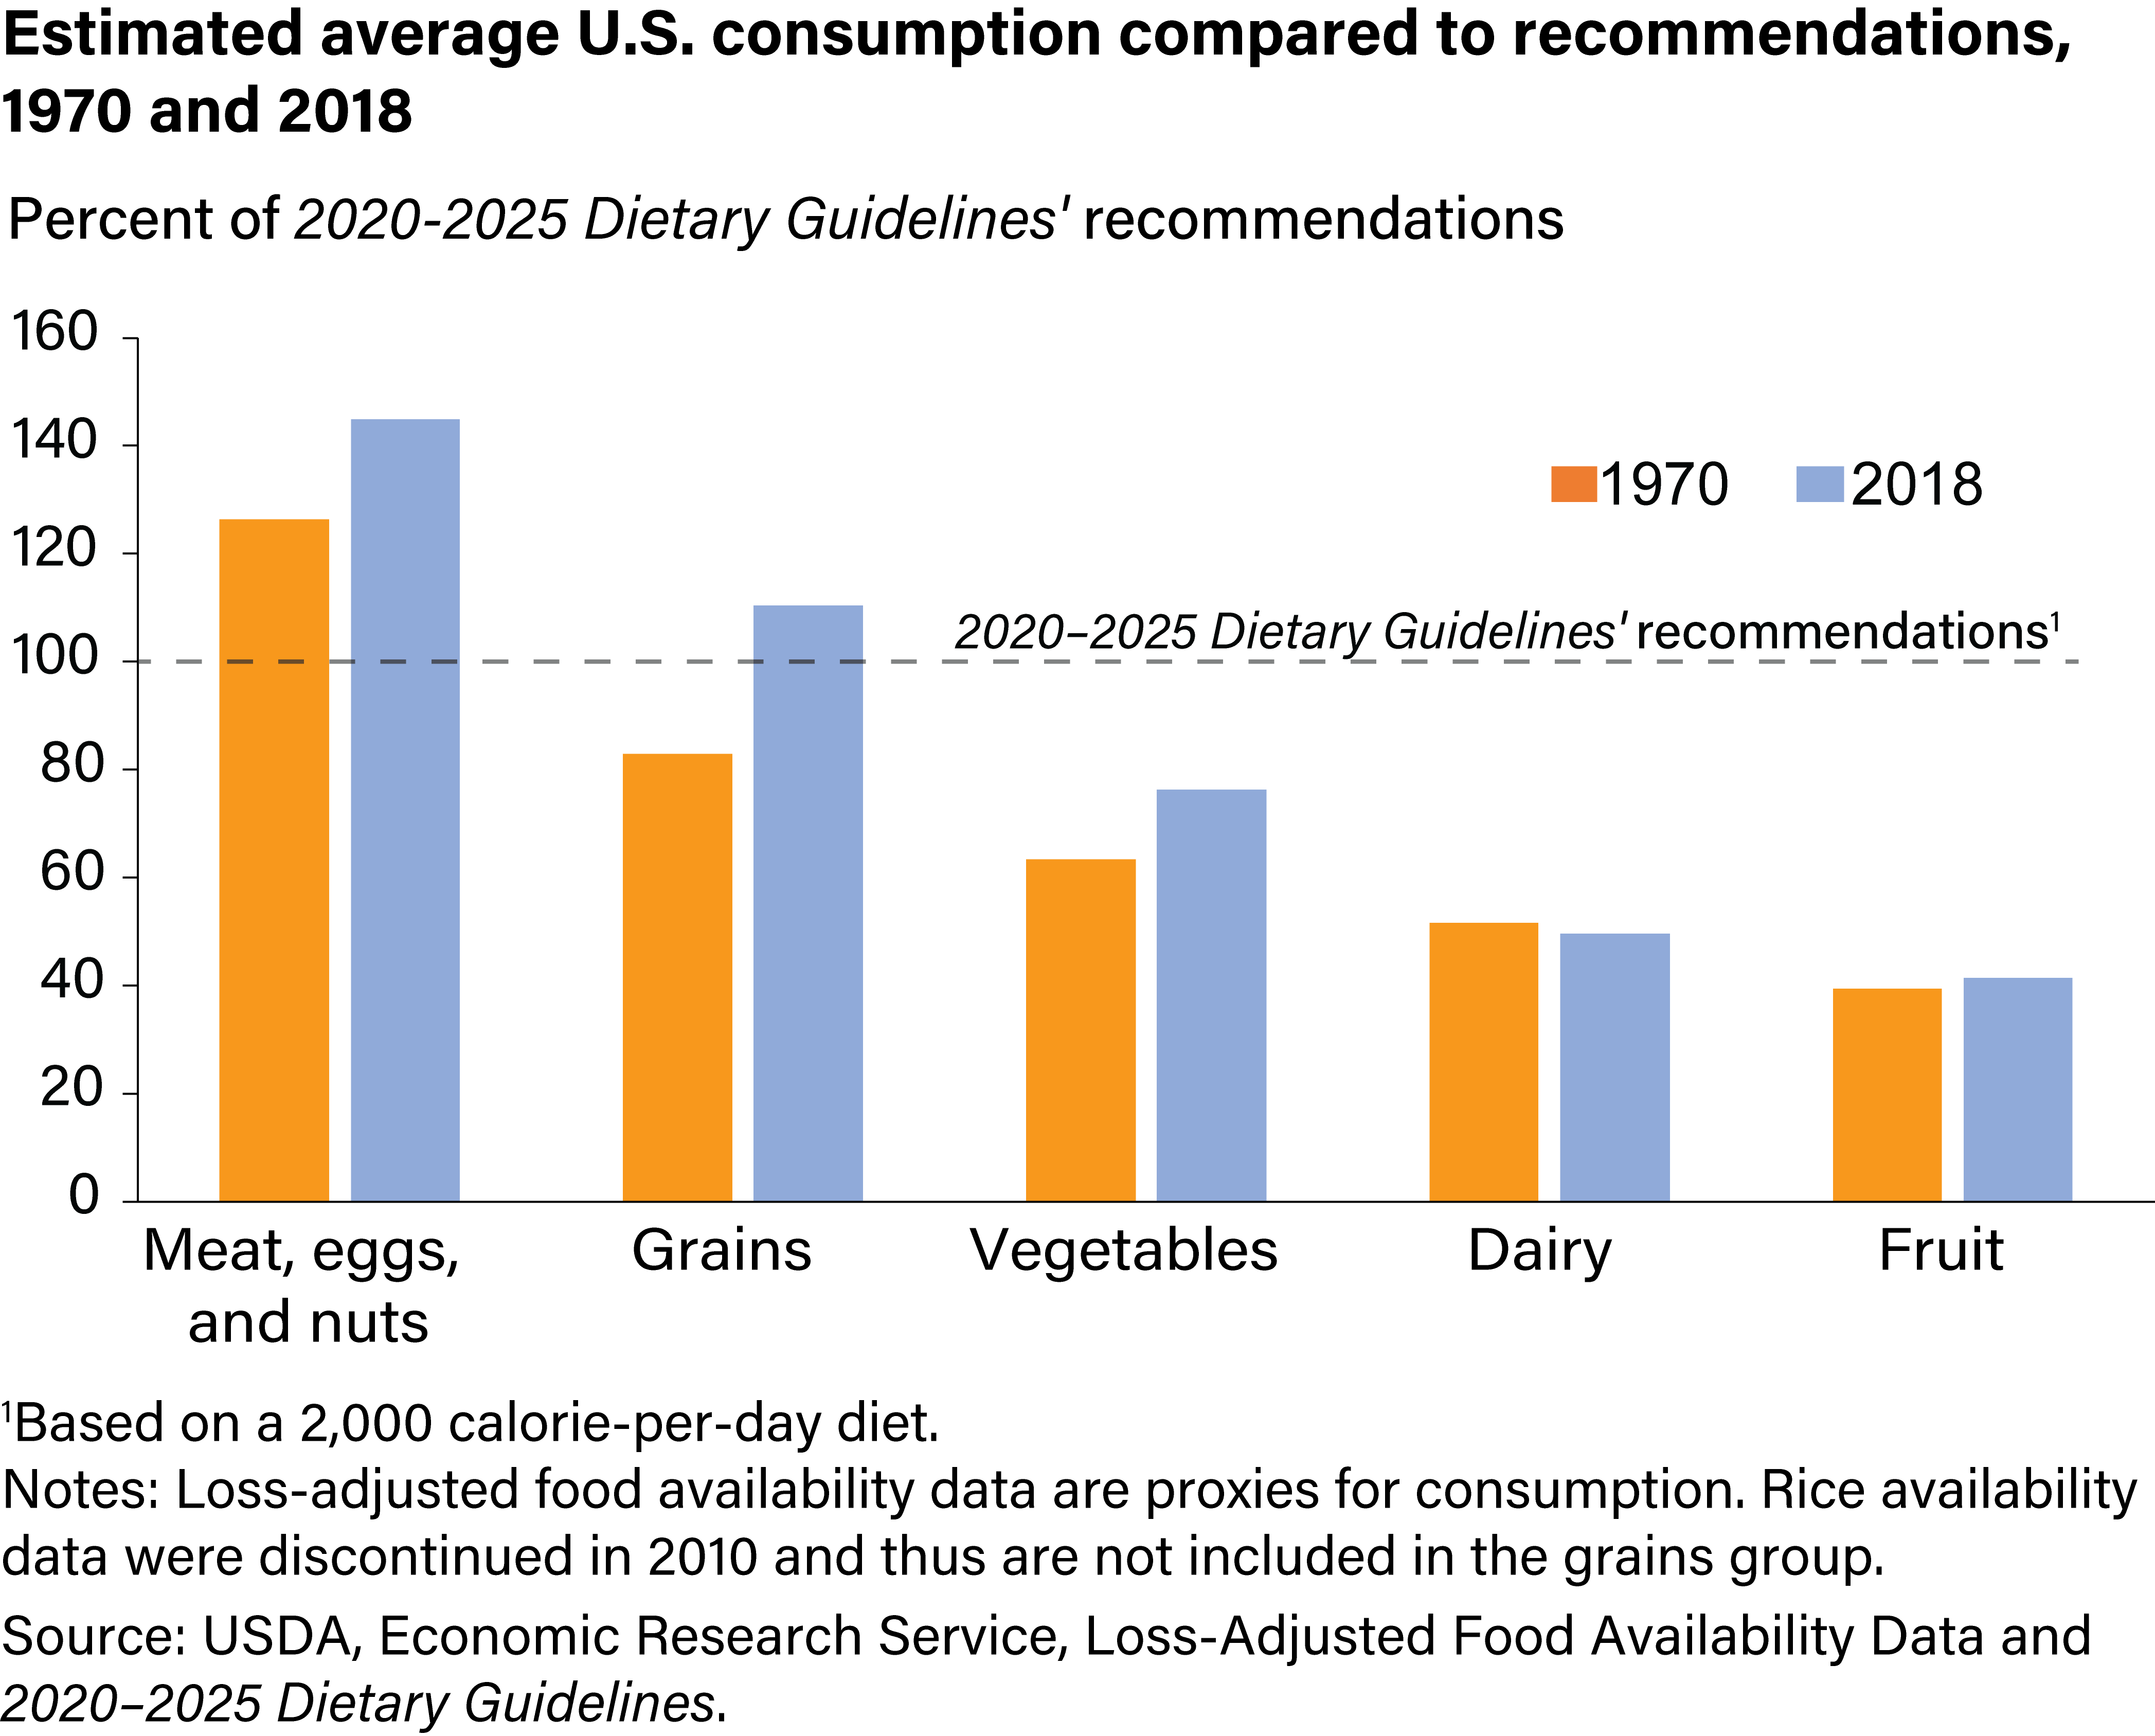
While people in the United States are consuming more vegetables and fruit than in 1970, the average U.S. diet still falls short of the recommendations in the 2020–2025 Dietary Guidelines for Americans for these major food groups. On average, 2018 consumption of meat, eggs, and nuts as well as grains in the United States was higher than the recommended amounts. -
Per capita availability of chicken higher than that of beef since 2010
- by Linda Kantor and Andrzej Blazejczyk
- 12/1/2022
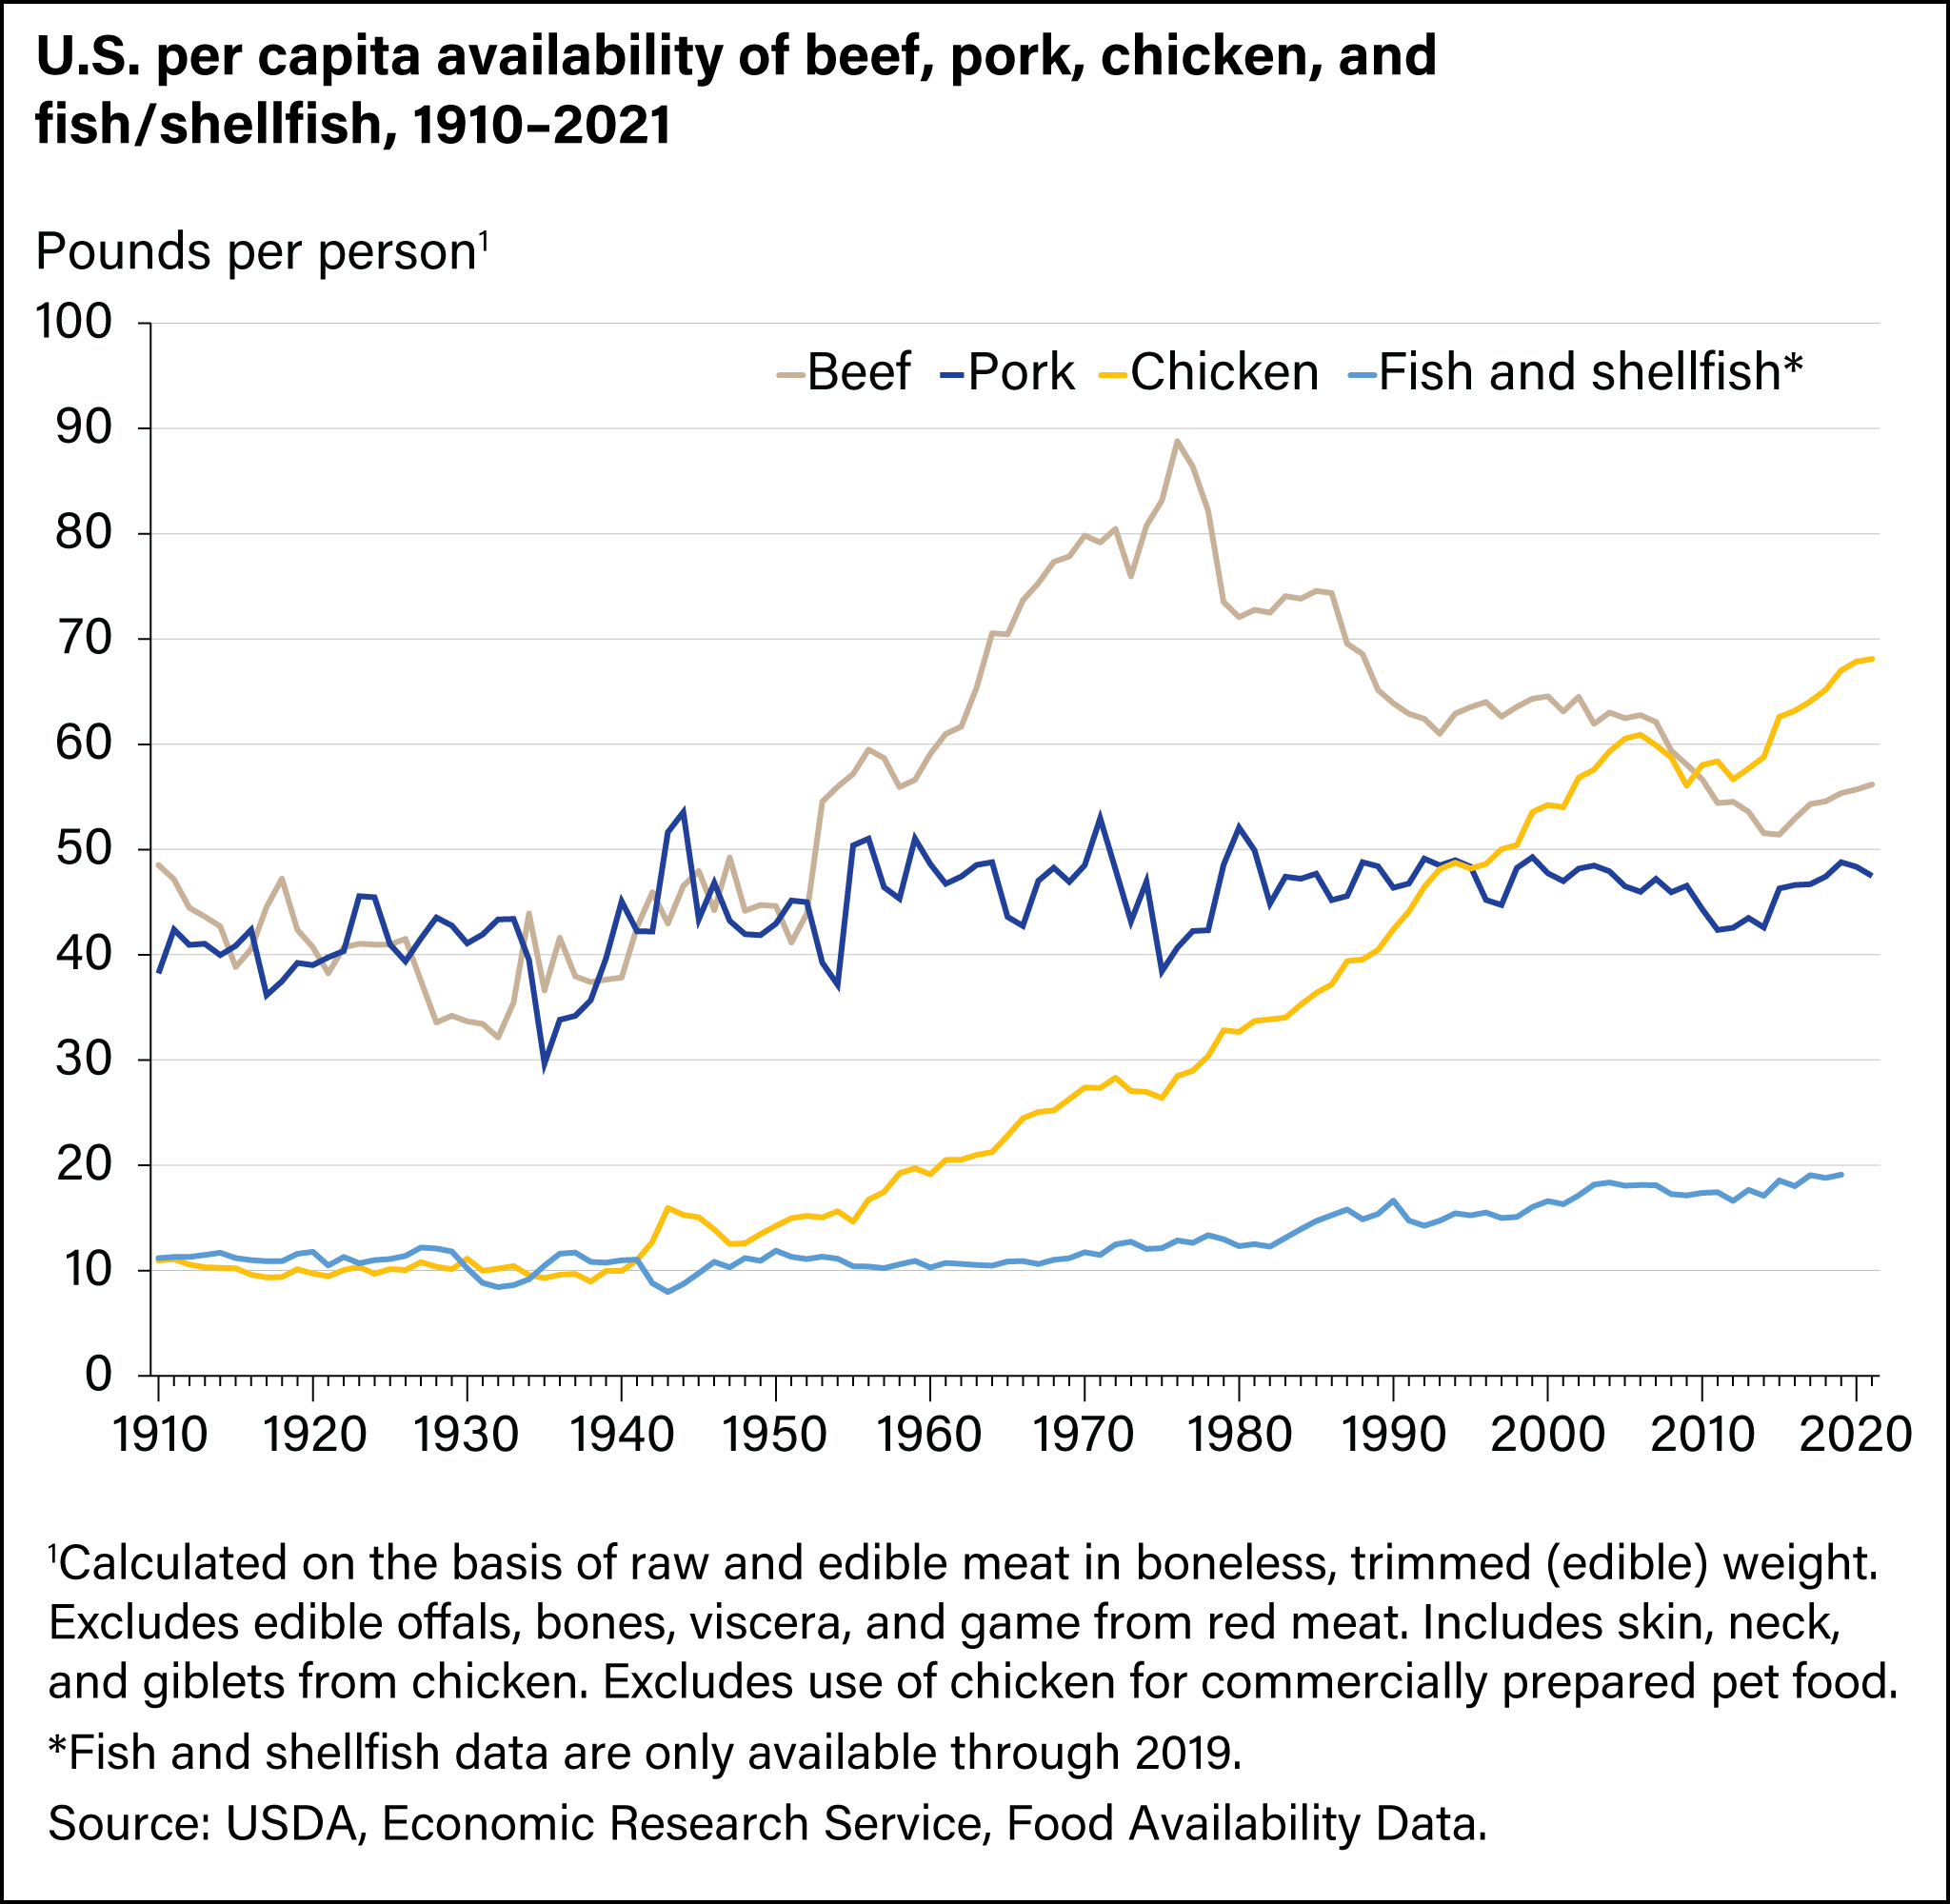
In 2021, 68.1 pounds of chicken per person were available for human consumption in the United States (on a boneless, edible basis), compared to 56.2 pounds of beef. The availability of chicken began its upward climb in the 1940s, overtaking pork availability in 1996 and surpassing beef in 2010 to become the meat most available for U.S. consumption. Since 1980, U.S. chicken availability per person has more than doubled. In 2021, 47.5 pounds of pork per person were available for consumption. -
Per capita availability of corn products grew from 1972 to 2022
- by Linda Kantor and Andrzej Blazejczyk
- 9/9/2024
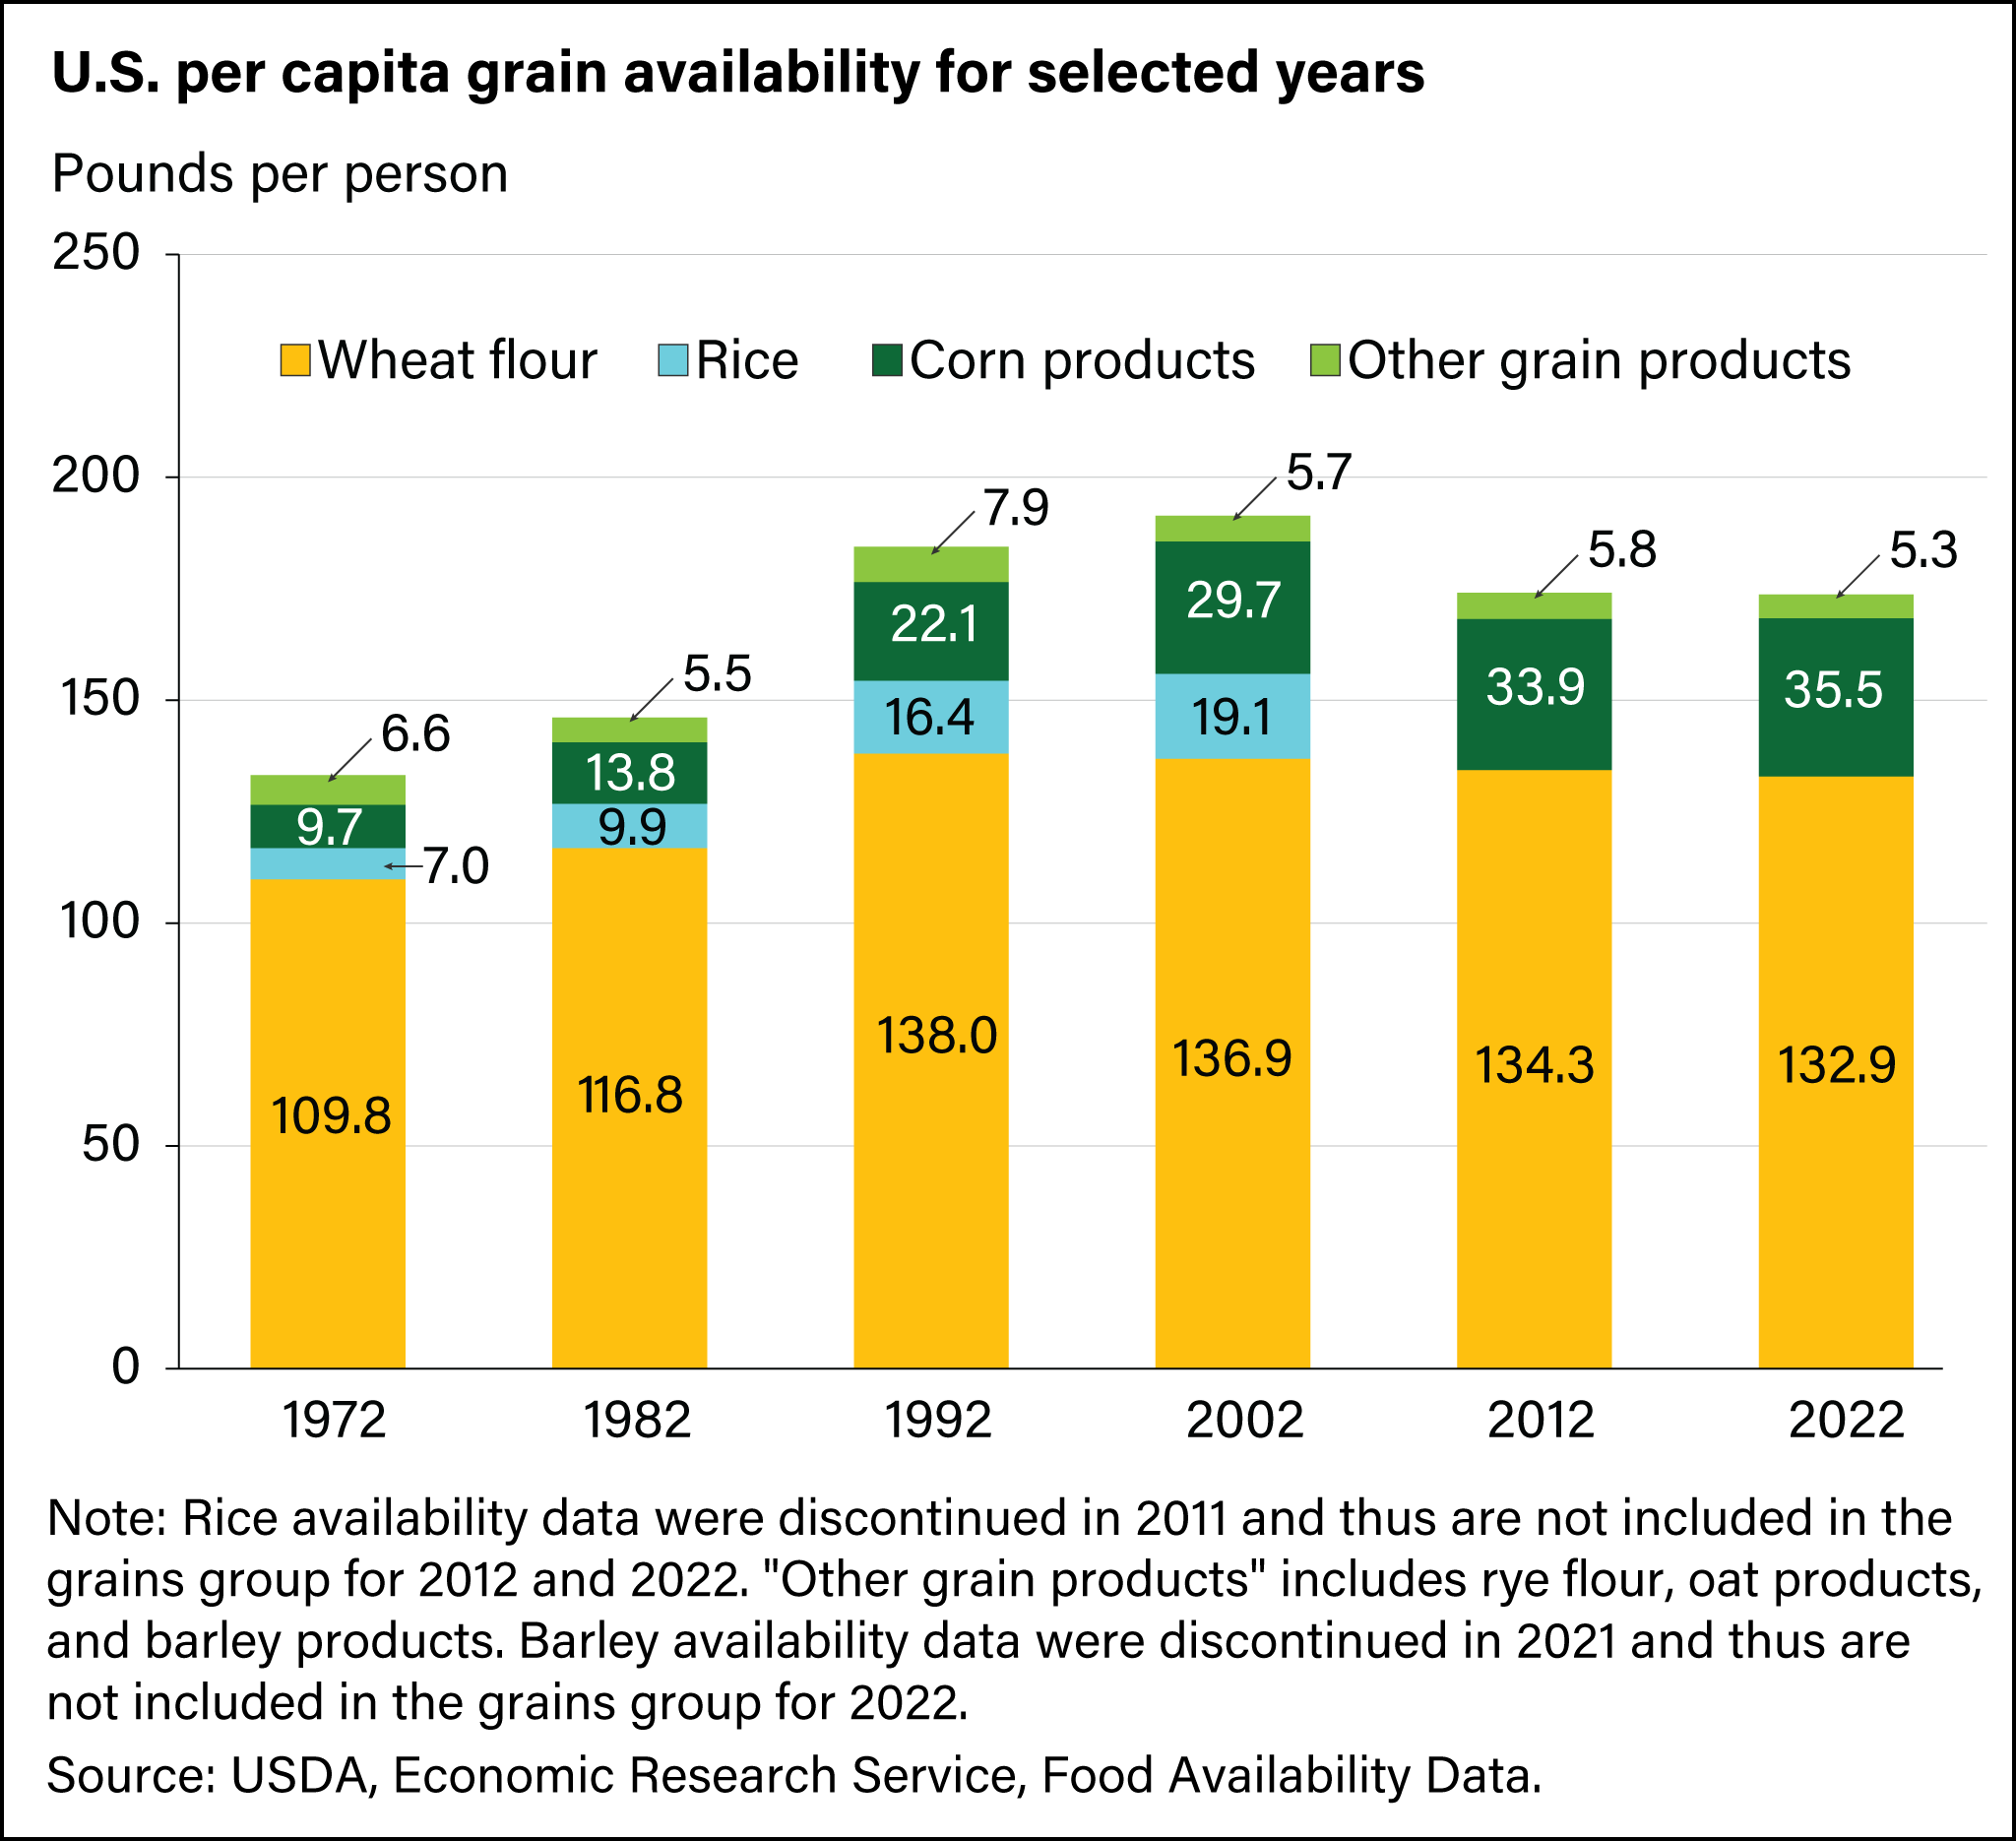
In 2022, 35.5 pounds per person of corn products (flour and meal, hominy and grits, and food starch) were available for consumption in the United States, increasing steadily over the last five decades, according to ERS’s food availability data. Wheat flour availability was 132.9 pounds per person in 2022—higher than availability levels in the 1970s and 1980s but below its peak of 146.8 pounds in 1997. -
Corn sweeteners availability declined over the last two decades
- by Andrzej Blazejczyk and Linda Kantor
- 11/18/2024
In 2023, 123.5 pounds per person of caloric sweeteners were available for consumption by U.S. consumers, down from a high of 153.6 pounds in 1999. Availability of total corn sweeteners (high-fructose corn syrup, glucose syrup, and dextrose) fell from 85.7 pounds per person in 1999 to 53.0 pounds in 2023. Meanwhile, refined sugar (cane and beet) availability per person surpassed corn sweeteners in 2011, reaching 68.4 pounds per person in 2023. -
Cheese now accounts for largest share of dairy cup-equivalents in U.S. diets
- by Andrzej Blazejczyk and Linda Kantor
- 12/28/2022
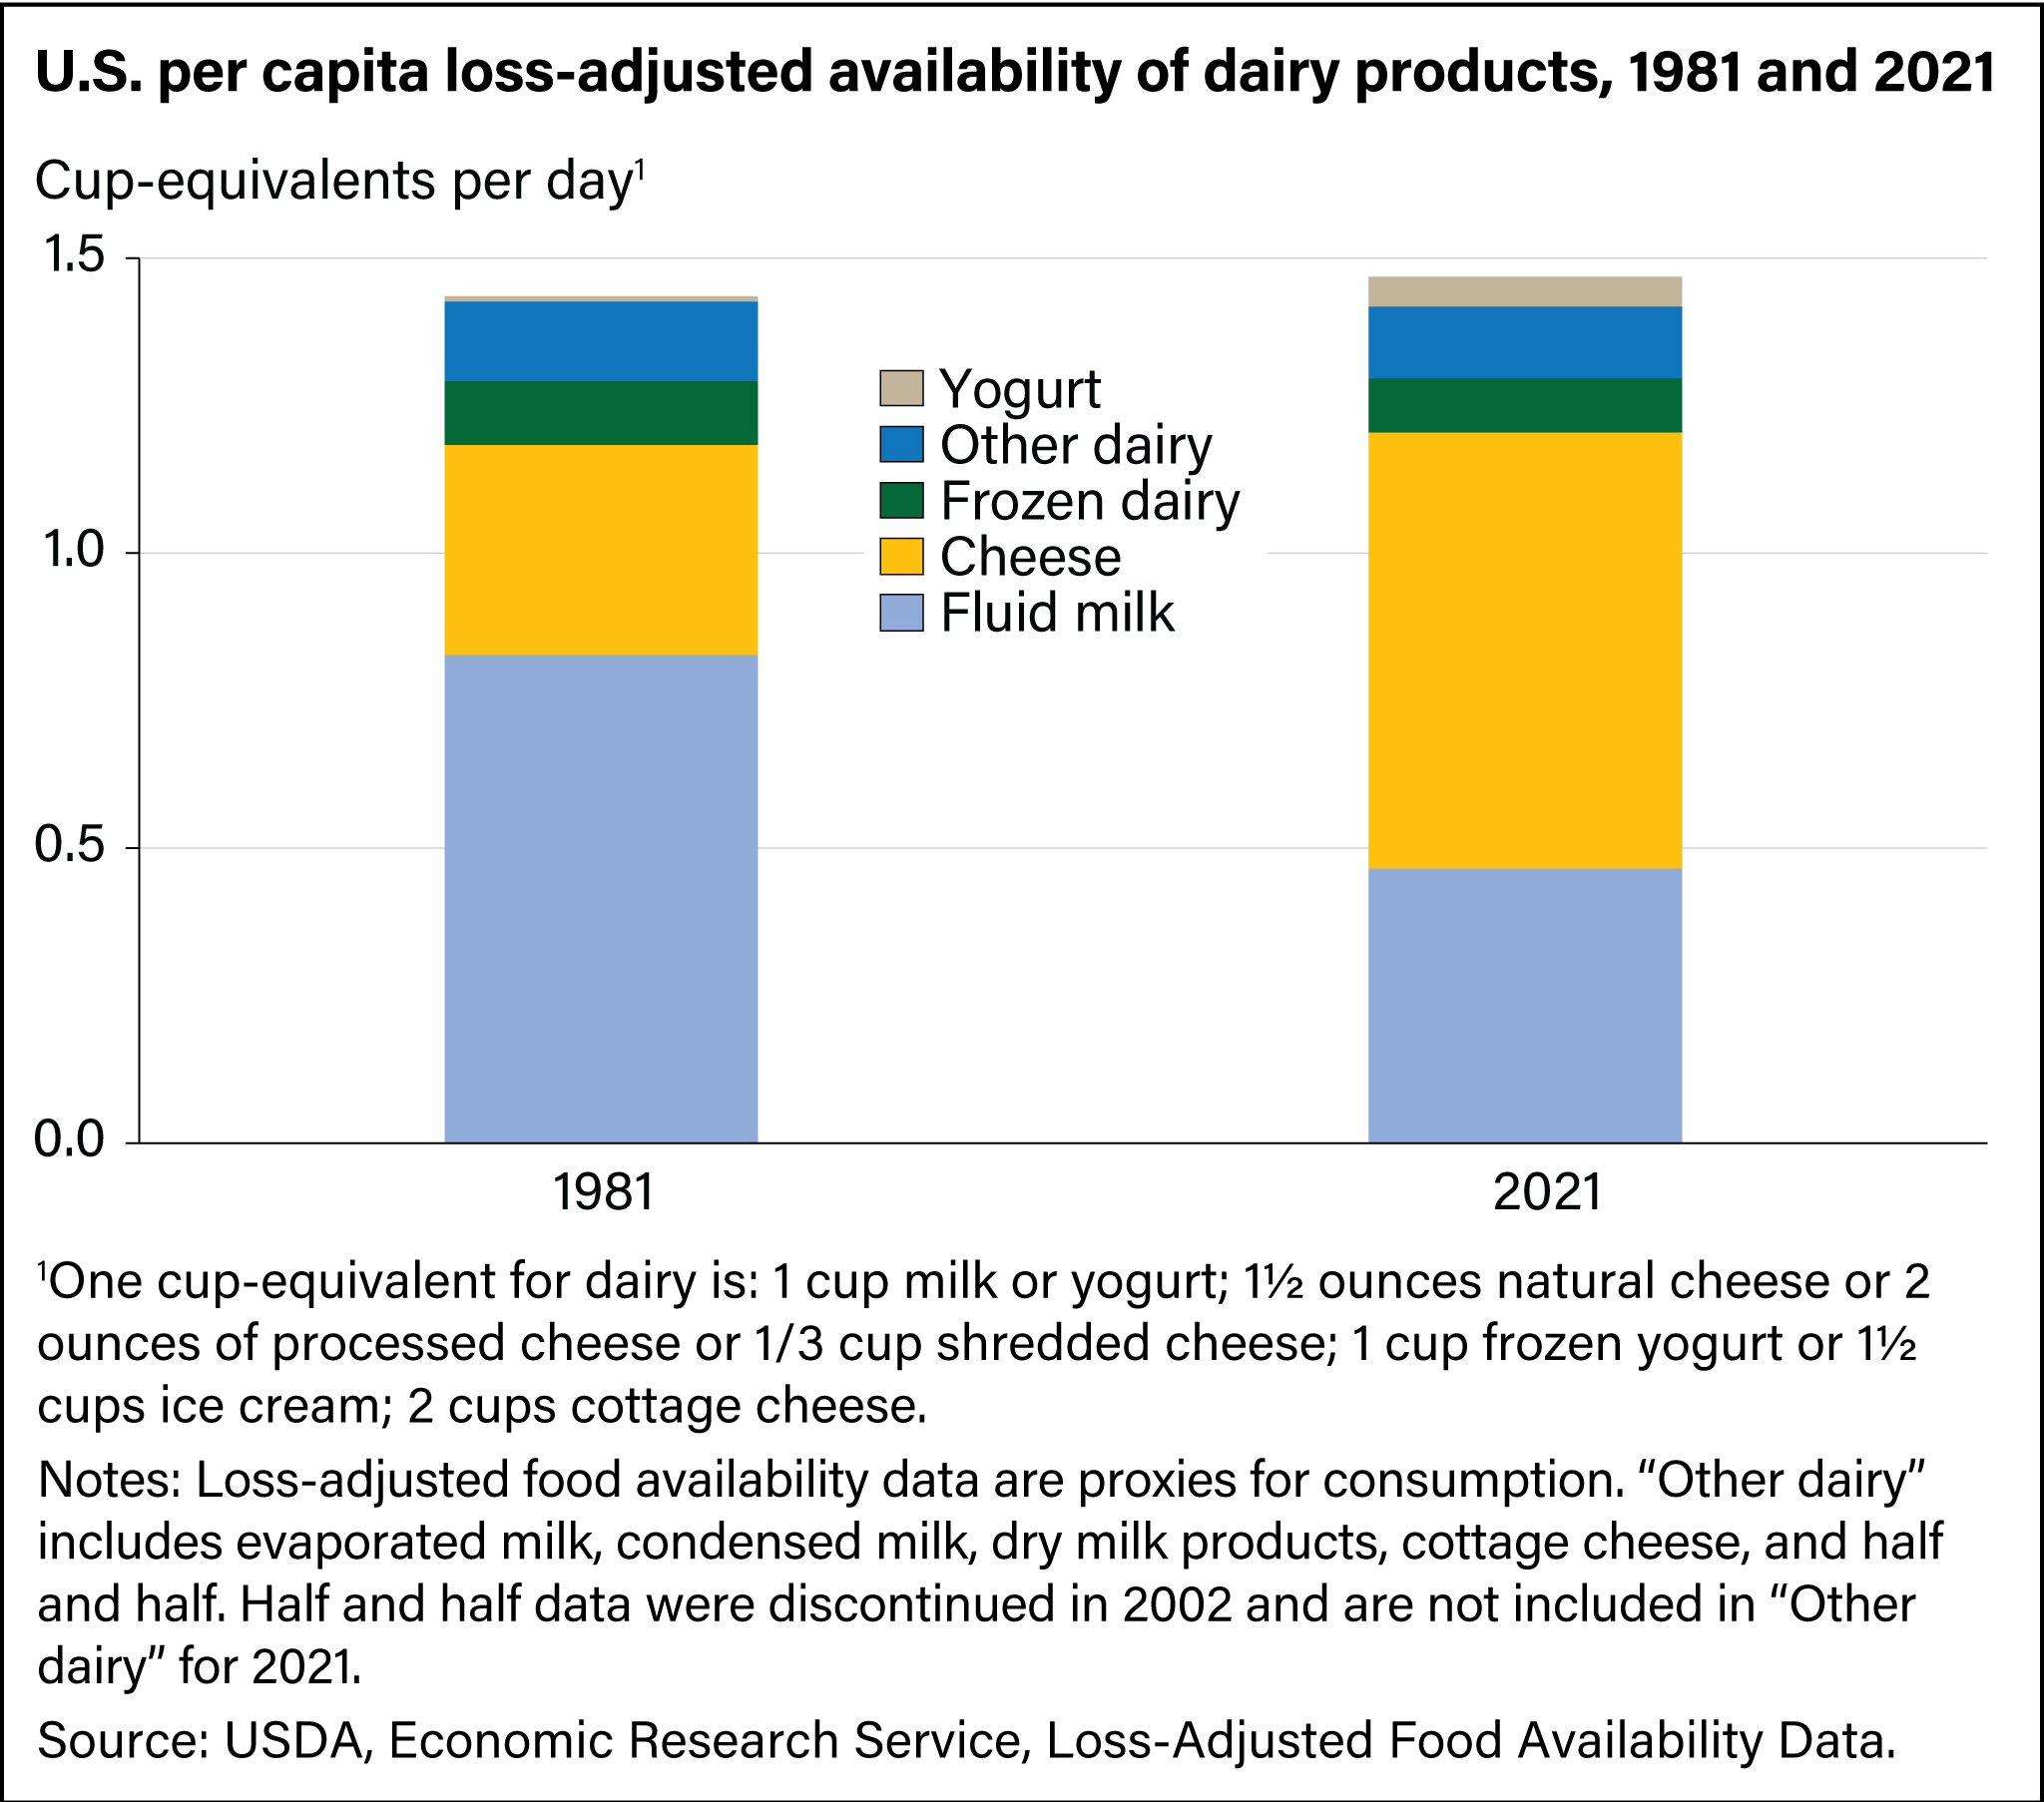
Dairy products available for consumption after adjusting for losses totaled 1.5 cup-equivalents per person per day in 2021—half the recommended amount for a 2,000-calorie-per-day diet based on the 2020–2025 Dietary Guidelines for Americans. While overall quantity is slightly higher when comparing 2021 with 1981, the mix has changed. Loss-adjusted availability of fluid milk has fallen from 0.8 to 0.5 cup per person per day, whereas loss-adjusted cheese availability has doubled and yogurt availability has grown steadily. -
U.S. vegetable availability decreased in 2022 compared with 2021
- by Linda Kantor and Andrzej Blazejczyk
- 9/9/2024
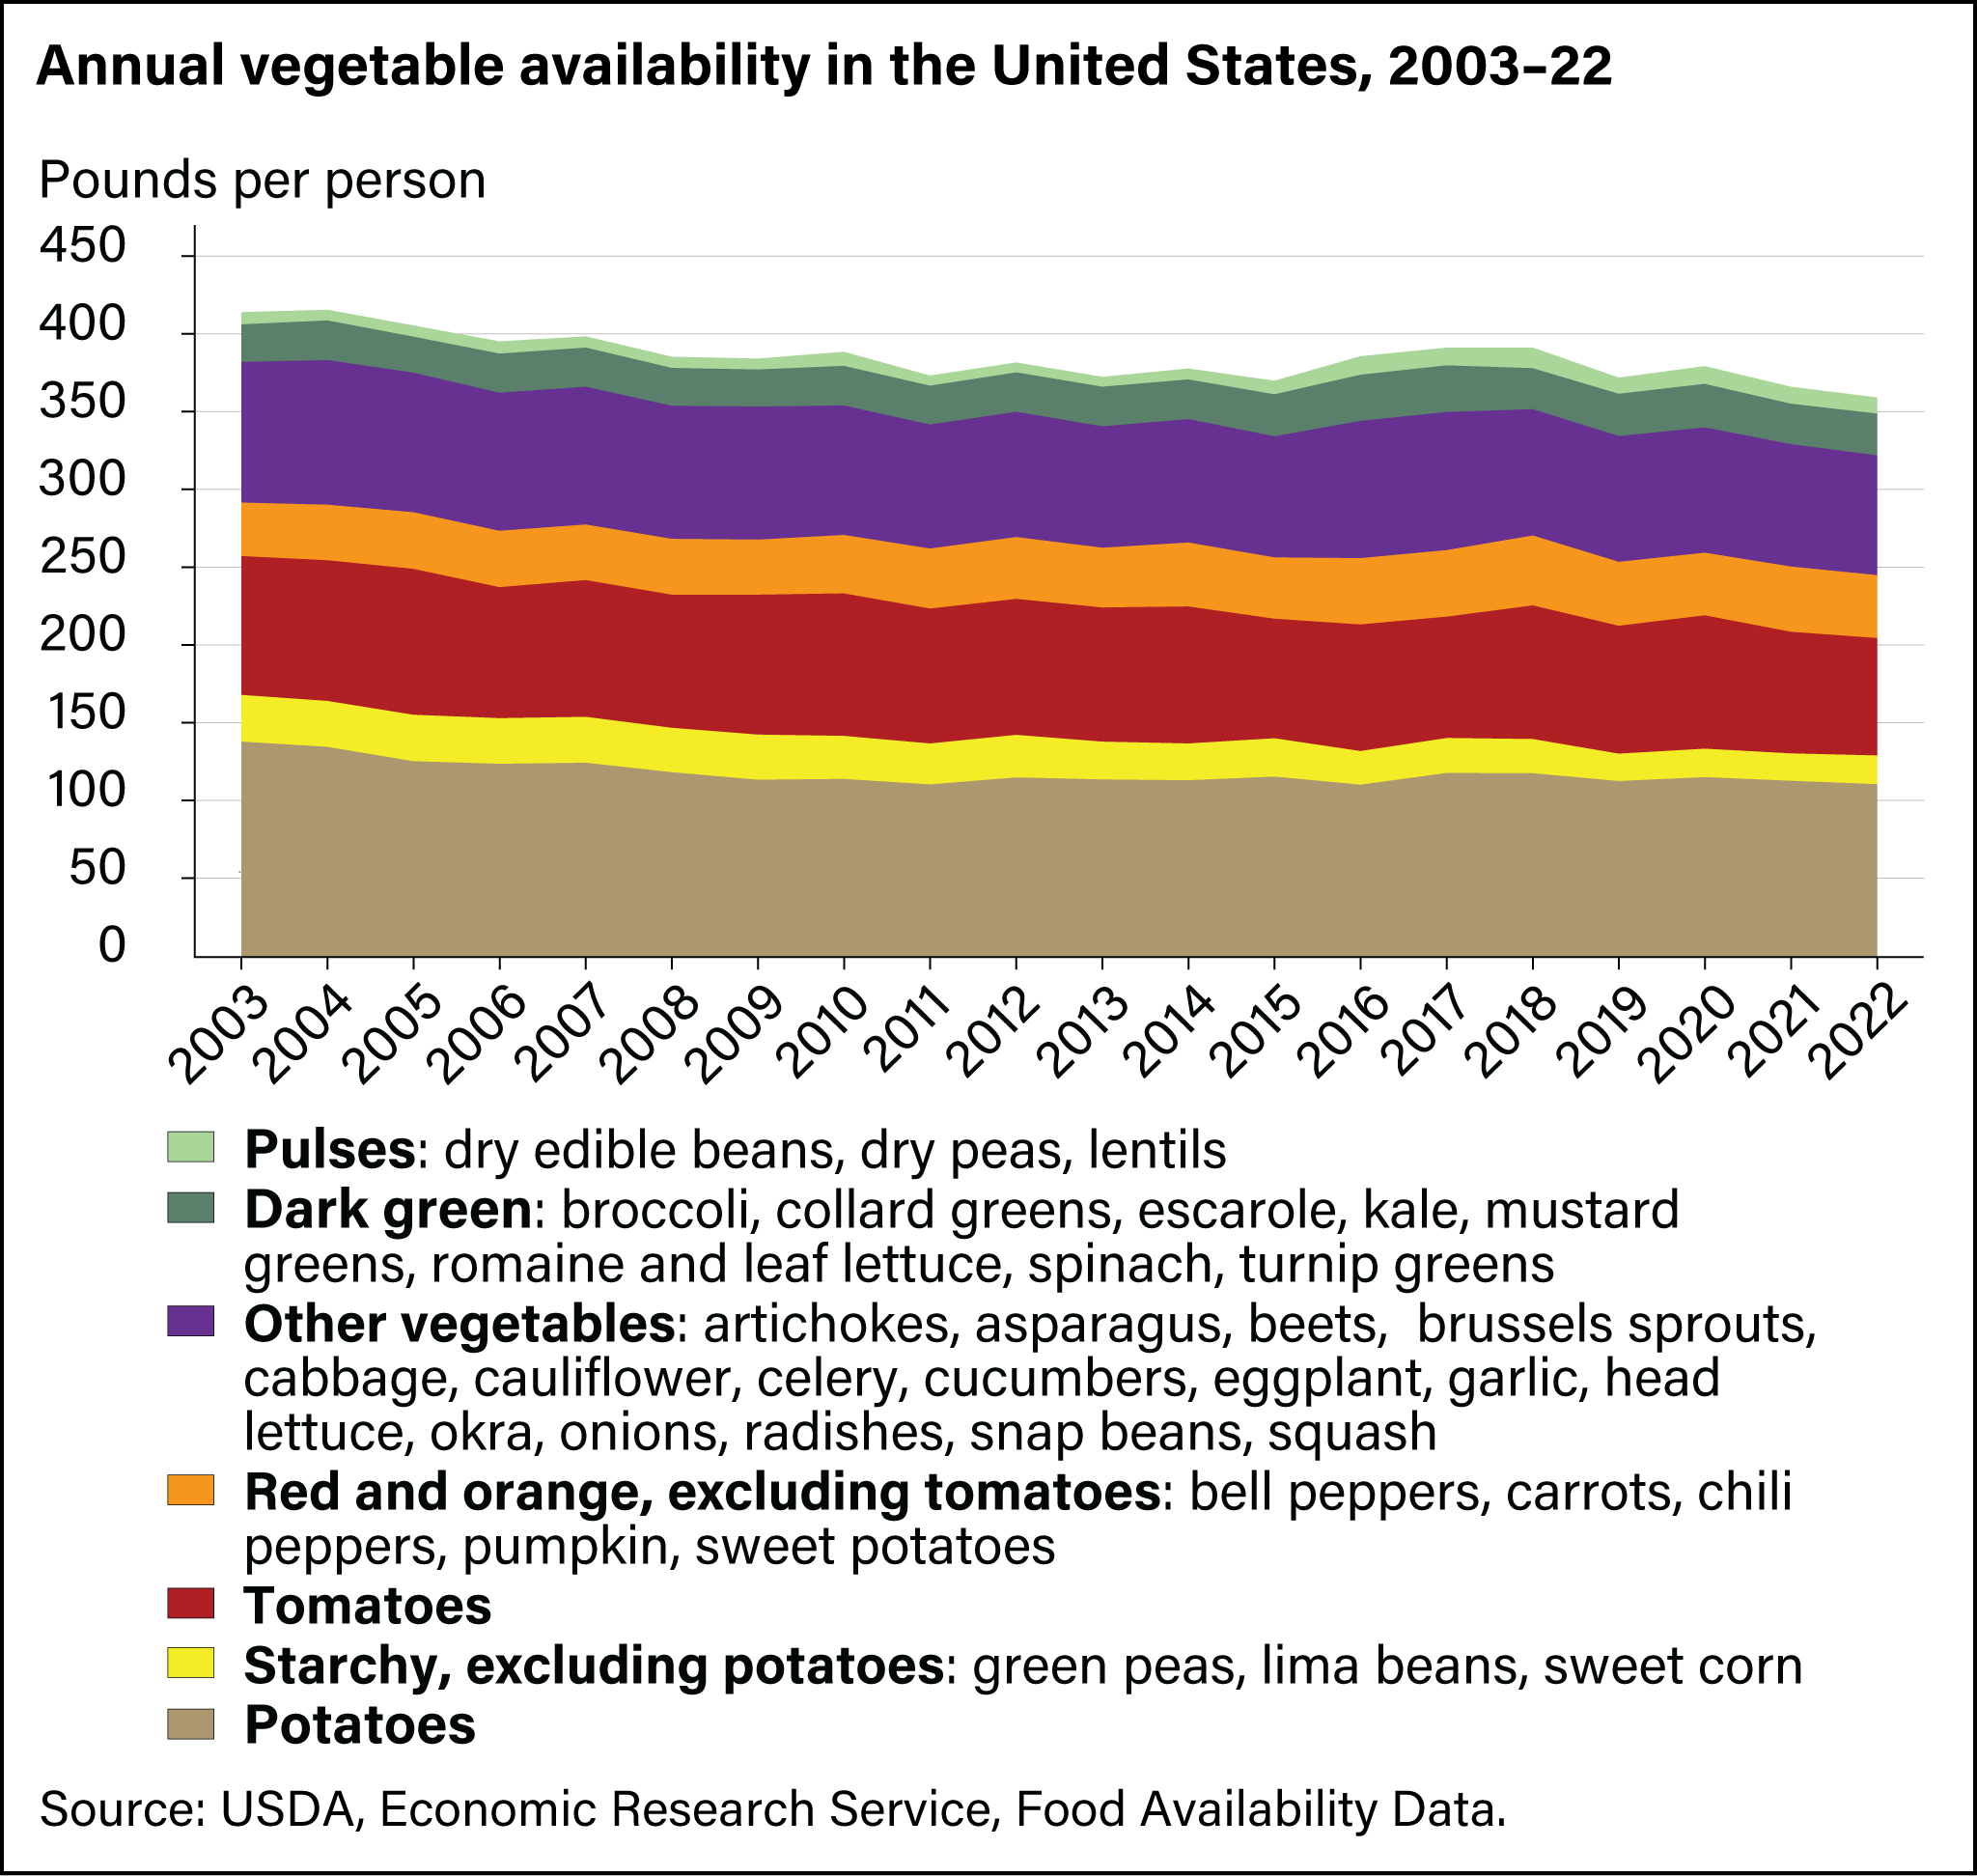
The total amount of vegetables available for consumption in the United States was 359.1 pounds per capita in 2022—down from 365.9 pounds in 2021. This decline is consistent with the overall downward trend in vegetable availability observed over the past two decades, and well below this period’s high of 415.4 pounds per capita in 2004. The vegetables food group includes five subgroups: pulses, other vegetables, dark green, red and orange (including tomatoes), and starchy (including potatoes). Potatoes and tomatoes were consistently the vegetables with the highest per capita availability over the 20-year period. -
Potatoes and tomatoes are the most commonly consumed vegetables
- by Linda Kantor and Andrzej Blazejczyk
- 12/16/2020
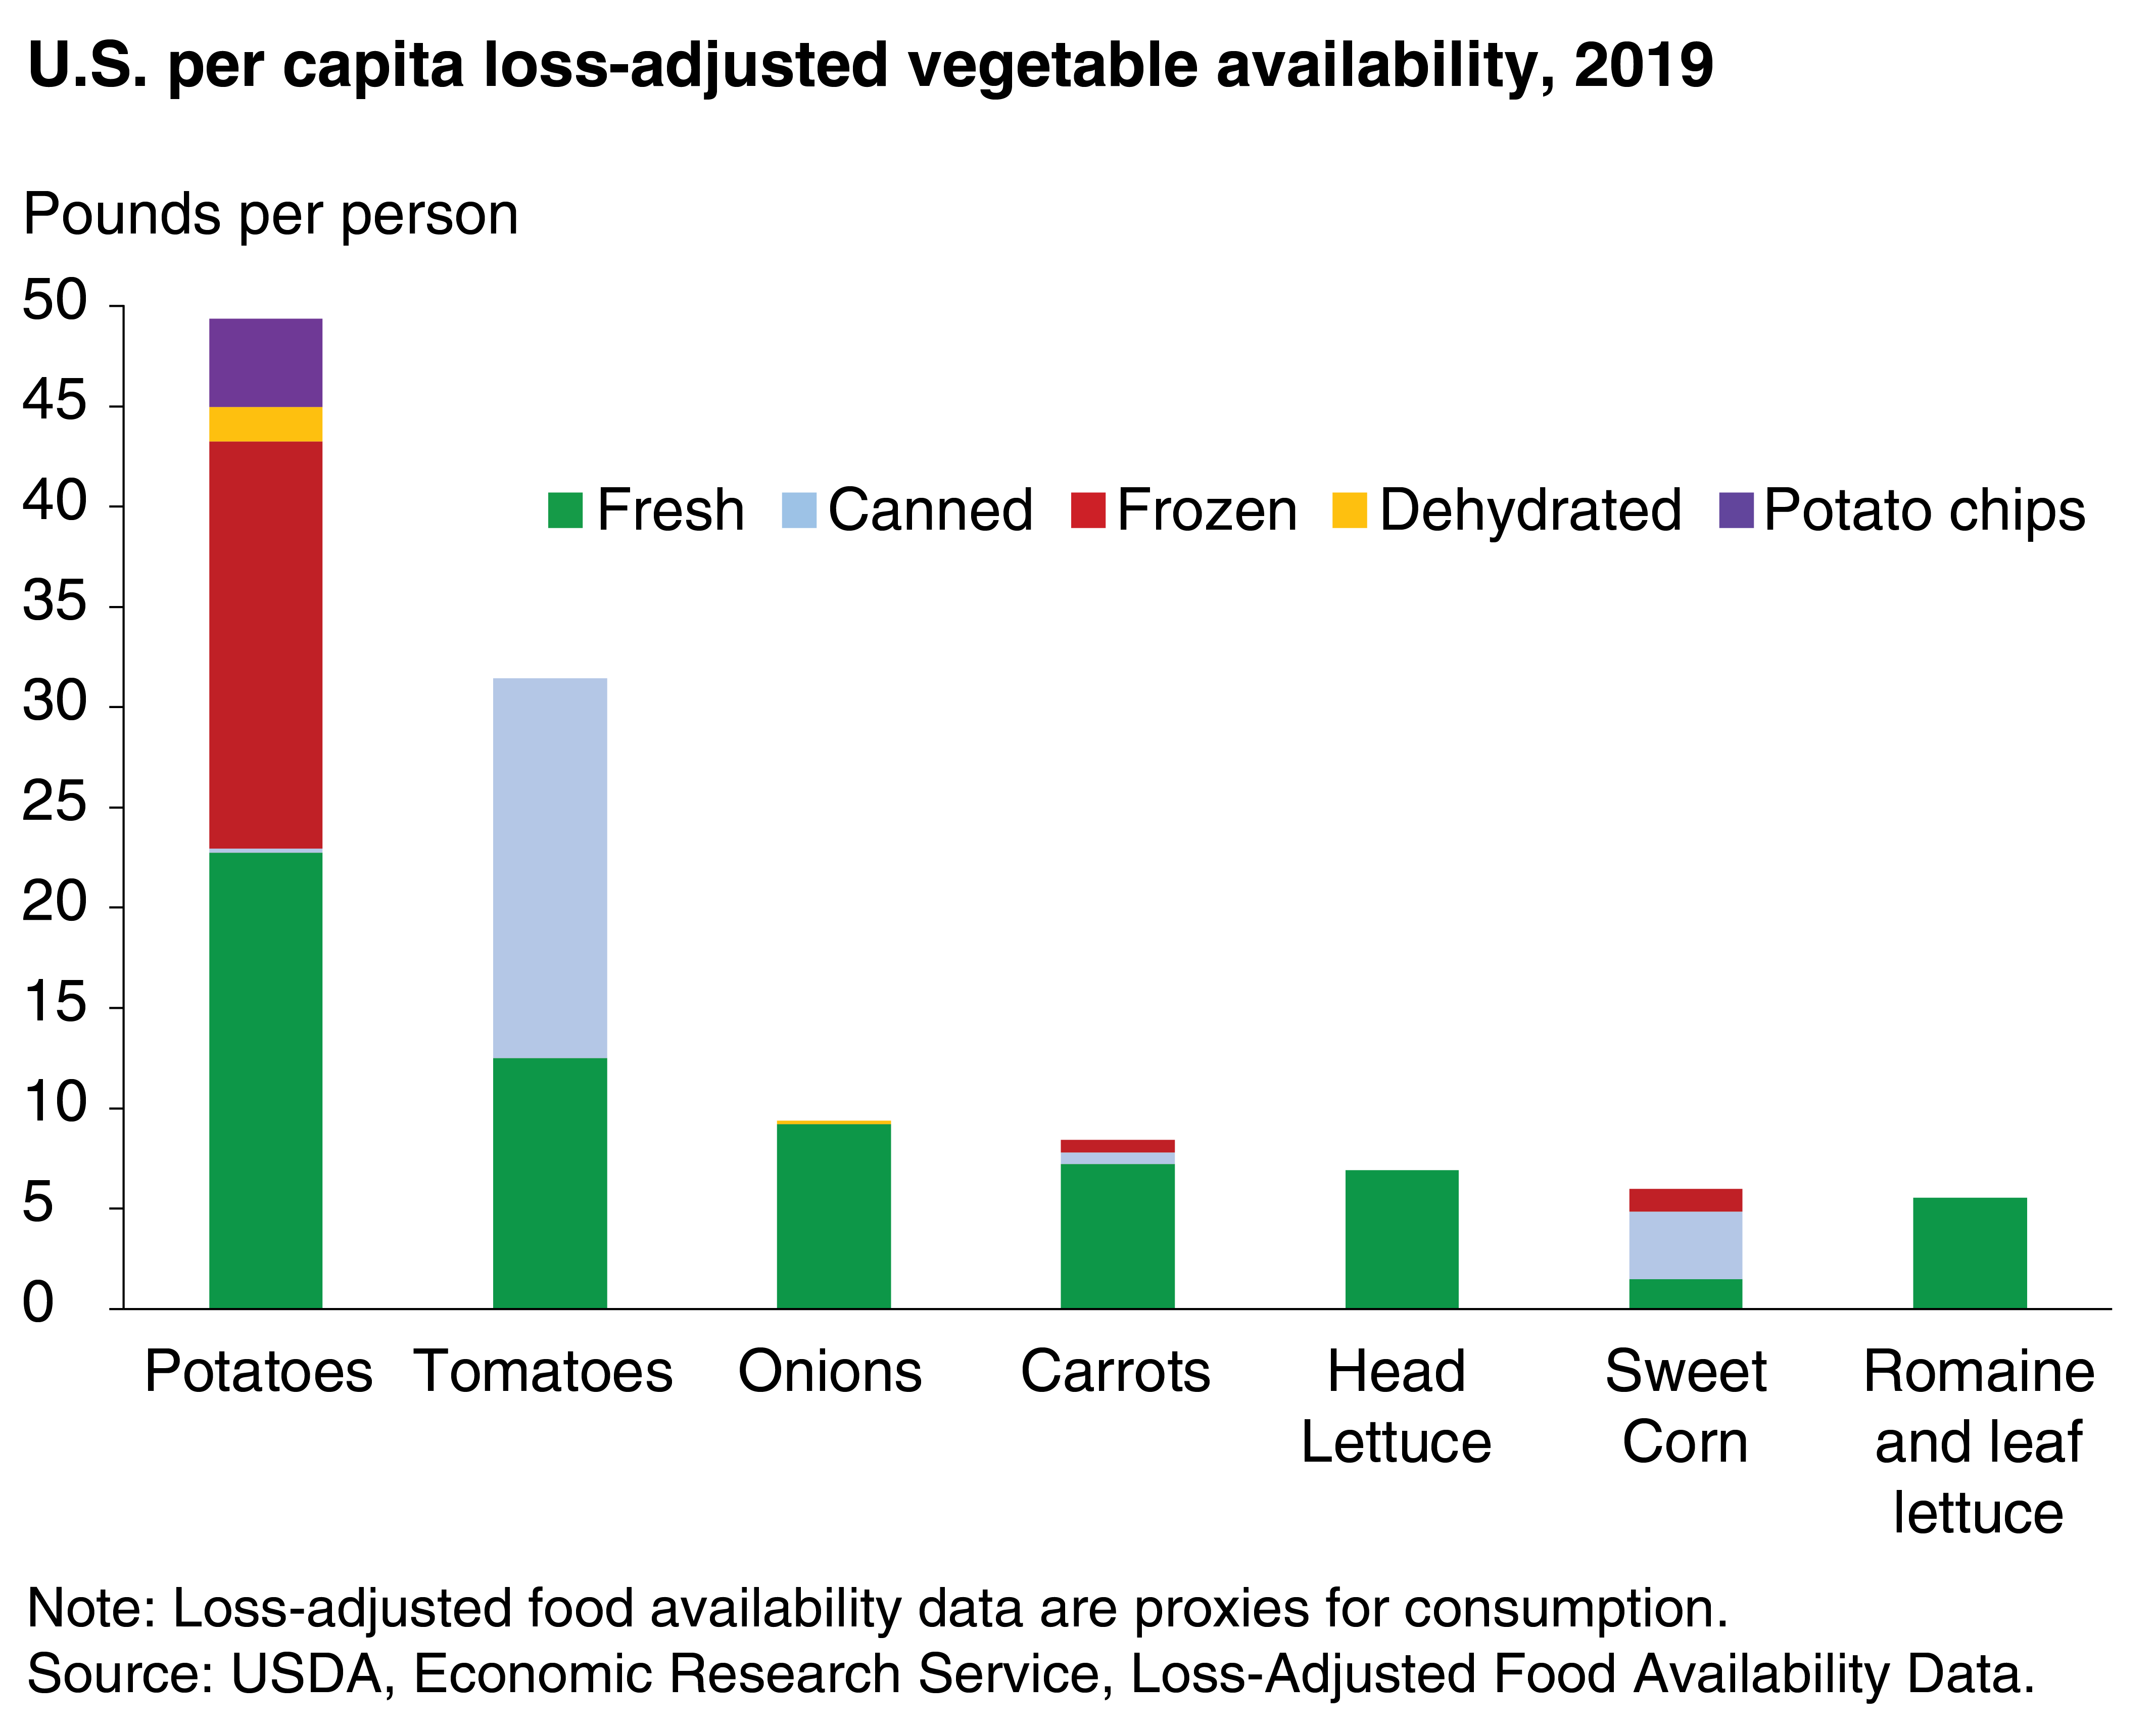
In 2019, 49.4 pounds of potatoes per person and 31.4 pounds of tomatoes per person were available for consumption after adjusting for losses. Forty-one percent of loss-adjusted potato availability was frozen and 60 percent of loss-adjusted tomato availability was canned, as French fries and pizza sauce contribute to the high consumption of these two vegetables. The third highest vegetable—onions—came in at 9.4 pounds per person. -
Apples and oranges are the top U.S. fruit choices
- by Linda Kantor and Andrzej Blazejczyk
- 5/5/2023
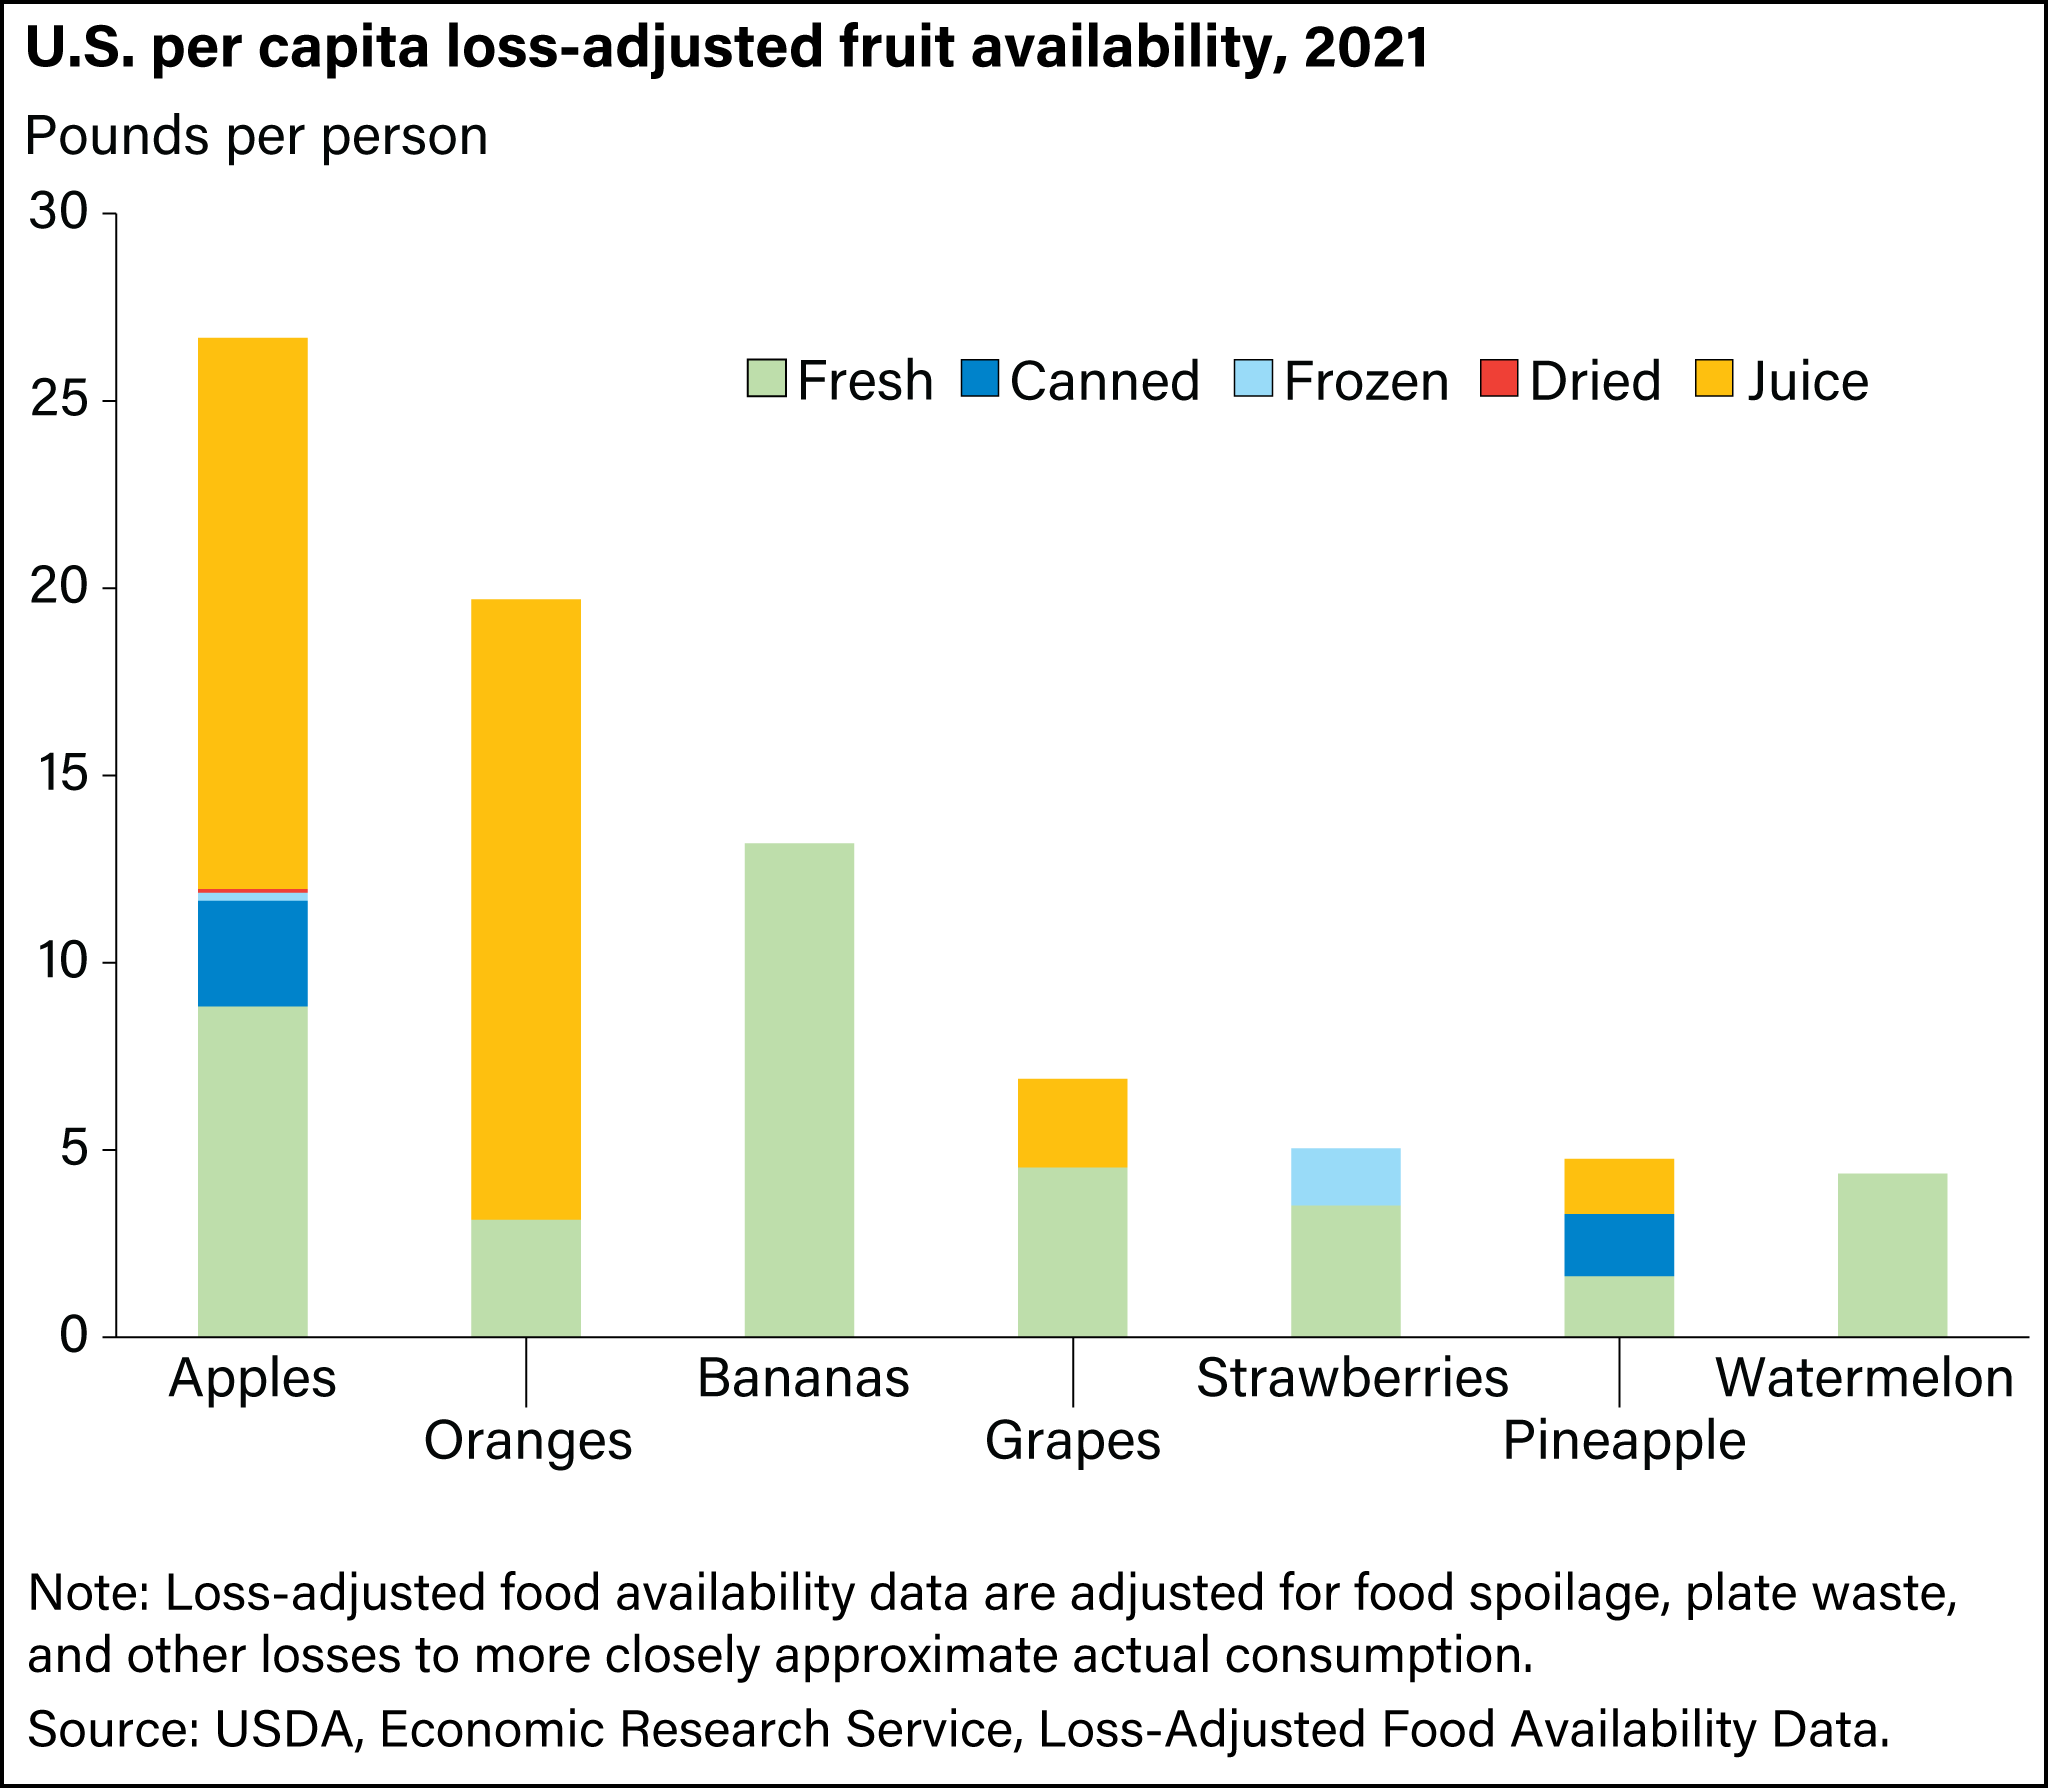
Apples held the top spot for total fruit available for consumption in 2021 with loss-adjusted apple juice availability at 14.7 pounds (1.7 gallons) per person; fresh apples at roughly 9 pounds per person; and canned, dried, and frozen apples totaling to 3.1 pounds per person. Bananas (13.2 pounds per person) topped the list of most popular fresh fruits, while orange juice (16.6 pounds or 1.9 gallons) remained the top fruit juice available for consumption in the United States.
We’d welcome your feedback!
Would you be willing to answer a few quick questions about your experience?


