Markets for major agricultural commodities are typically analyzed by looking at supply-and-use conditions and implications for prices. From an economic perspective, these factors determine the market equilibrium. In the U.S. agricultural sector, many interactions and relationships exist between and among different commodities. For example, corn production and prices affect feed costs in the livestock sector.
Agricultural Production and Prices
- Updated: 1/8/2025
- Contact: Sara Scott
-
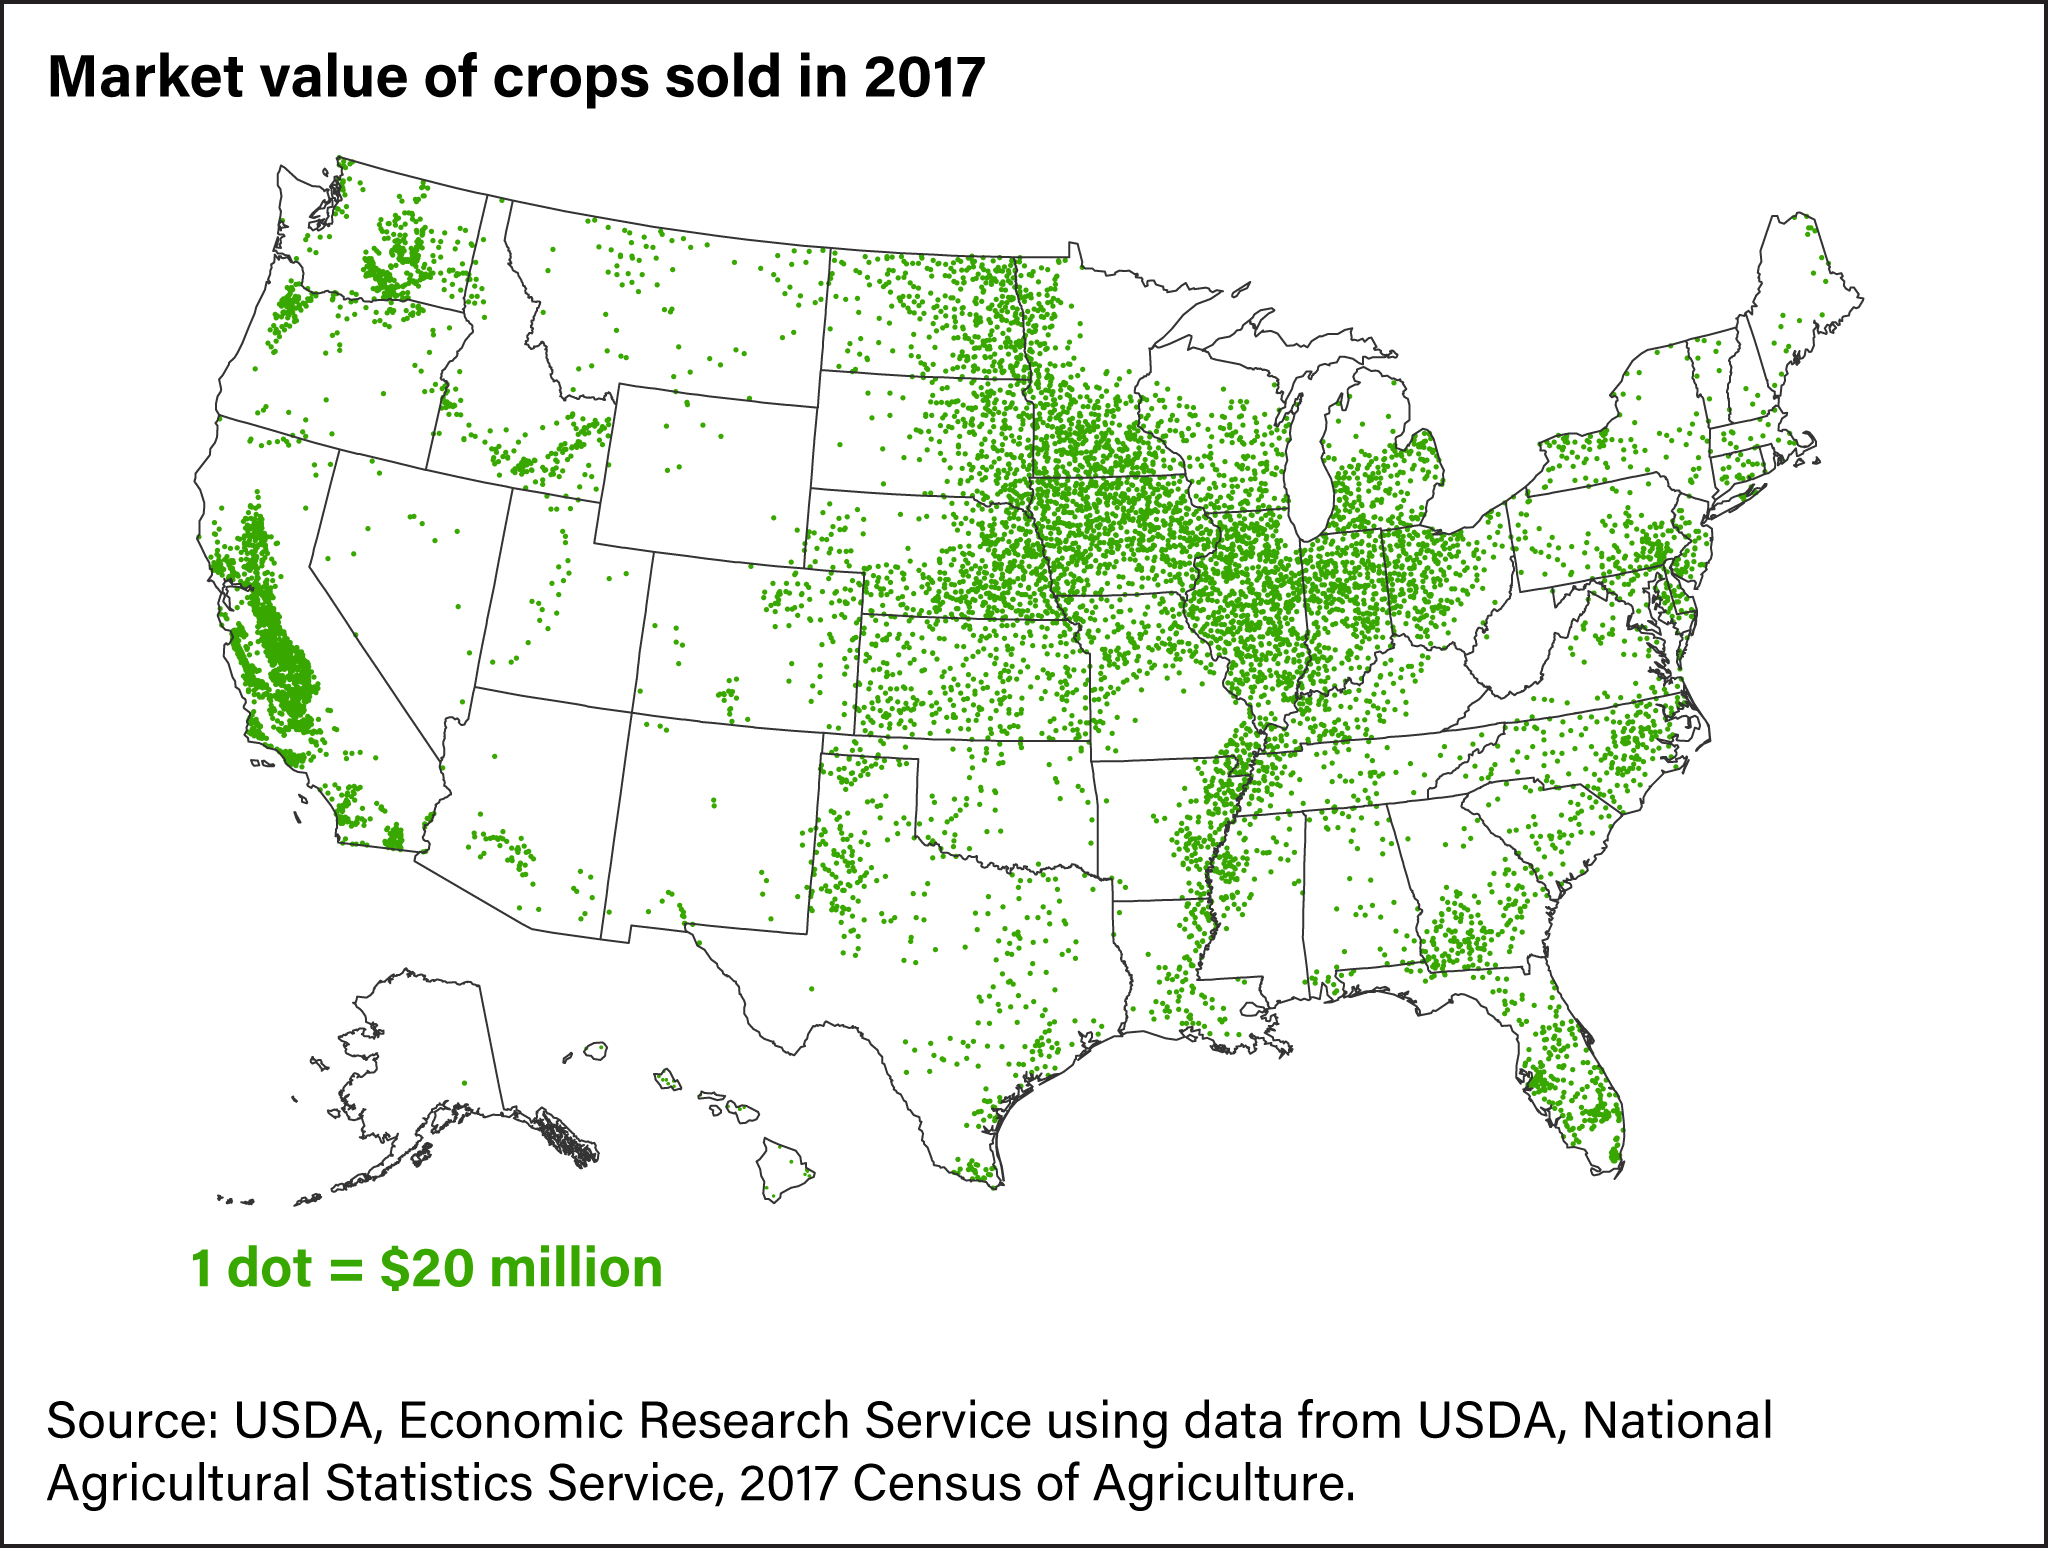
Overall U.S. crop production is concentrated in California and the Midwest
- by Timothy Ruth
- 2/22/2023
The five states with the highest value of crop sales are California, Illinois, Minnesota, Iowa, and Nebraska. With its large horticultural sector, California's overall crop value of more than $33 billion (in 2017) is about 59 percent higher than that of Illinois, the second-ranked State. In contrast to California, crop values in the next four leading States derive from grains and oilseeds (particularly corn and soybeans). For other crops, Washington State typically leads the country in apple production, while Florida is the largest producer of oranges. -
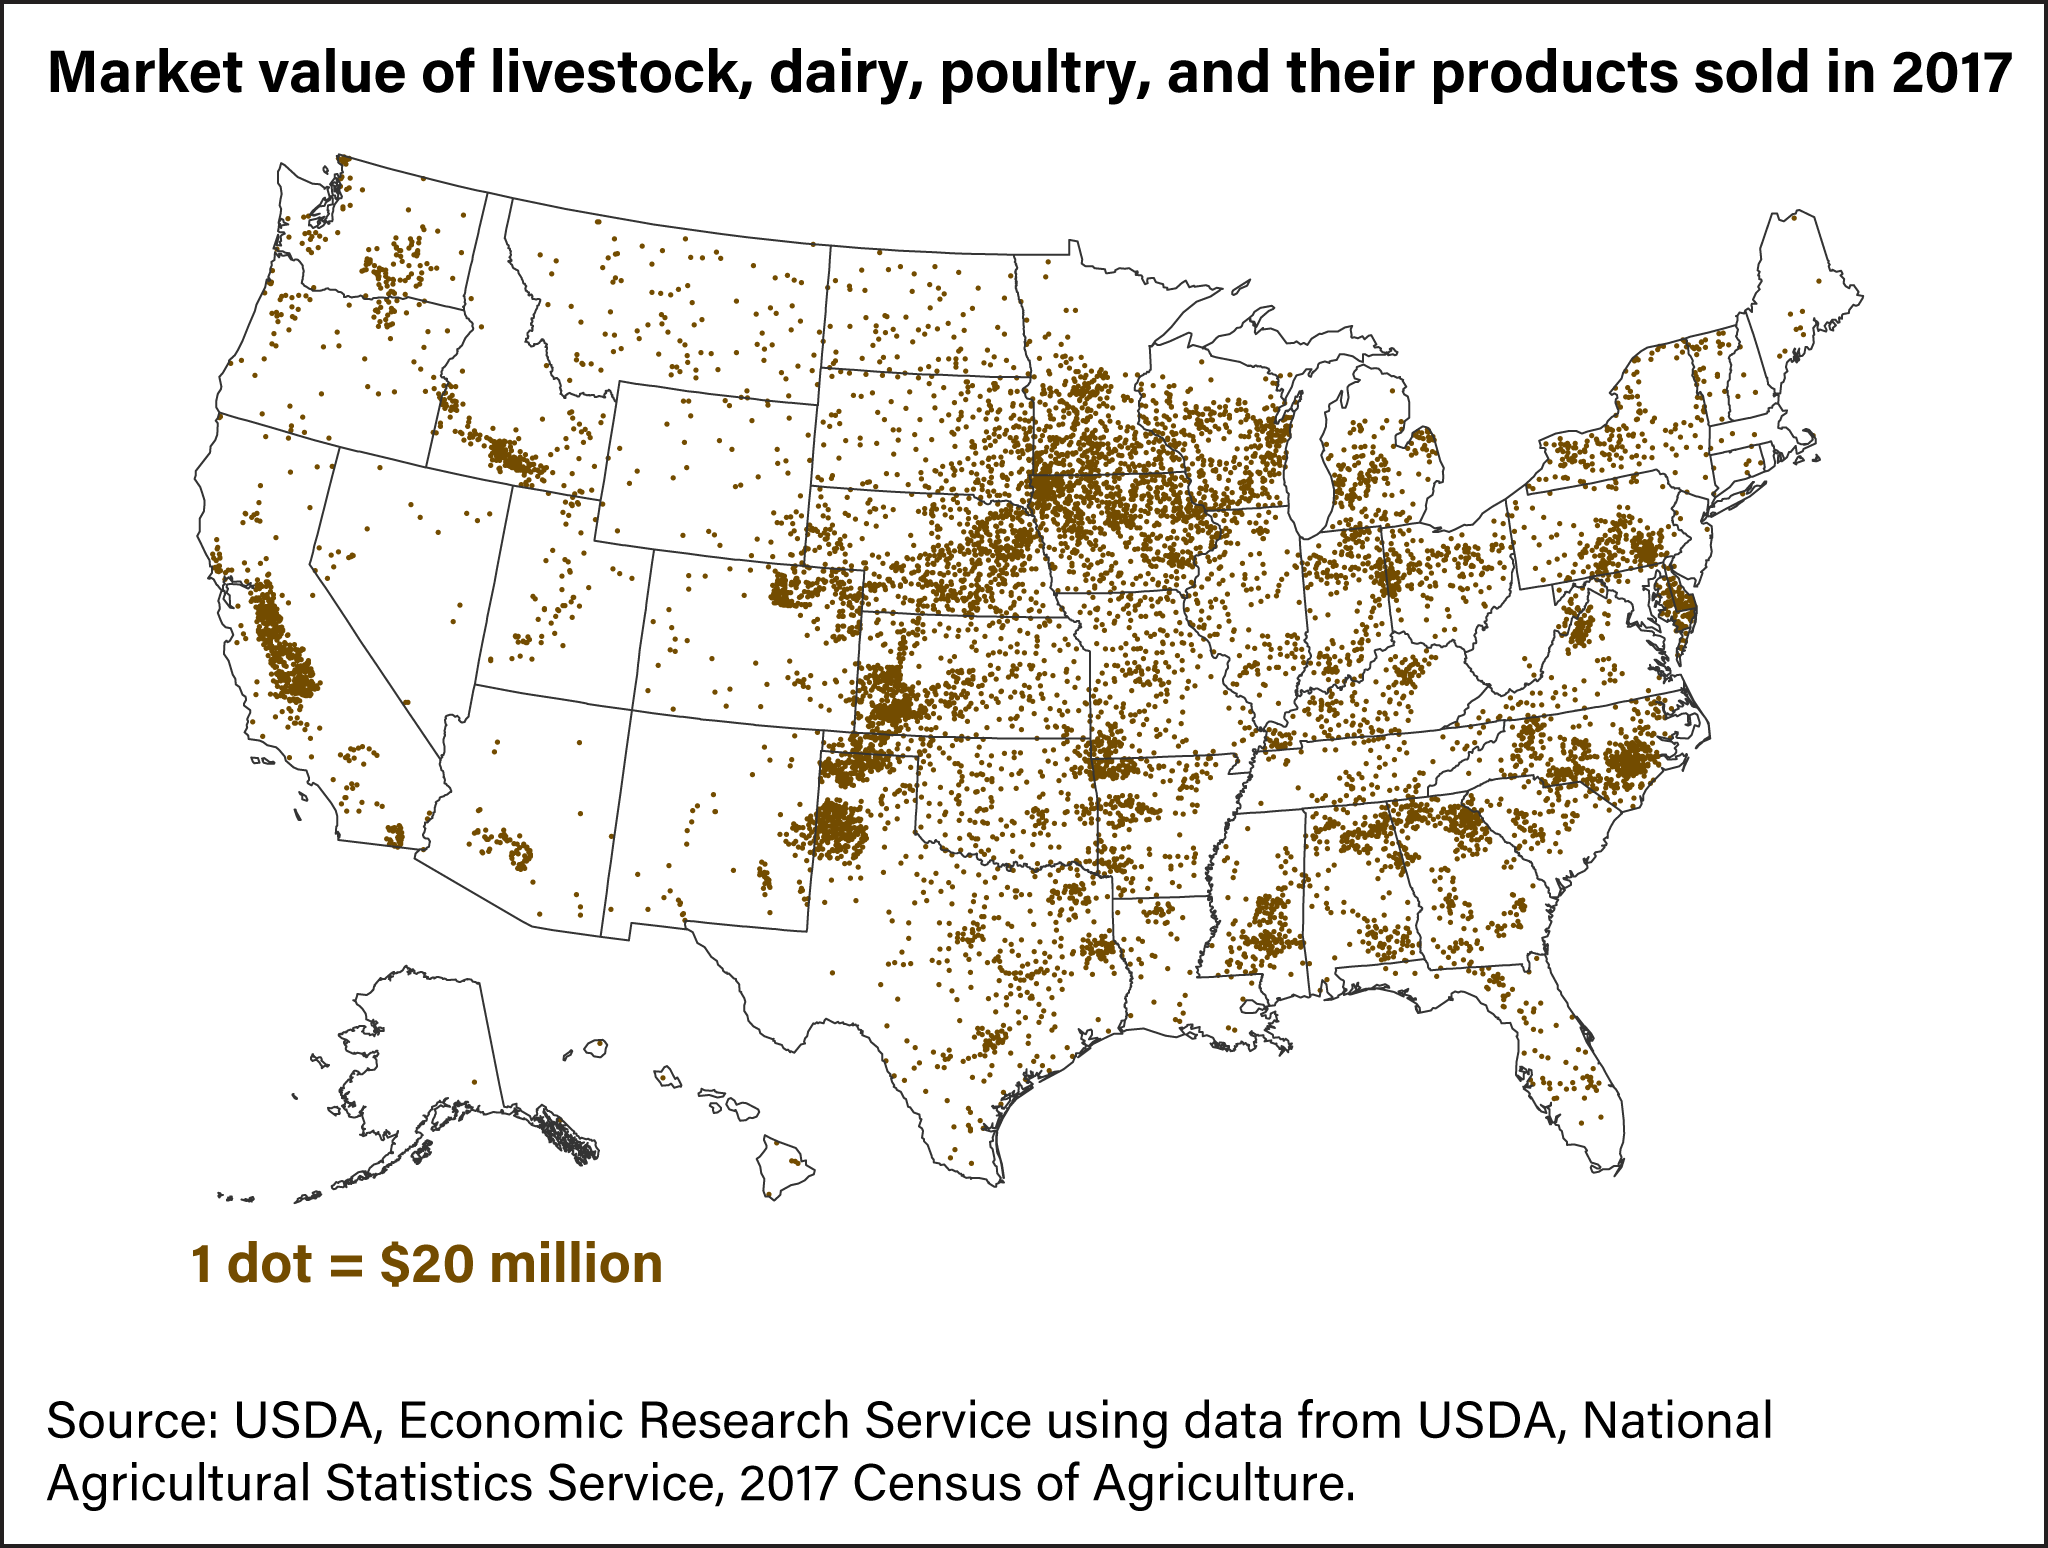
Livestock production is scattered across the country
- by Timothy Ruth
- 2/22/2023
Livestock production and sales occur in all 50 States. California, Iowa, Texas, Nebraska, and Kansas lead the country in sales value of livestock and their products. The cattle sector is the dominant source of value in Texas, Kansas, and Nebraska. Milk from cows account for about 56 percent of livestock-sale value in California. Both the hog and cattle sectors are large sources of sales value in Iowa. Since 2012, Georgia has overtaken North Carolina as the leader in poultry and egg production. -
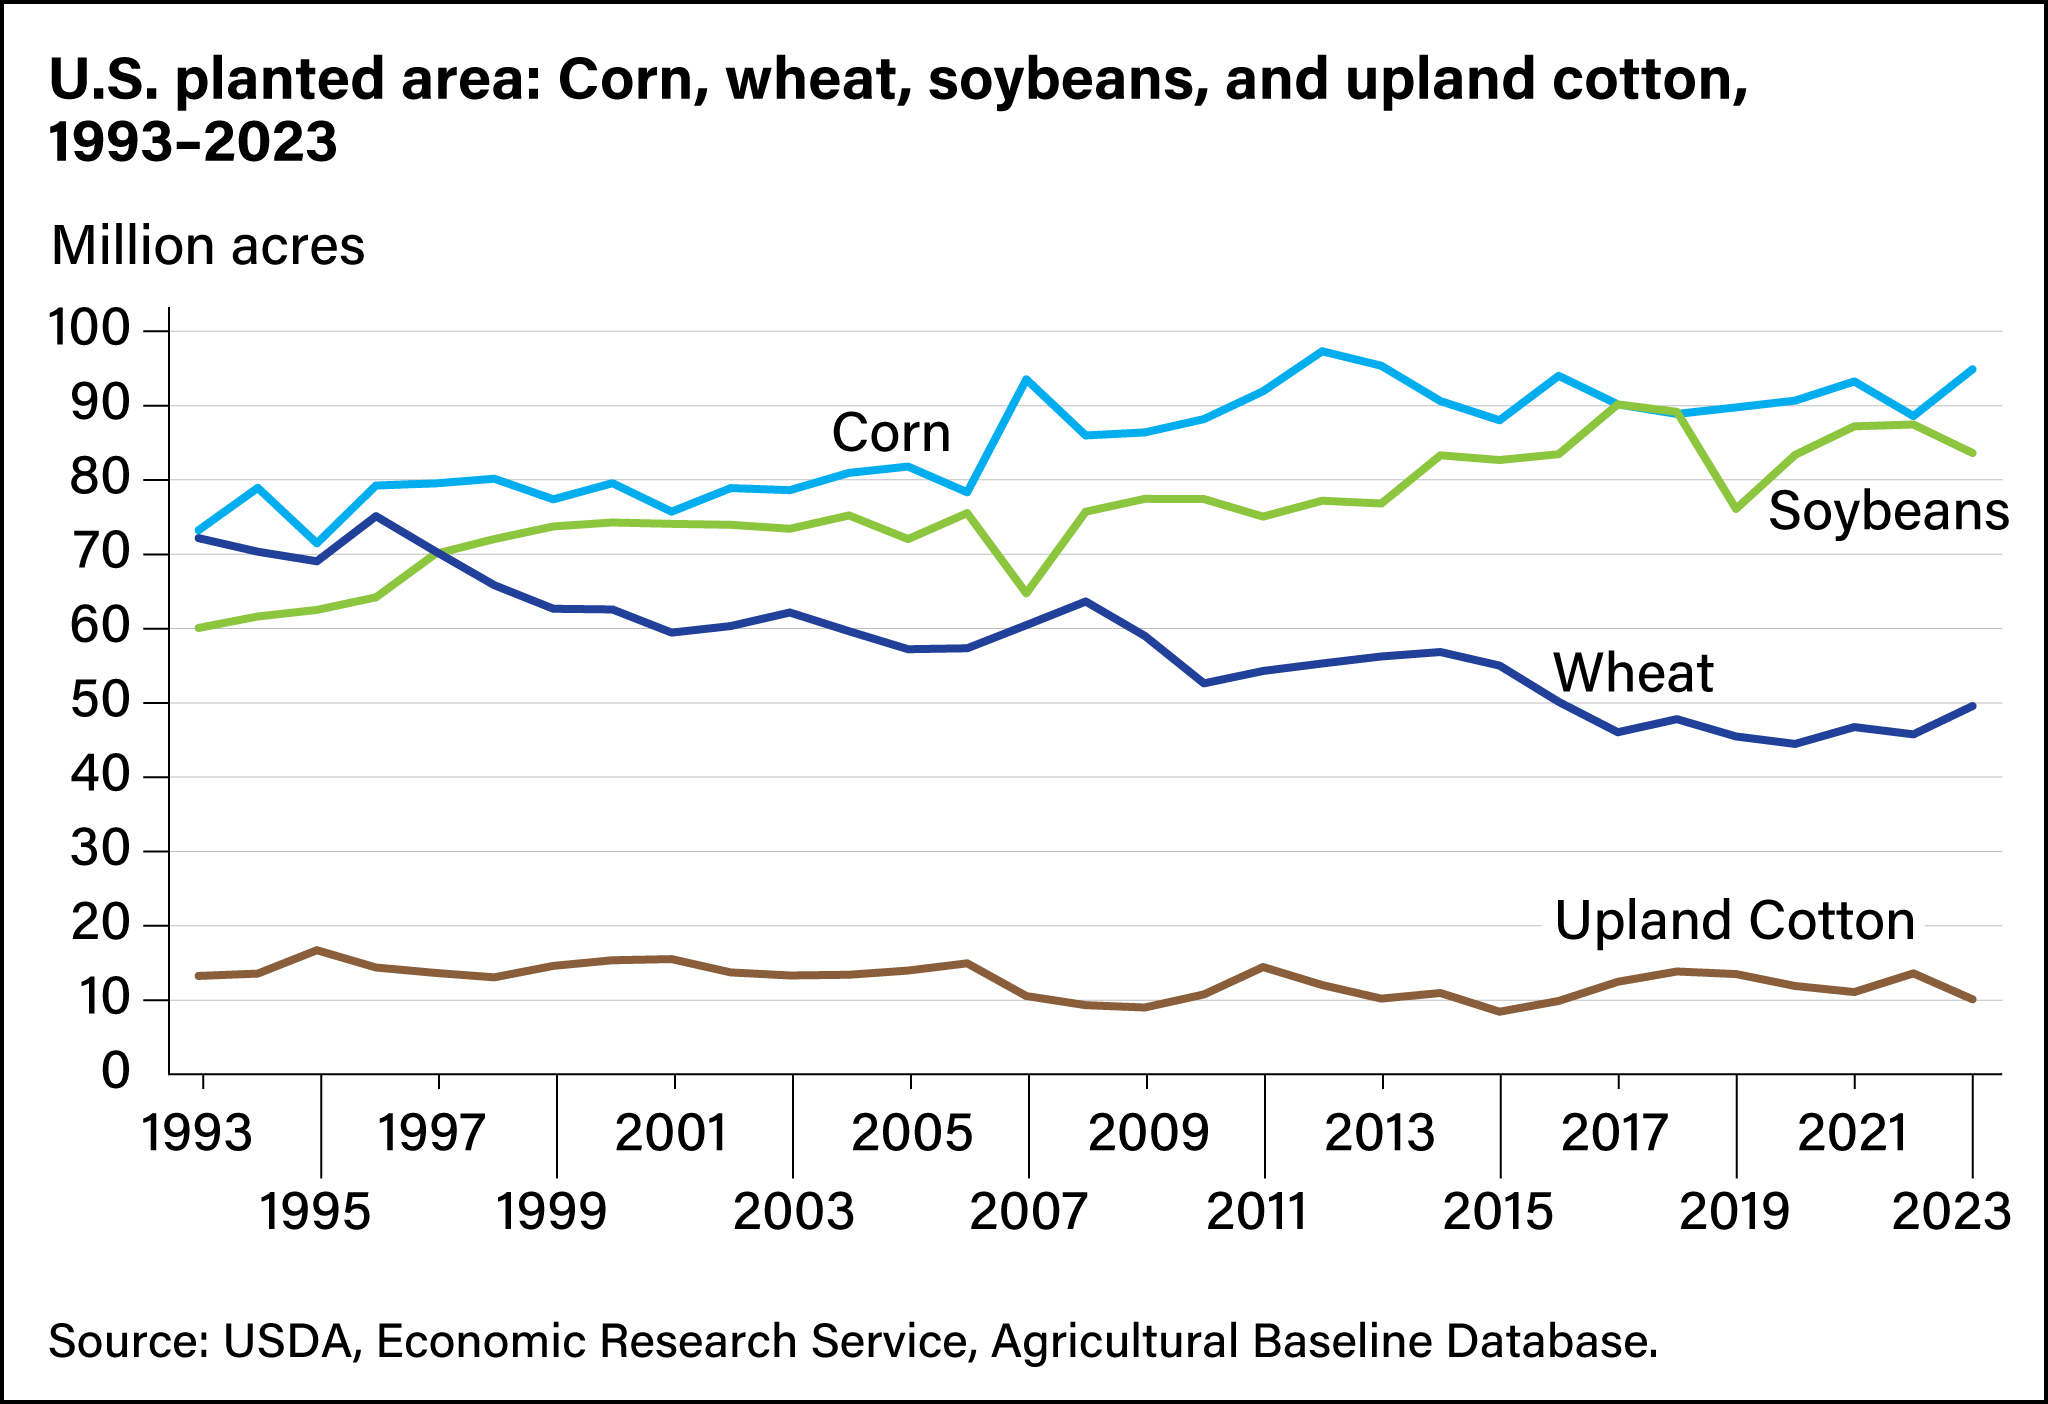
Corn and soybean acreage has increased since the 1990s, while fewer acres are planted with wheat
- by Matthew Miller
- 2/8/2024
Since 1993, combined acreage planted to corn, wheat, soybeans, and upland cotton in the United States has ranged from 219 million to 242 million acres. Starting in the 1990s, policy changes increased planting flexibility provided to farmers. These changes have allowed farmers to respond to market signals for their cropping choices. Over the past 10 years (2014–23), the combined annual planting acreage for these crops has maintained a higher average (236 million acres) than the previous decade (232 million acres). Since 1993, the three highest combined annual planting totals for corn, wheat, soybeans, and cotton occurred in 2012, 2014, and 2018. Combined acreage in 2023 increased from the previous year to 238 million acres with increased corn and wheat plantings, which offset decreased soybean and cotton. Combined planted acreage for the four crops in 2023 marked their 7th largest since 1993. -
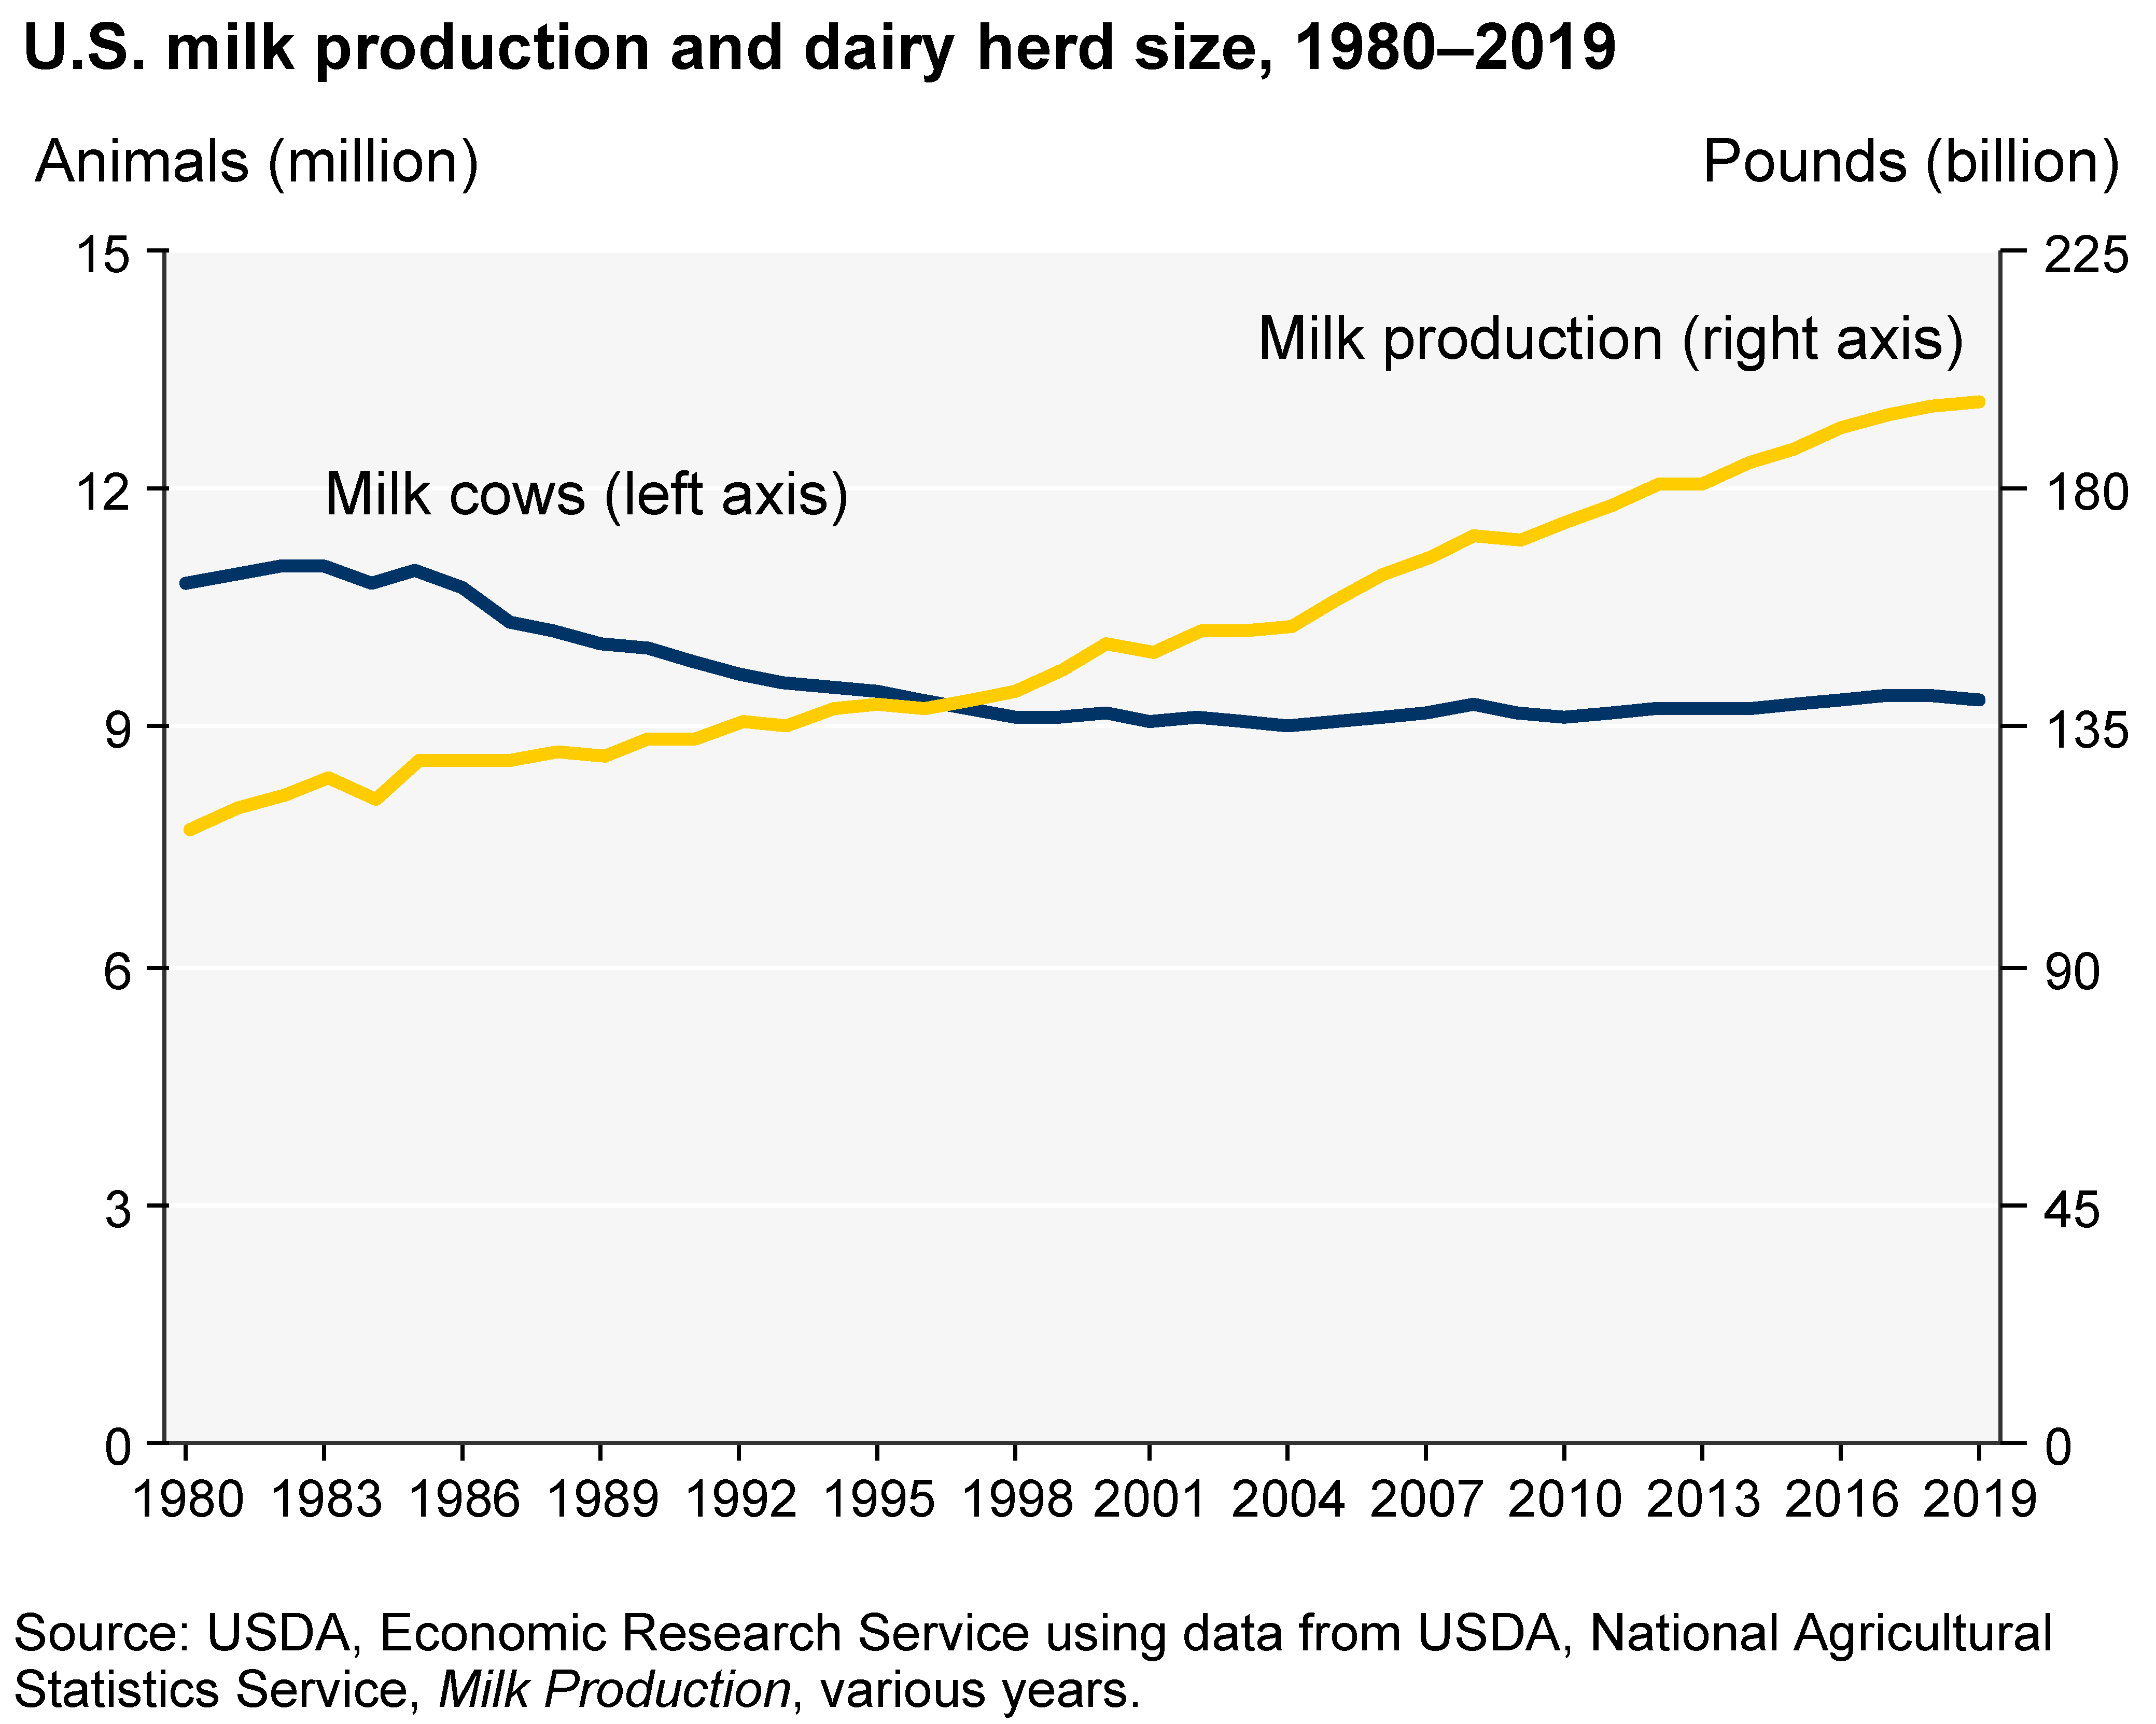
Growth in output per cow drives U.S. milk production gains
- by Adriana Valcu-Lisman
- 2/8/2024
The number of milk cows in the United States generally fell in the 1980s and 1990s but has generally risen since the early 2000s. Milk output has risen 70 percent since 1980 and in 2019 exceeded 218 billion pounds per year. Genetic developments and technological improvements underlie a pronounced upward trend in milk output per cow. Consolidation in the dairy sector also has facilitated efficiency gains in milk production. -
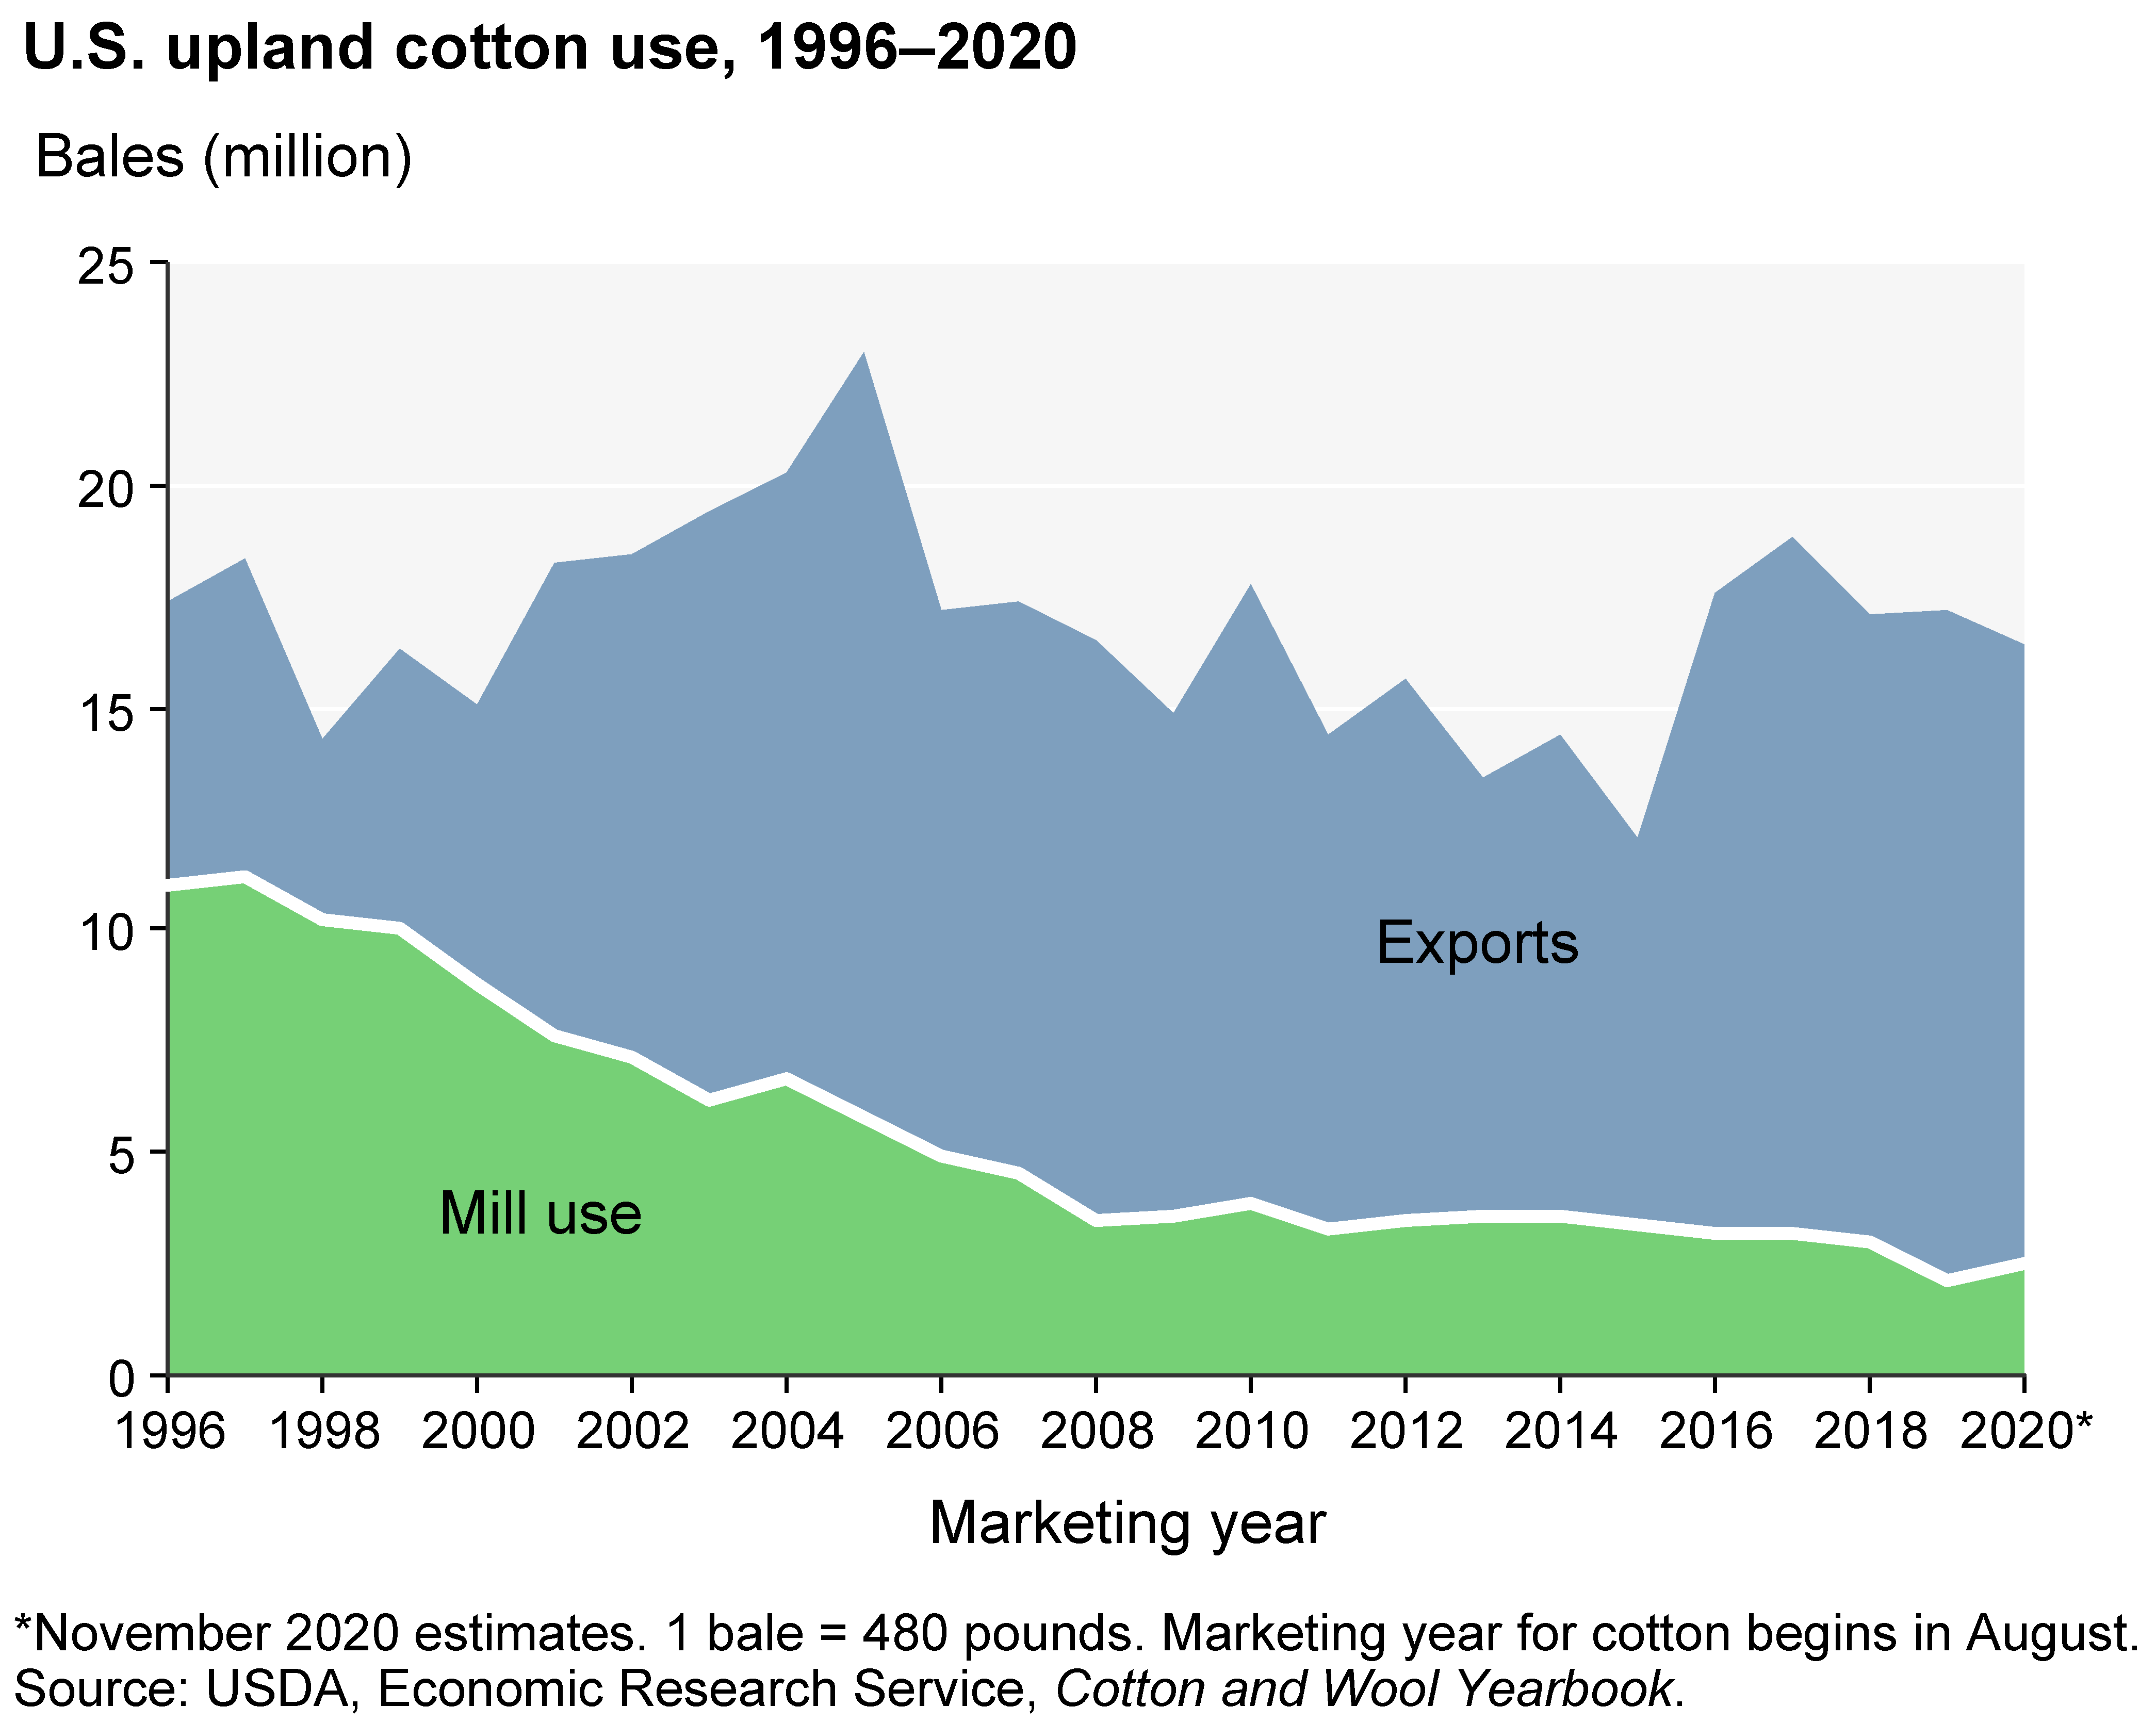
More U.S. cotton is exported than milled domestically
- by Leslie Meyer
- 1/4/2021
The 10-year phase-out of textile and apparel import quotas that existed under the international Multifiber Arrangement was completed at the start of 2005, leading to increased U.S. imports of those products and contributing to reduced U.S. cotton mill use. As a result, U.S. raw cotton exports have become increasingly important. Exports now account for approximately 85 percent of overall use of U.S. cotton, compared with less than 40 percent in the 1990s. The United States is the leading global exporter of cotton. Vietnam and China are the largest destinations for U.S. cotton exports. -
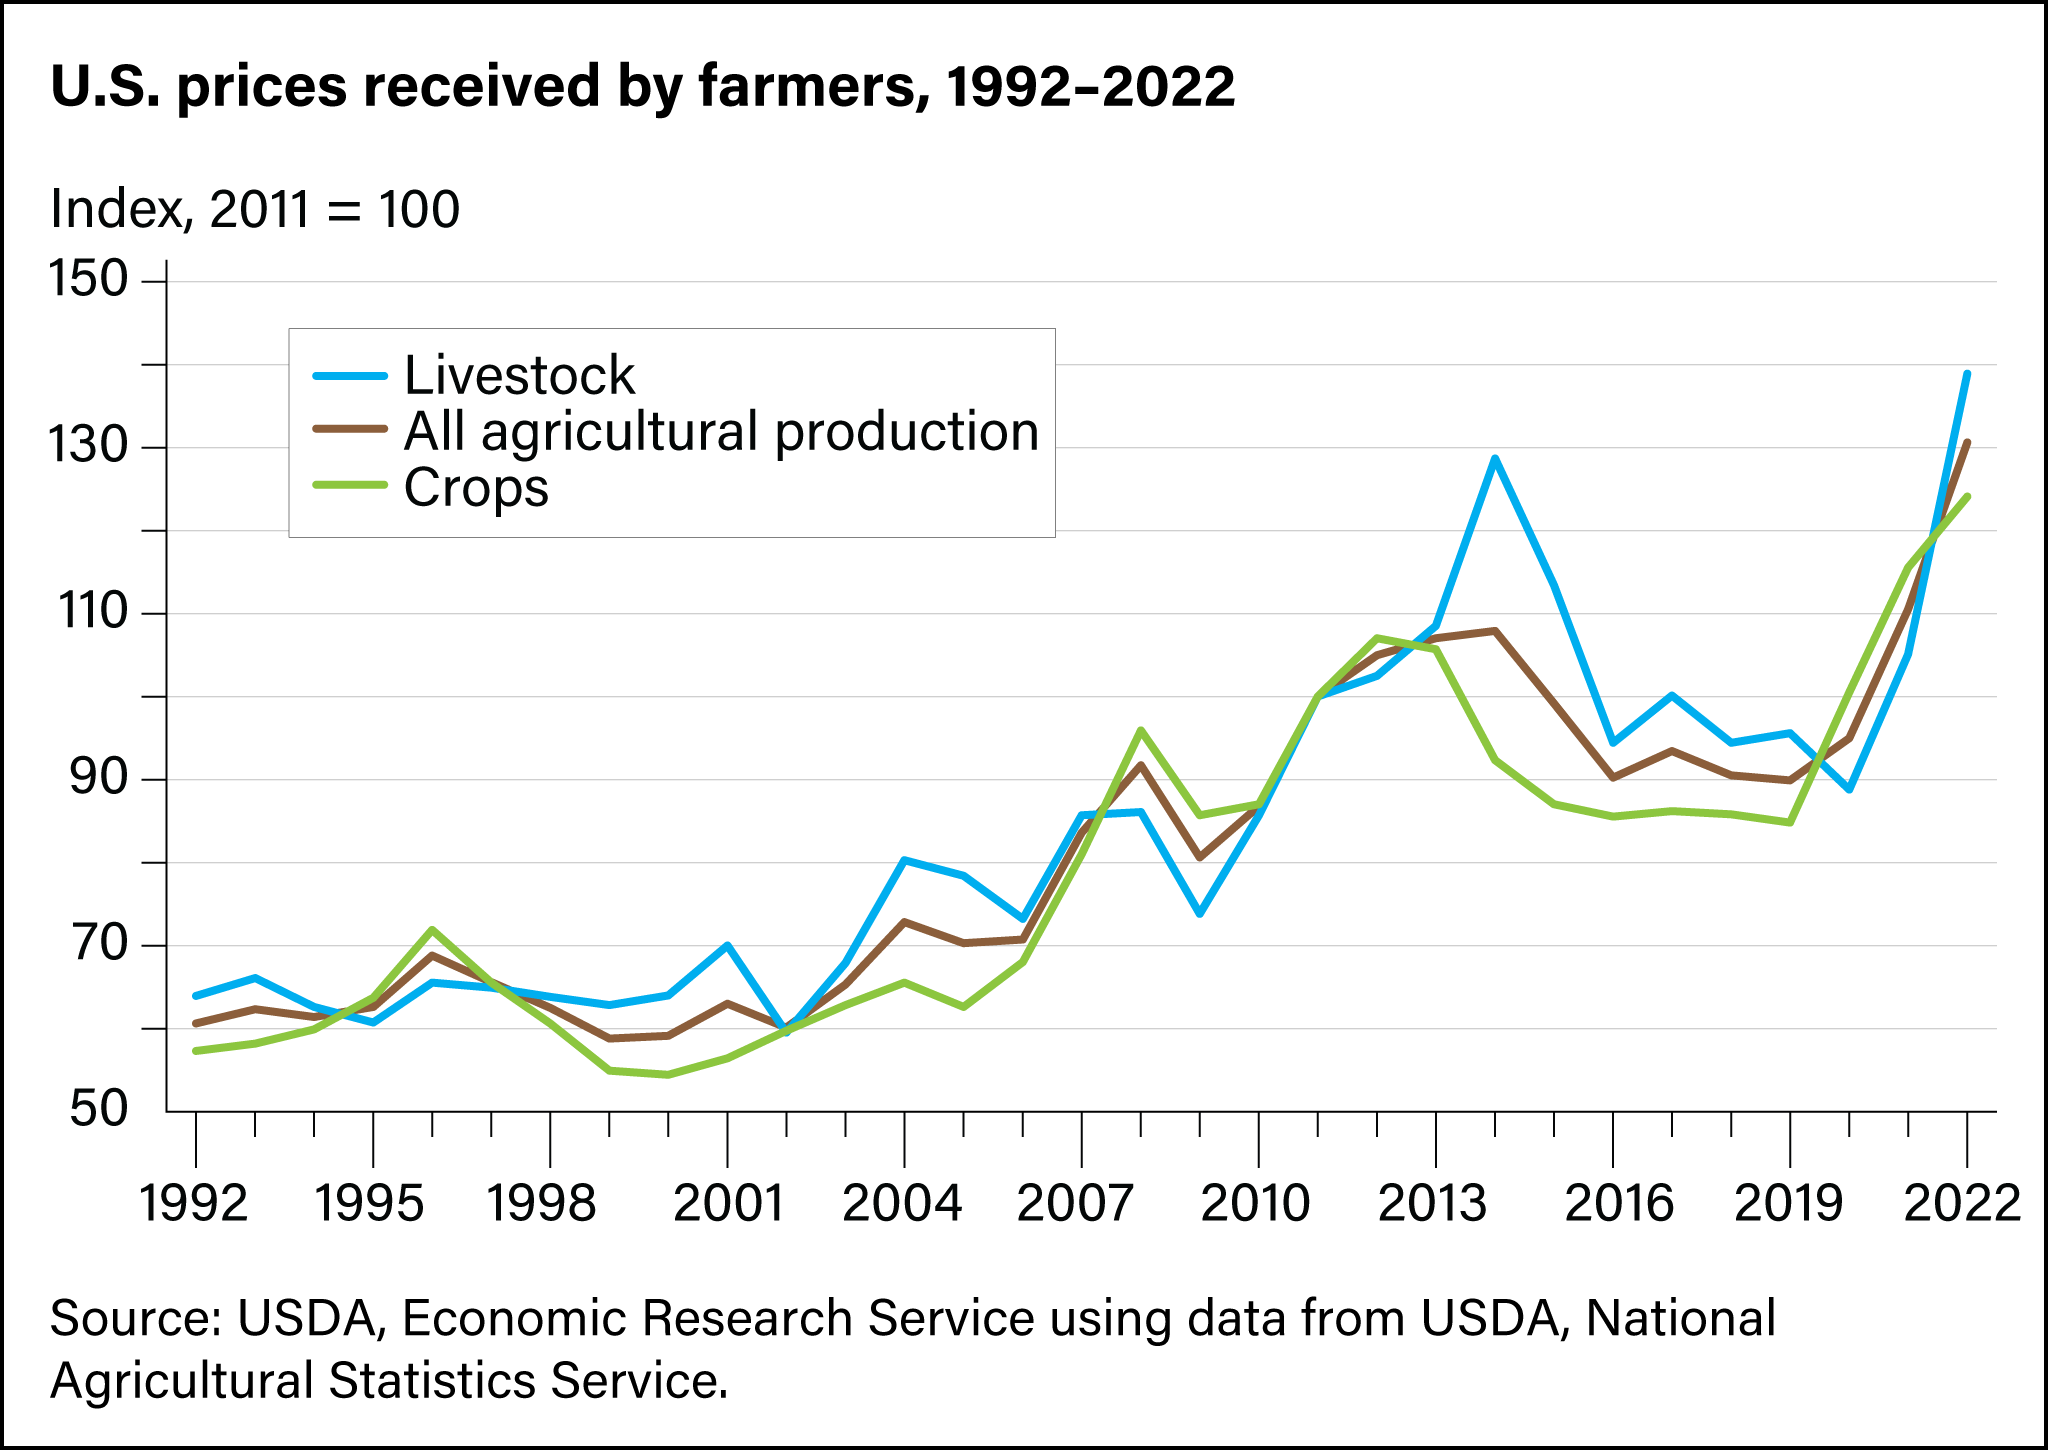
Agricultural prices have been trending upward since 2020
- by Brian Williams and Matthew Miller
- 2/8/2024
Prices for agricultural commodities tend to vary year-to-year, but they remained relatively stable for both crops and livestock for a 4-year period from 2016 through 2019. In 2020, aggregate crop prices jumped 18 percent and continued to rise another 14 percent year-over-year in 2021, to a record-high level. This record grew higher in 2022 when aggregate crop prices increased about 8 percent. While crop prices rose at the beginning of the Coronavirus (COVID-19) pandemic, livestock prices initially fell by 7 percent in 2020. Prices received for livestock rebounded in 2021 as strong demand and supply chain hurdles pushed prices up 18 percent from the previous year. Aggregate livestock prices increased further in 2022 to an all-time high level. -
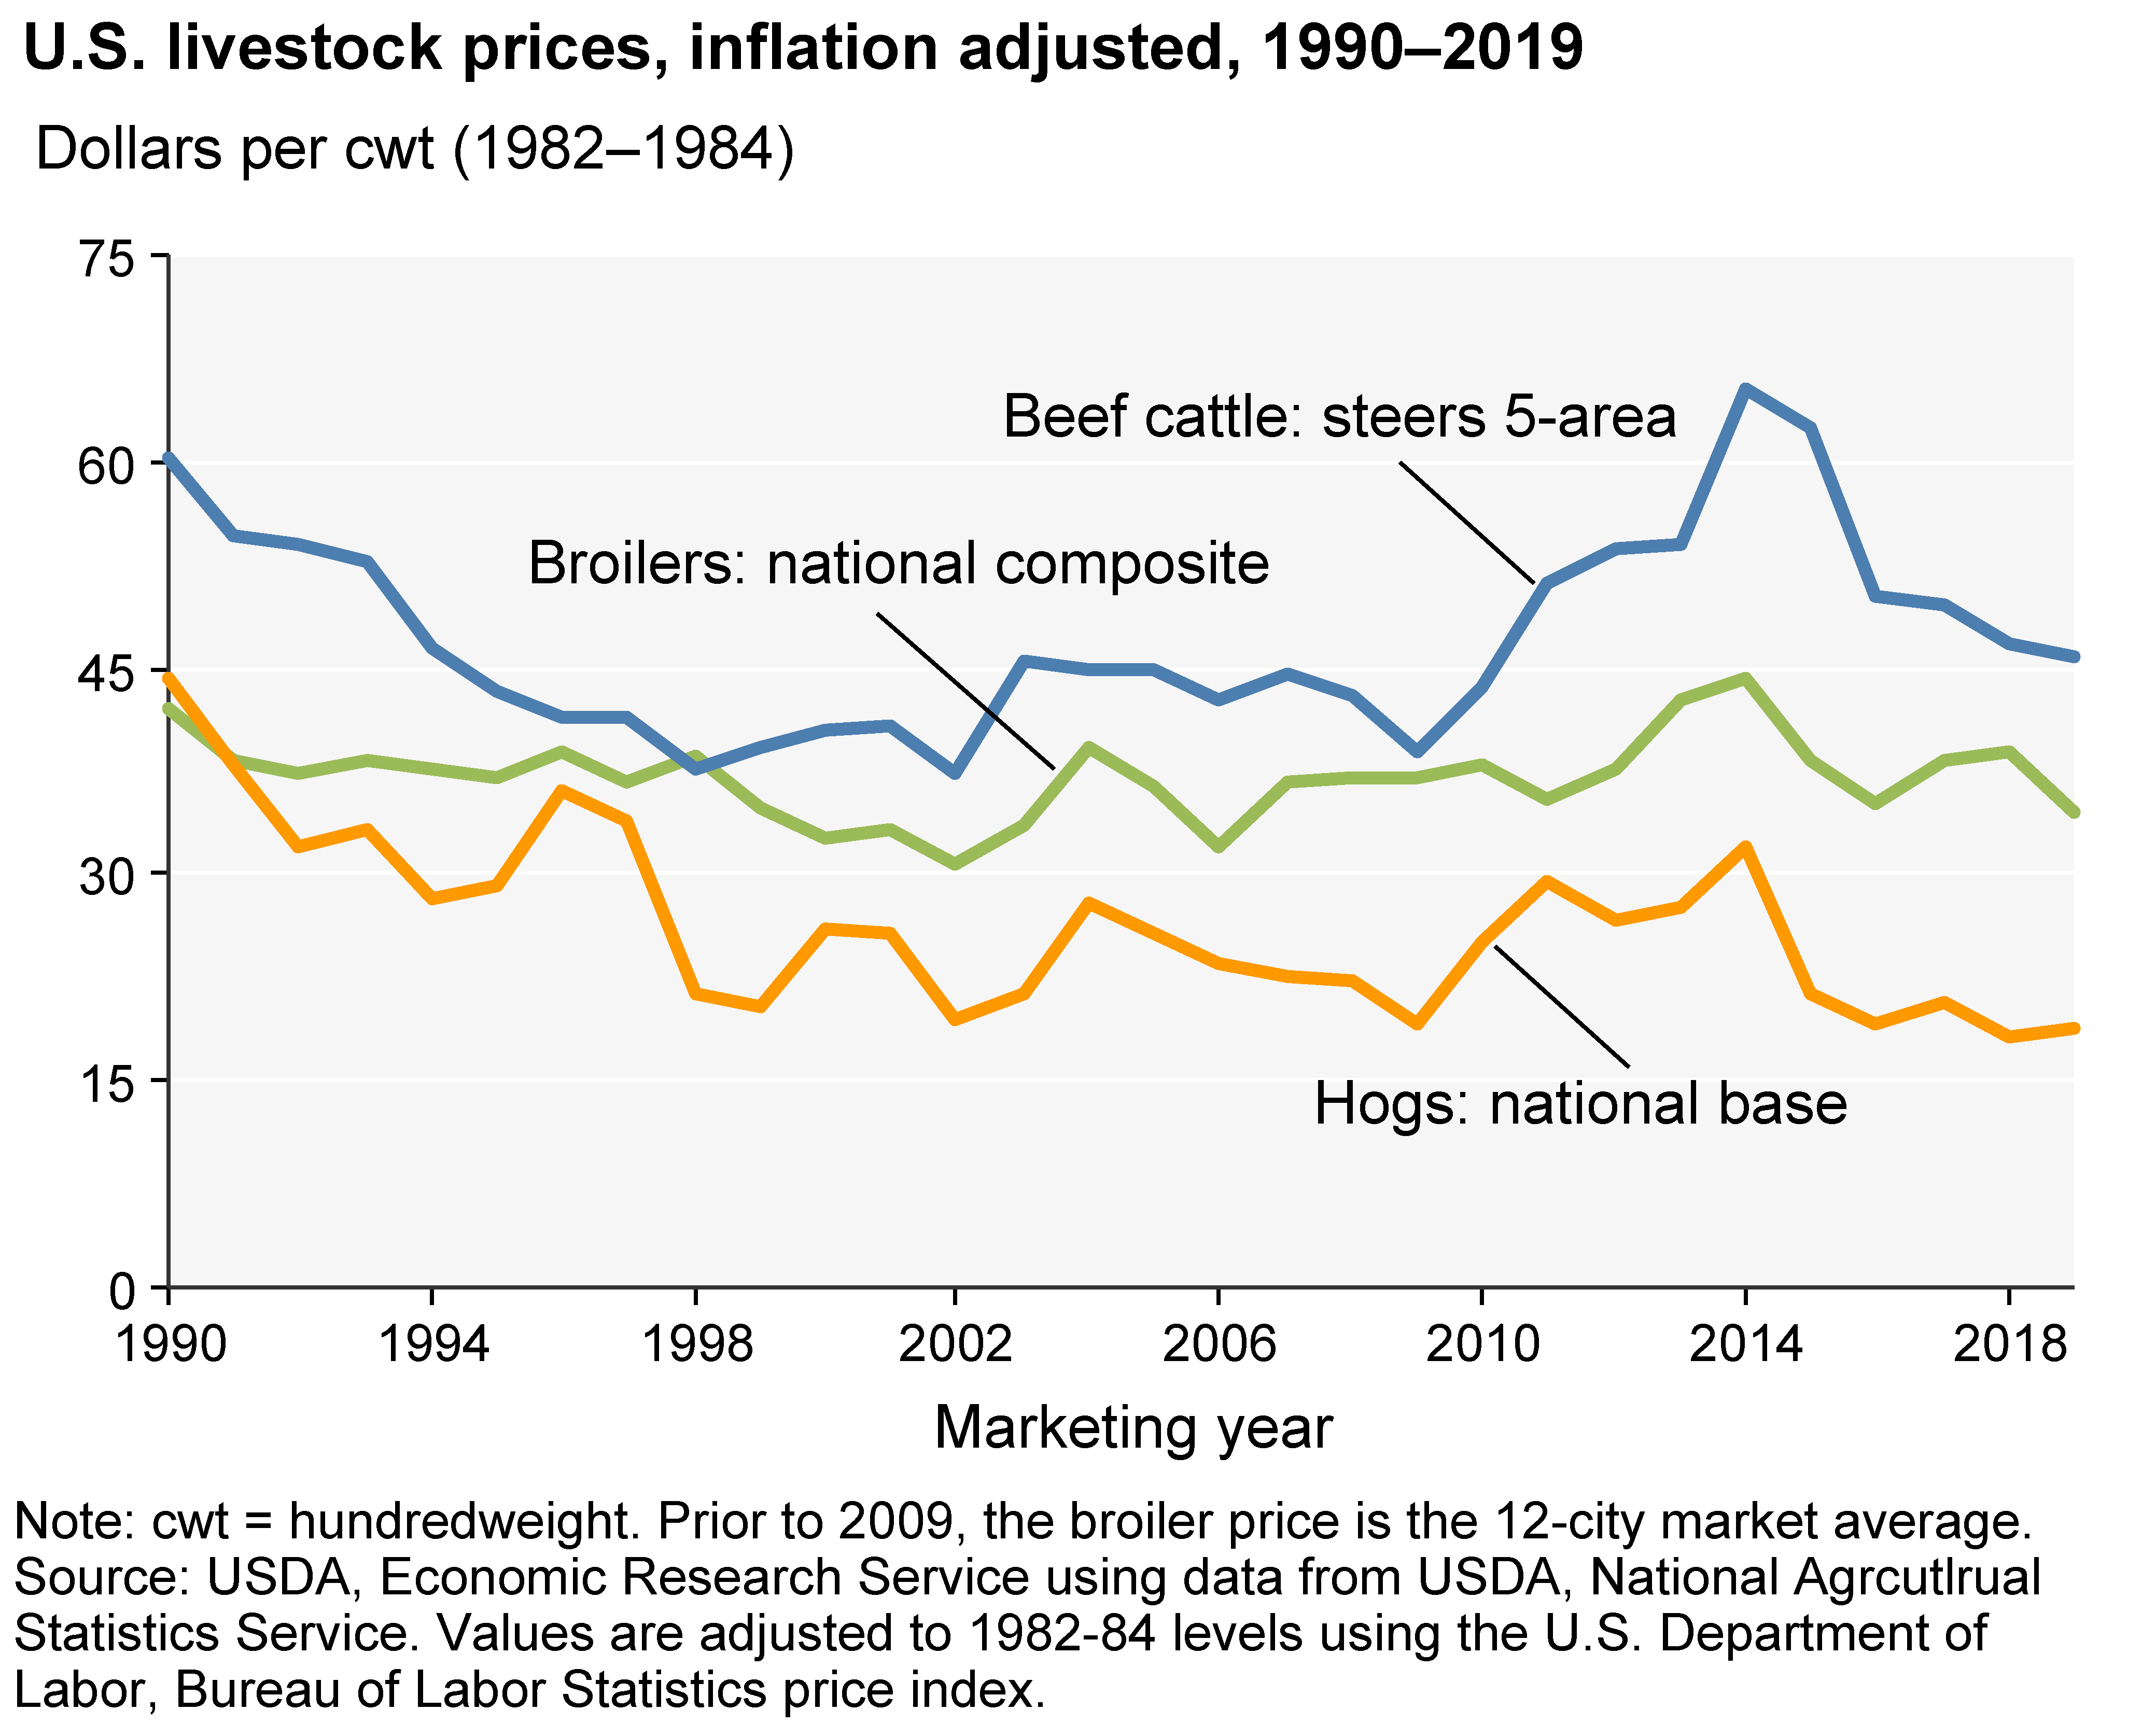
Inflation-adjusted beef cattle prices have maintained higher value than hog and broiler rates, 1990–2019
- by William Hahn
- 1/4/2021
Cattle, hog, and broiler prices have not kept pace with inflation over the past 30 years. Inflation-adjusted hog prices have been lower than 1990 prices from 1991 on. The highest inflation-adjusted cattle and broiler prices in the past 30 years were in 2014. (2014 inflation-adjusted hog prices were the highest they have been in the 21st century.) From 2000 to 2014, inflation-adjusted meat prices reflected slower production growth as meat output responded to lower producer profits due in part to rising feed costs. Cattle production costs, production, and prices also were affected by poor forage conditions due to lingering droughts over much of the past decade, particularly in the Southern Plains. As feed prices have softened, however, livestock production has risen since 2015, lowering U.S. livestock prices.