

ERS Data Products Show Food-At-Home Price Inflation From Producers to Consumers
- by Megan Sweitzer, Matthew MacLachlan, Wilson Sinclair, Alexander Stevens, Hayden Stewart, James Chandler Zachary and Eliana Zeballos
- 7/10/2023
Highlights
- U.S. food prices increased from 2020 to 2022 and recorded the largest annual growth rate since the 1970s in 2022. Price inflation was particularly high for food at home.
- U.S. consumers spent more on food at home in 2022 compared with 2019, even after adjusting for inflation.
- Retail food prices respond to changes in input costs from industries along the food supply chain.
As a basic necessity, food is a major component of household spending, representing 12.4 percent of U.S. household expenditures in 2021, behind housing (33.8 percent) and transportation (16.4 percent). Food price growth, or food inflation, affects all household budgets and can disproportionately impact the financial health as well as the food and nutrition security of lower income consumers. Lower income households spent a greater share of their income (30.6 percent) on food in 2021 than the national average. Moreover, rising food prices can force households to shift spending from other budget categories to allow them to buy enough food.
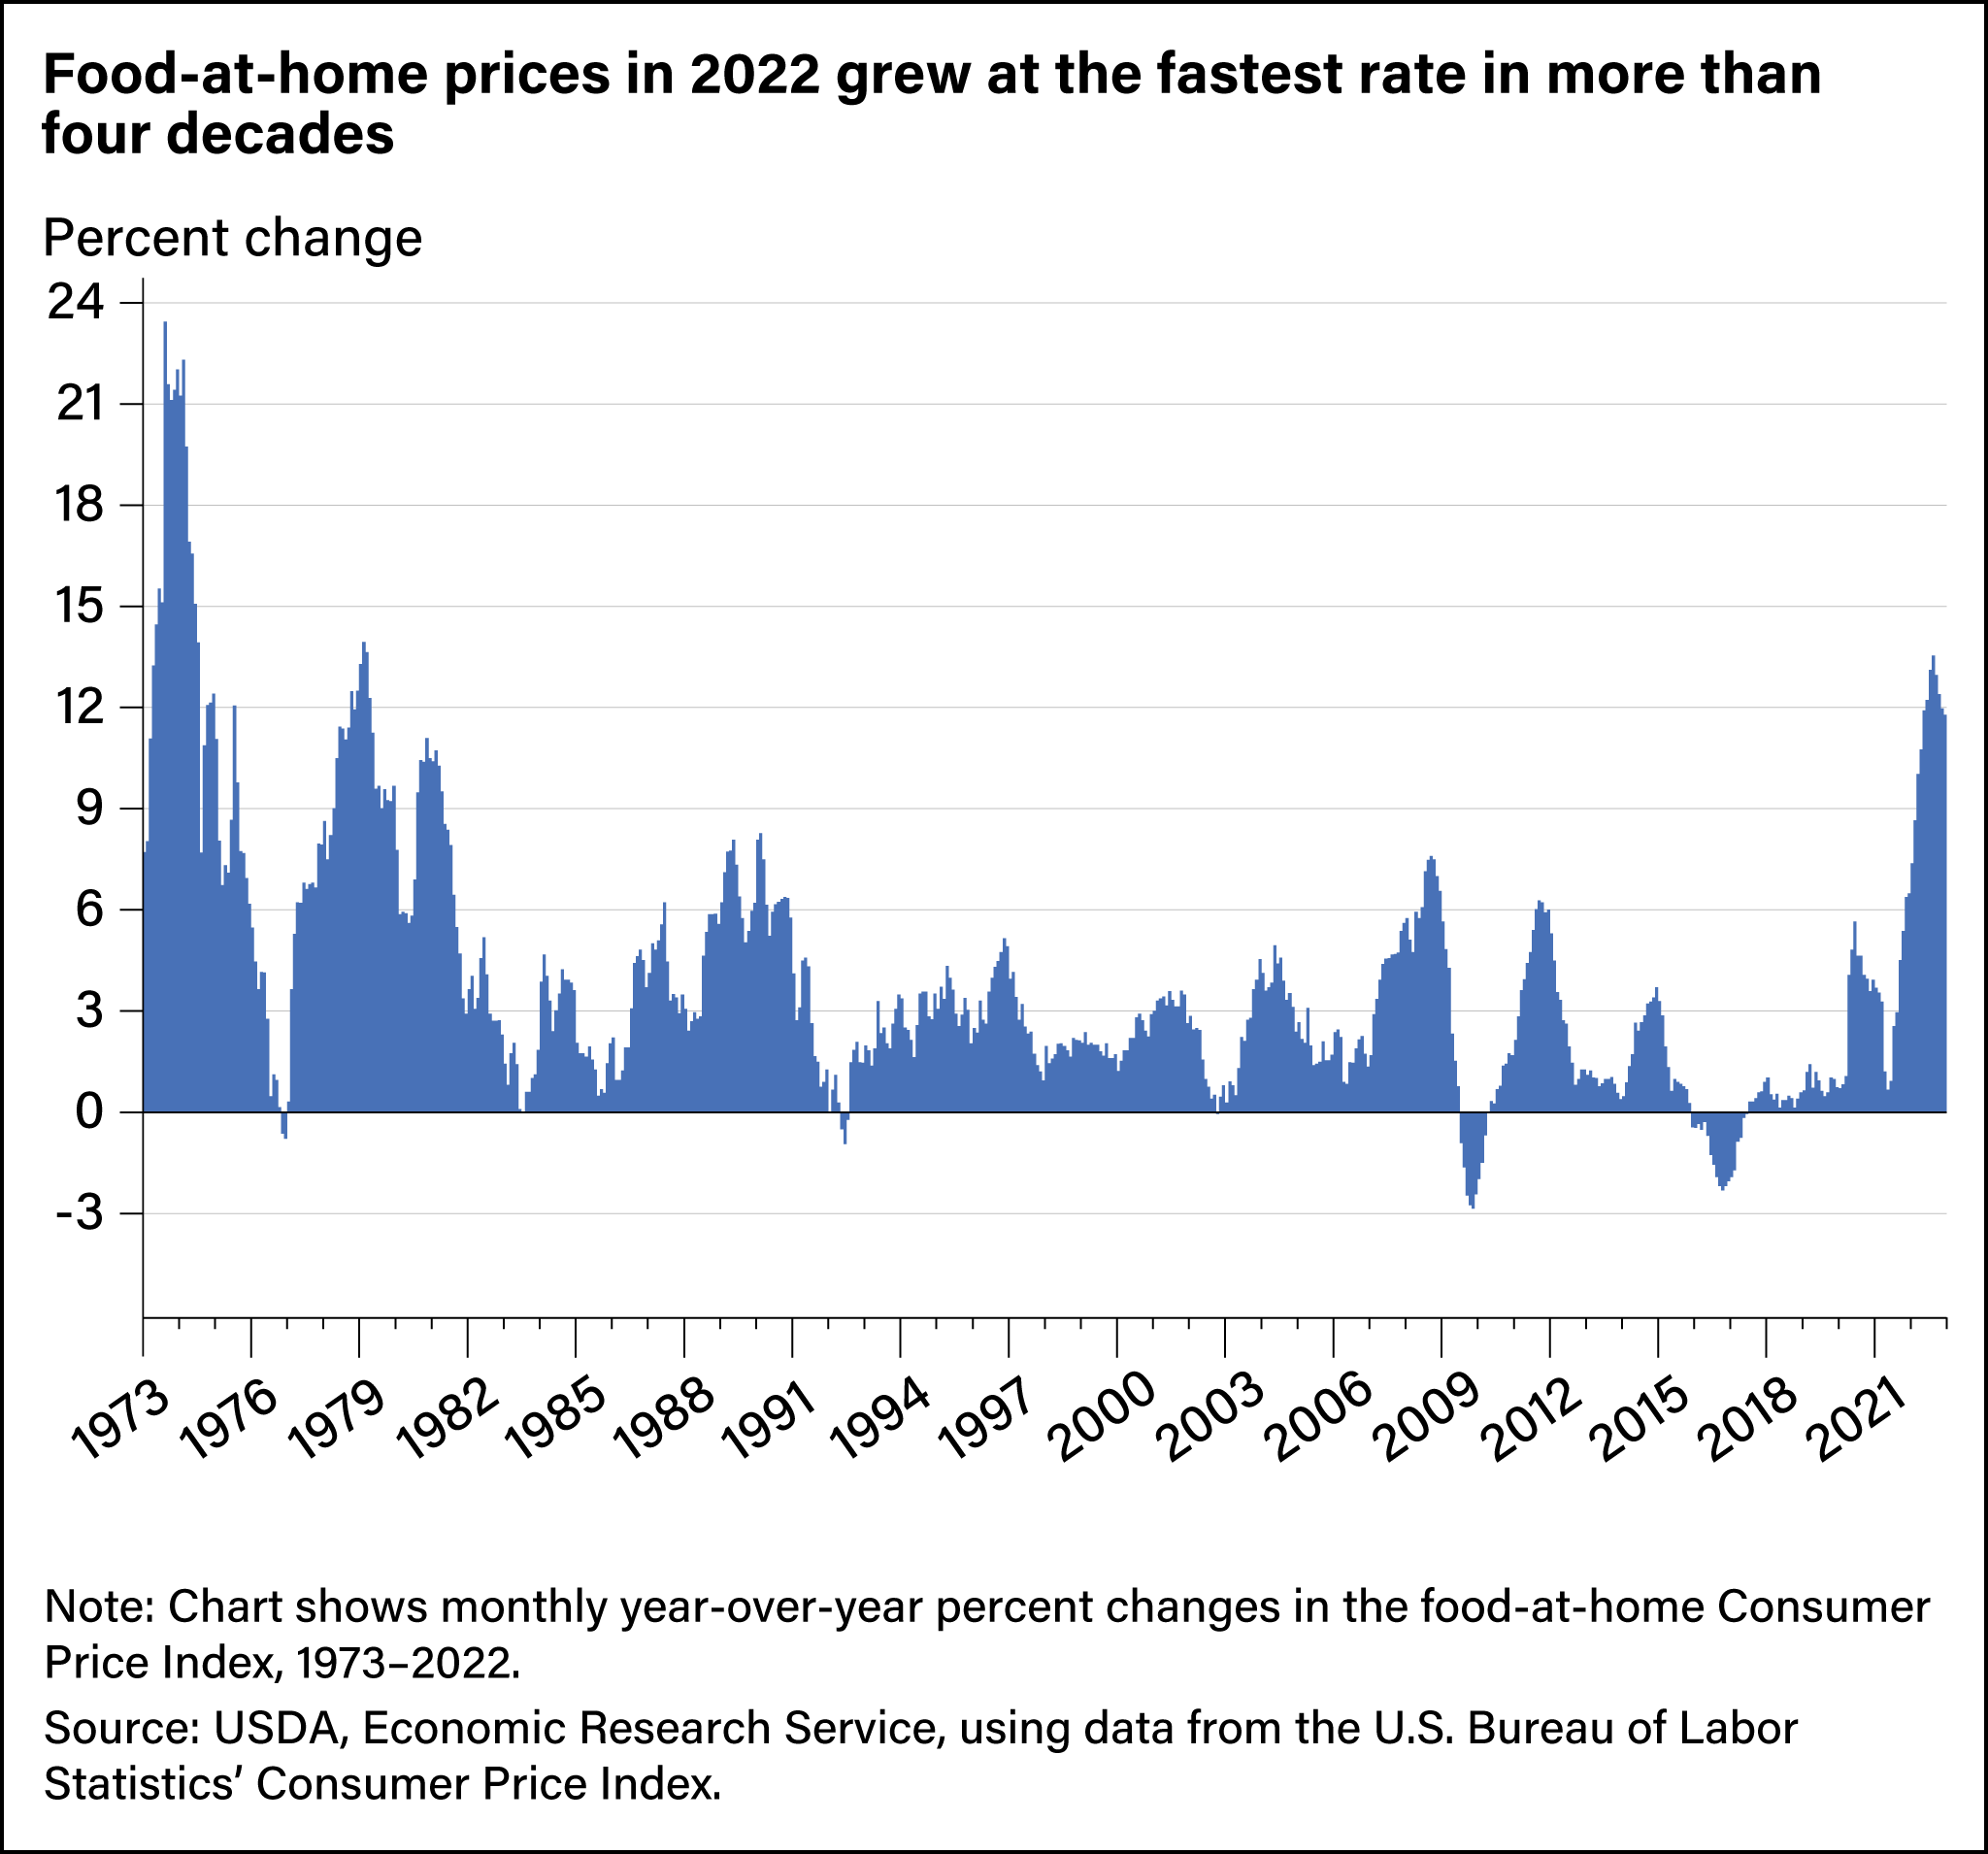
The USDA, Economic Research Service (ERS) maintains a suite of data products related to food markets and prices that can shed light on food price changes and impacts. One of those data products, the Food Price Outlook, shows that U.S. food prices grew rapidly and with increased volatility from 2020 through 2022, driven by economy-wide inflationary pressures as well as changes in food supply and demand. Food consumption patterns shifted markedly after the onset of the Coronavirus (COVID-19) pandemic. Other shocks to the food supply chain, including an outbreak of highly pathogenic avian influenza and Russia’s war against Ukraine, compounded inflationary pressures in the food processing and retail sectors. Prices for food at home (FAH), or groceries, rose by 3.5 percent in 2020 and 2021. These increases outpaced the average 2.0-percent growth rate from 2000 to 2019. FAH prices then grew by 11.4 percent in 2022. Year-over-year FAH price increases peaked in August 2022, at 13.5 percent higher than in August 2021, the largest such increase since March 1979.
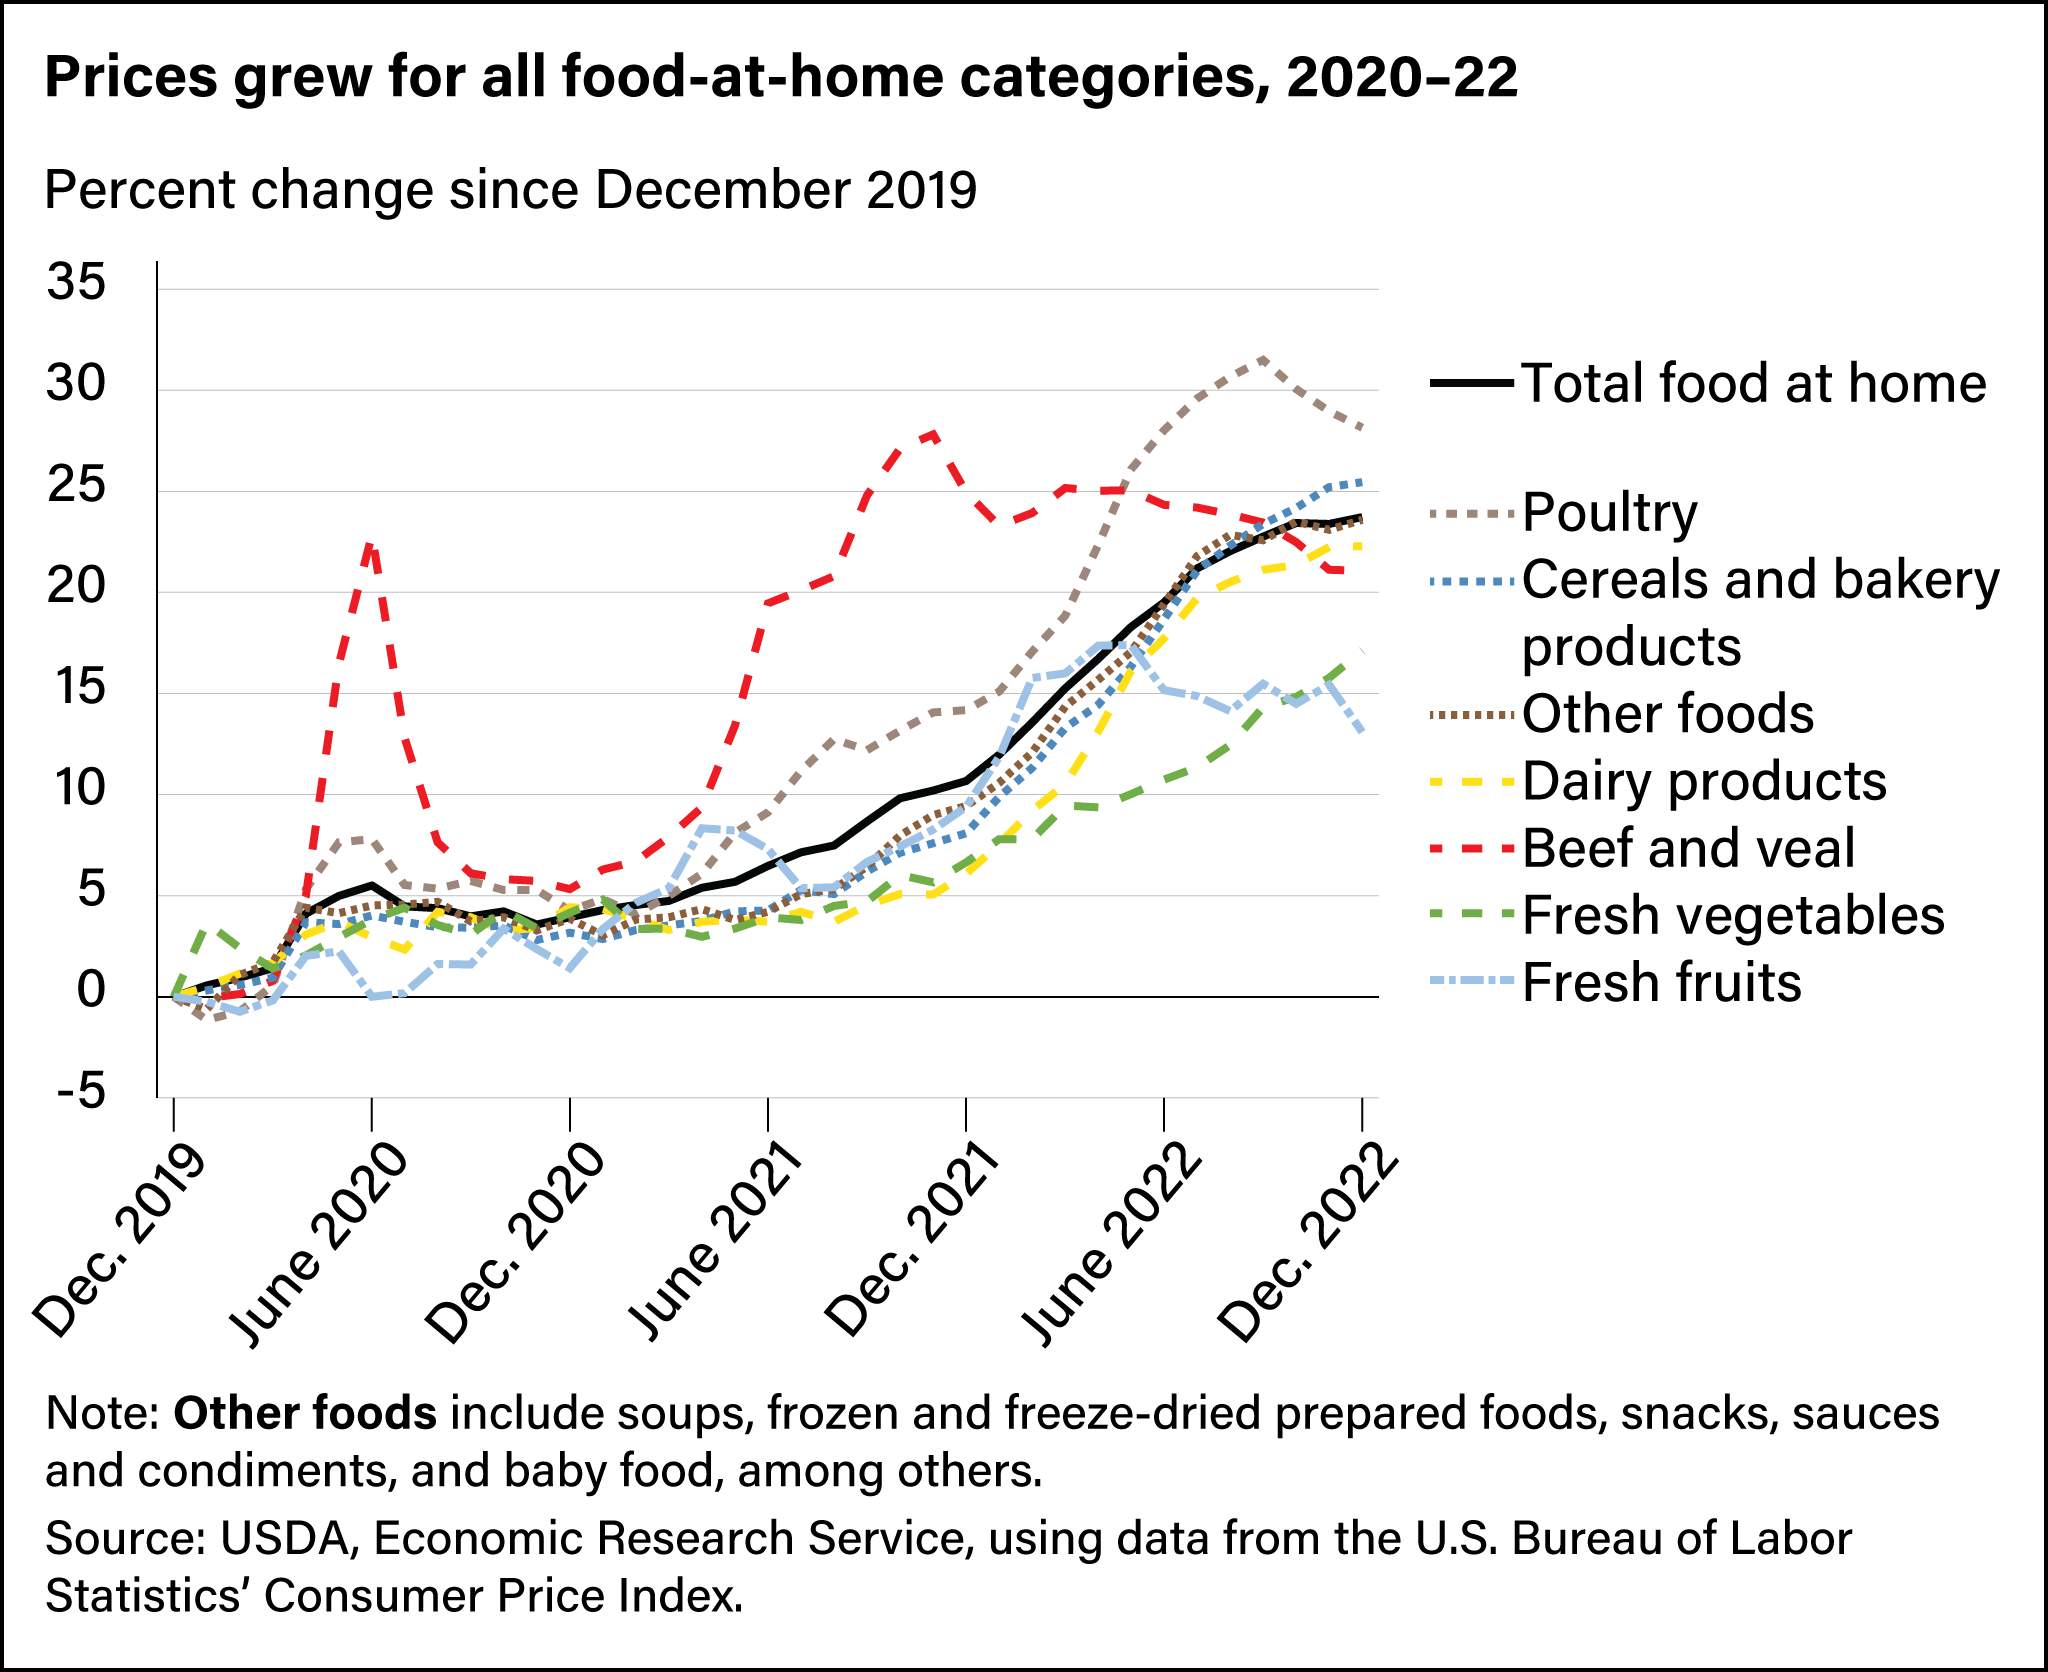
From 2020 through 2022, prices for some types of food purchased for home consumption increased faster than others, reflecting changes in production costs, levels of processing, industry concentration, and consumers’ willingness to pay. In the first half of 2020, beef, veal, and pork prices grew most rapidly as packinghouses struggled with labor disruptions from COVID-19 infections and risk of infections. Meat, poultry, and fish prices continued to grow faster than most other categories through 2021.
Prices for more processed foods grew consistently throughout 2022. These food categories included fats and oils (such as butter and cooking oils), other meats (such as hotdogs and cold cuts), cereals and bakery products, dairy products, processed fruits and vegetables, and nonalcoholic beverages. Meats, poultry, and fish prices grew more slowly in 2022, with beef and veal prices falling from their peak in November 2021. Prices for fresh fruits and vegetables also increased over this period but lagged growth in other categories.
Consumers Adjust Spending in Response to Food Price Changes
When food prices rise, spending on food typically rises as well. However, these expenditures may rise more, or less, than the rate of inflation because households may respond to higher prices by buying less food, limiting purchases of discretionary items, or choosing less expensive alternatives. By adjusting food spending data for inflation, researchers remove the effects of price changes and are able to capture “real” changes in consumption.
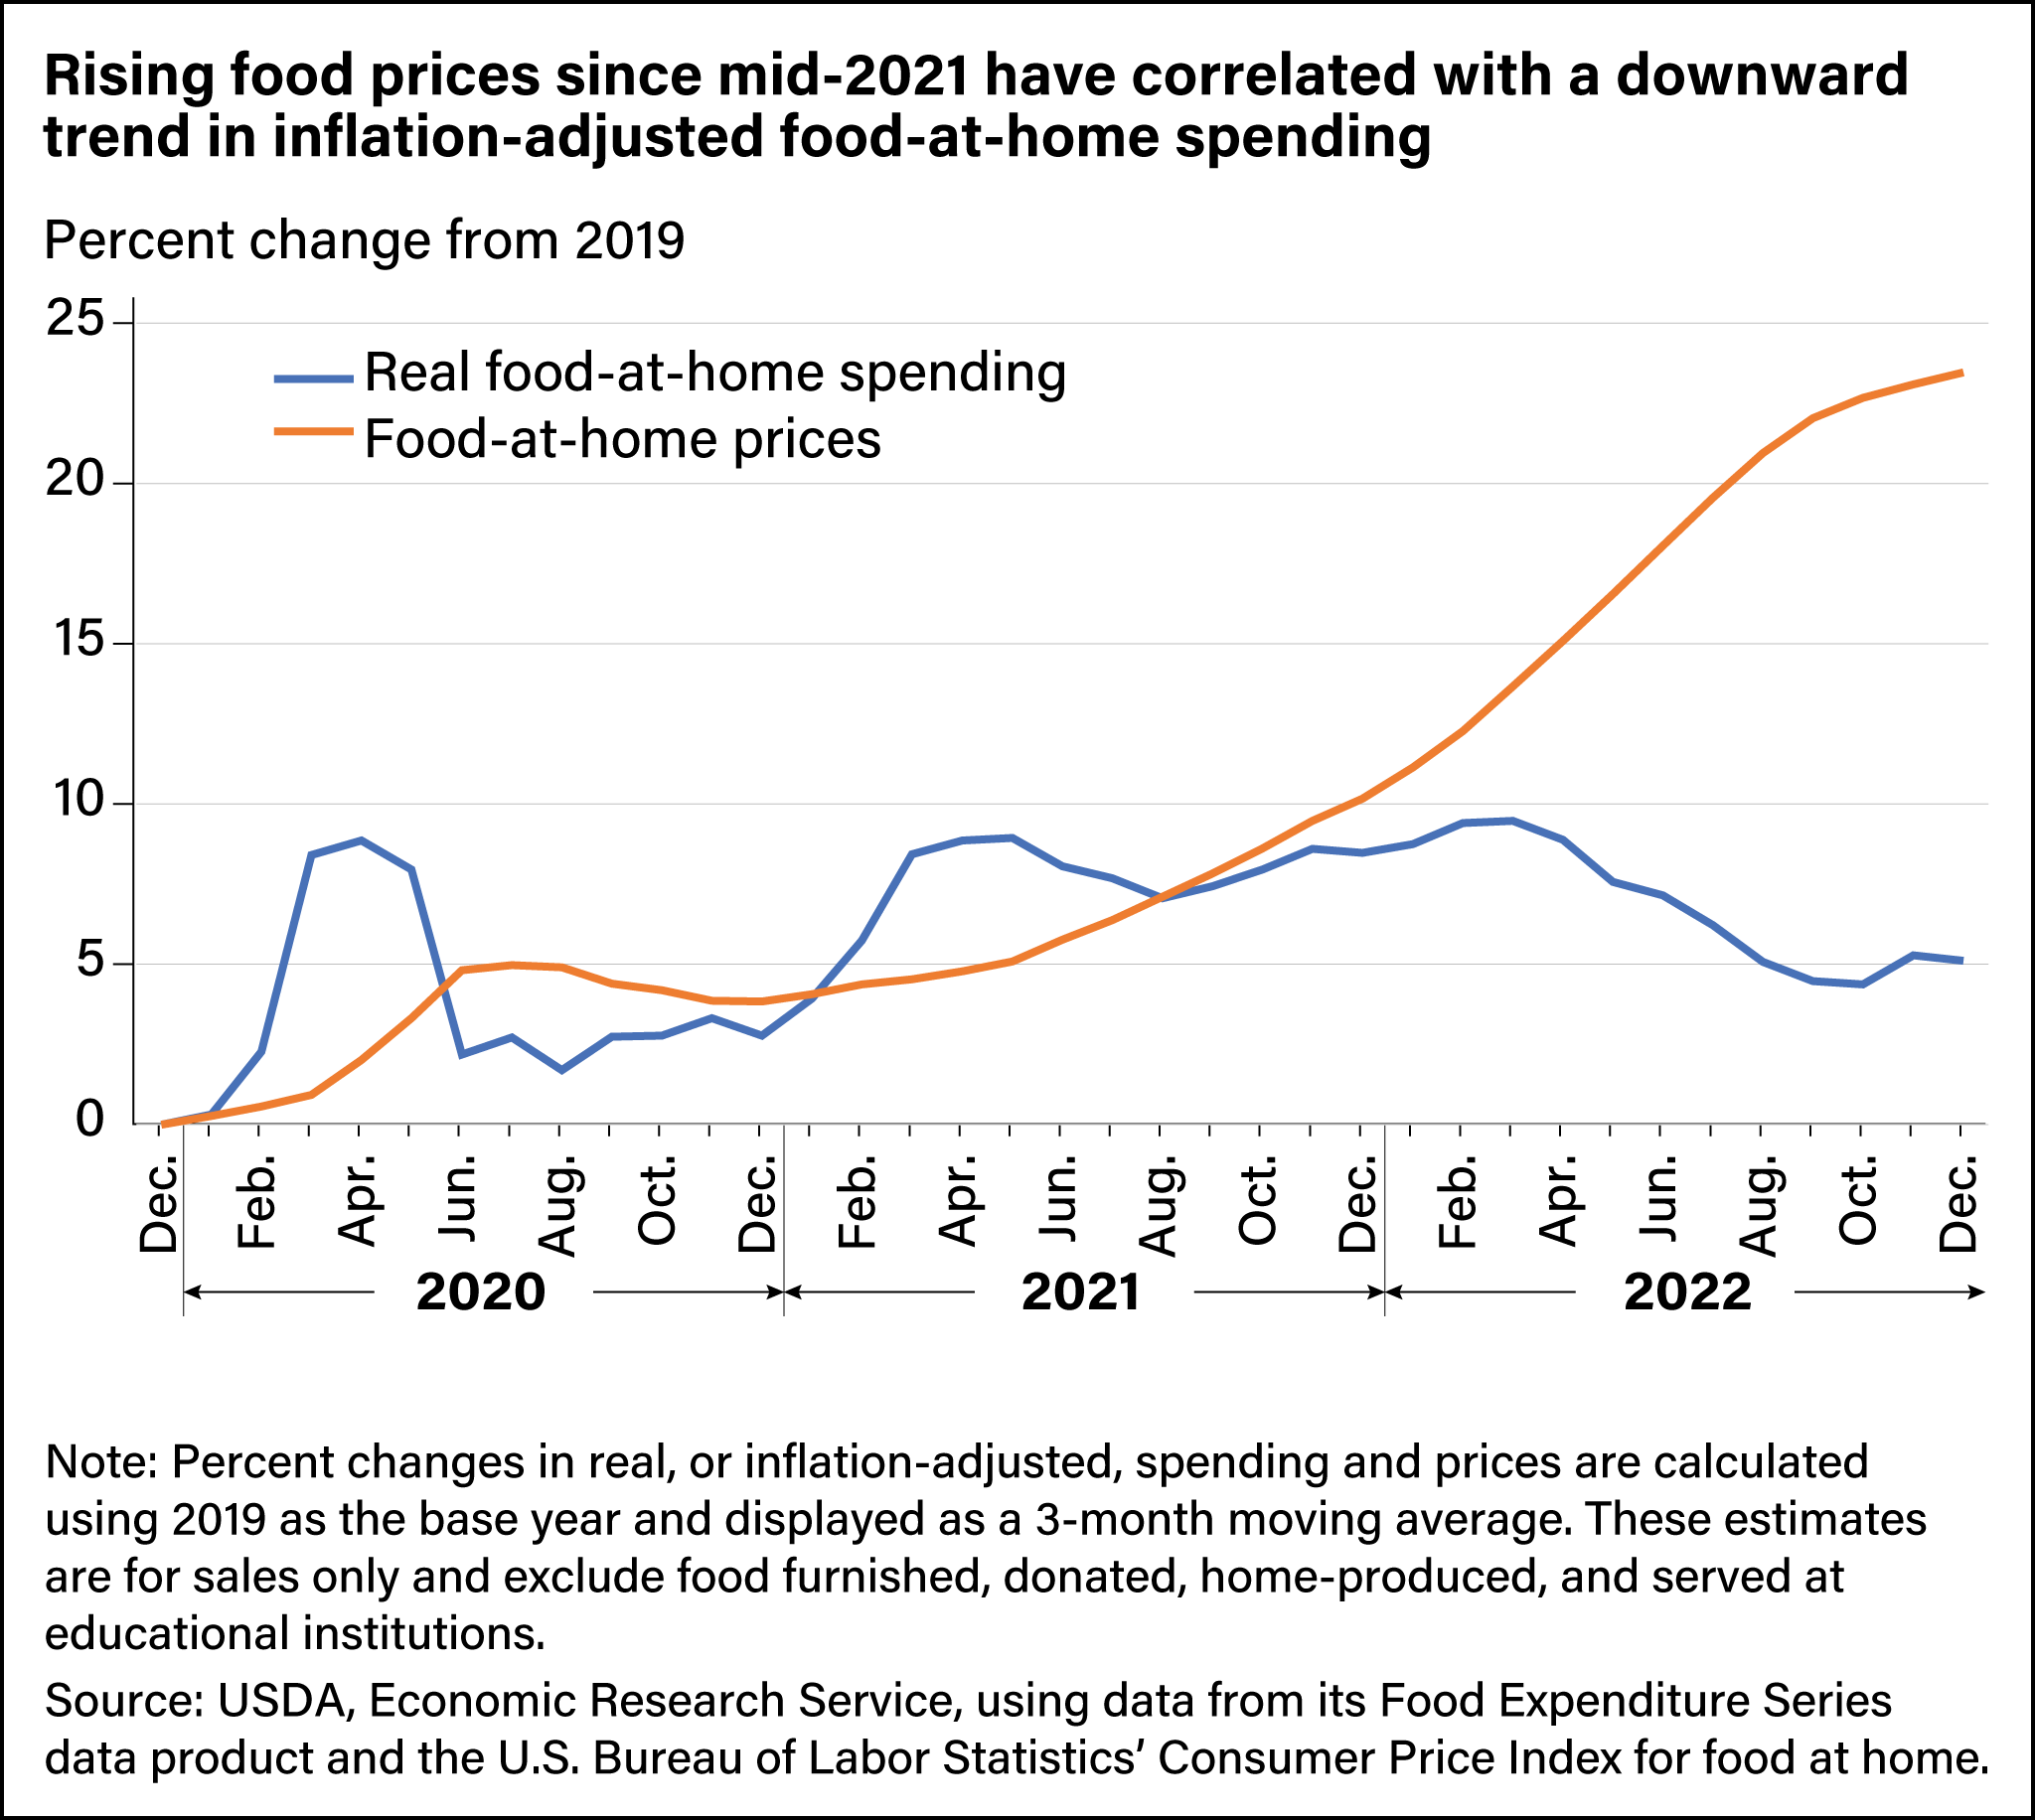
Without adjusting for inflation, food prices and spending rose considerably from 2020–22. The ERS Food Expenditure Series data product shows that inflation-adjusted, or real, FAH spending also increased in 2020 and the first half of 2021, driven largely by pandemic-related restaurant restrictions and health concerns that shifted consumer spending from food away from home (FAFH) to FAH. However, as FAH prices and nominal (not inflation-adjusted) average monthly FAH spending rose by 11.4 percent and 9.8 percent in 2022, respectively, real spending on FAH trended downward, falling 1.4 percent from 2021. Even so, food spending remained above 2019 levels throughout the year.
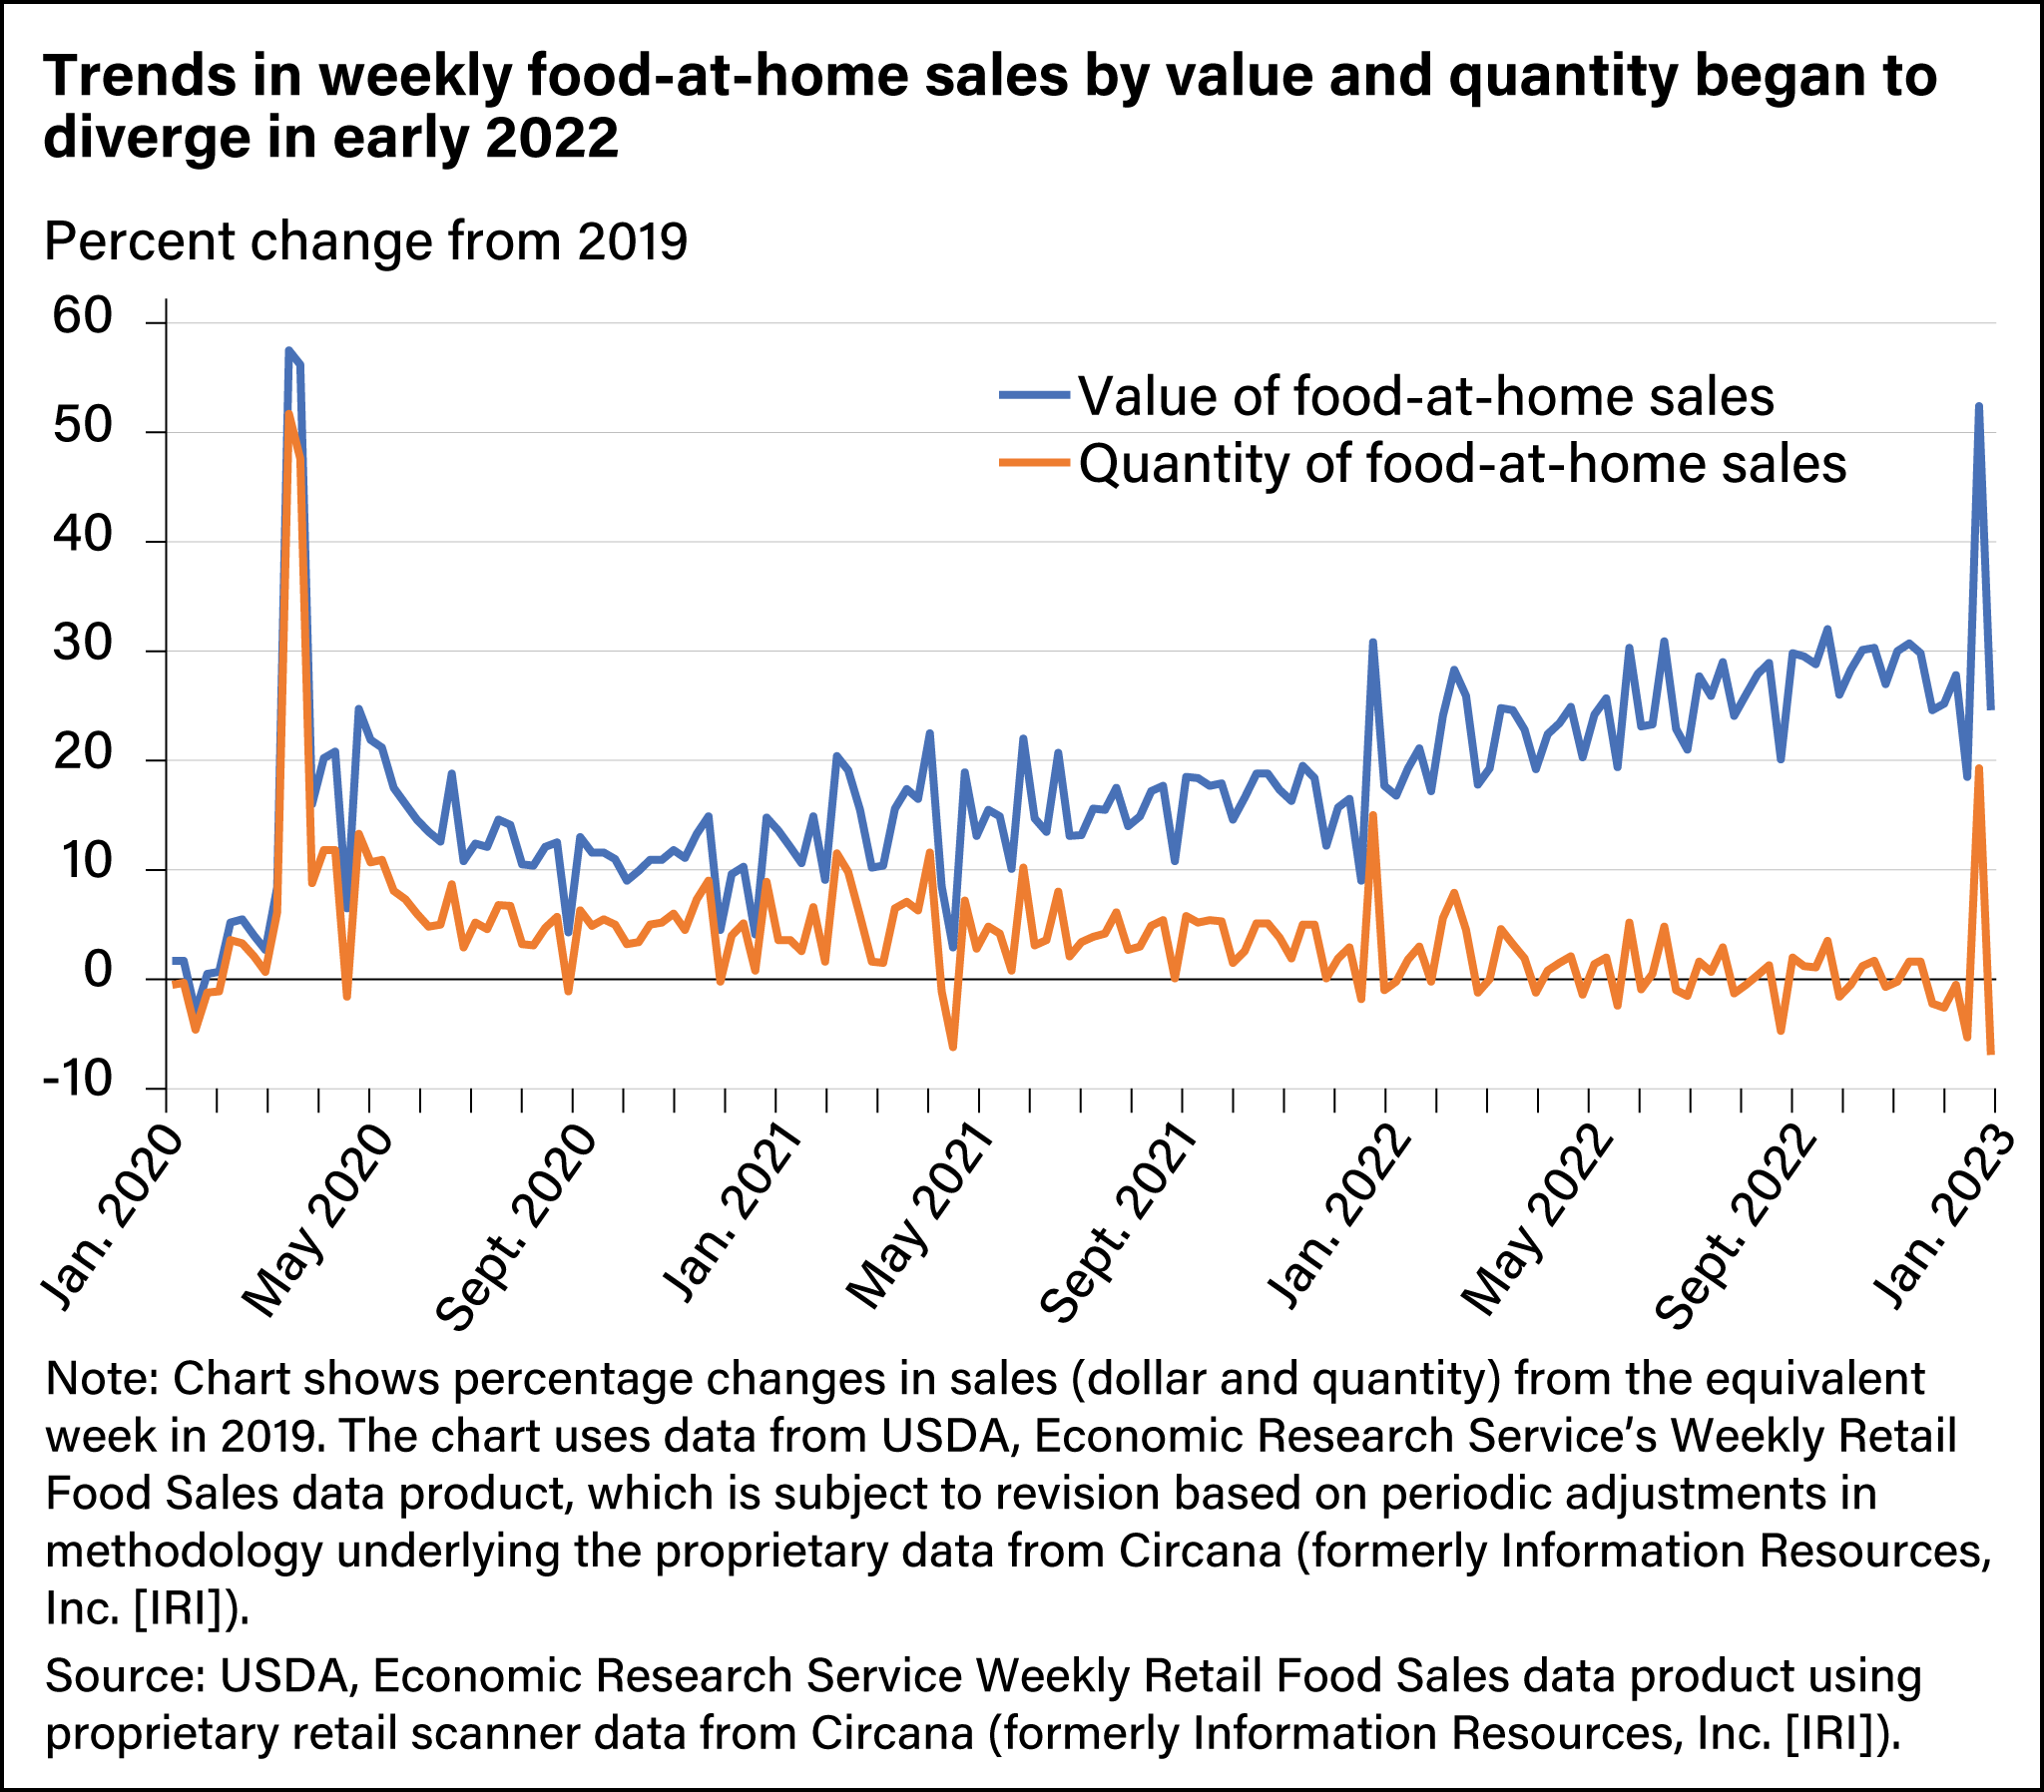
Changes in consumer behavior and demand likely led to the increase in real food spending in 2022 compared with 2019. For instance, U.S. consumers may have chosen more expensive products, such as precut vegetables and fruits, organic products, prepared dishes, and imported out-of-season foods. They may also have bought more groceries than they did in 2019. The ERS Weekly Retail Food Sales data product shows that increases in the quantity of FAH purchases by U.S. households were broad-based in 2020, as retail sales units rose across all major categories. Overall, the FAH sales quantities in 2022 declined from 2020 and 2021 but remained slightly higher than 2019. Consumers continued to buy more beverages, fruits, vegetables, and other foods than in 2019, but smaller amounts of sugar and sweeteners, dairy, meats, eggs, nuts, and commercially prepared items. However, unit quantity sales do not capture if consumers made changes in response to rising prices such as switching to more economical products or buying larger package sizes.
Although households shifted spending from FAFH to FAH early in the pandemic, households maintained higher real spending and purchased slightly larger quantities of FAH in 2022 even as real FAFH spending exceeded prepandemic levels and resumed its growth trend from the previous decade.
Industries Along the Food Supply Chain Impact Retail Food Prices
Many supply-side factors contribute to retail food costs and influence food price changes. Retail food prices include the many costs associated with transforming agricultural commodities into food products. Farmers typically hire workers and bear the cost of inputs such as land, seeds, fertilizer, and machinery. Raw agricultural commodities then are processed, packaged, and transported. Services along the supply chain, such as retail and wholesale trade and advertising, ensure the timely and efficient distribution of products.
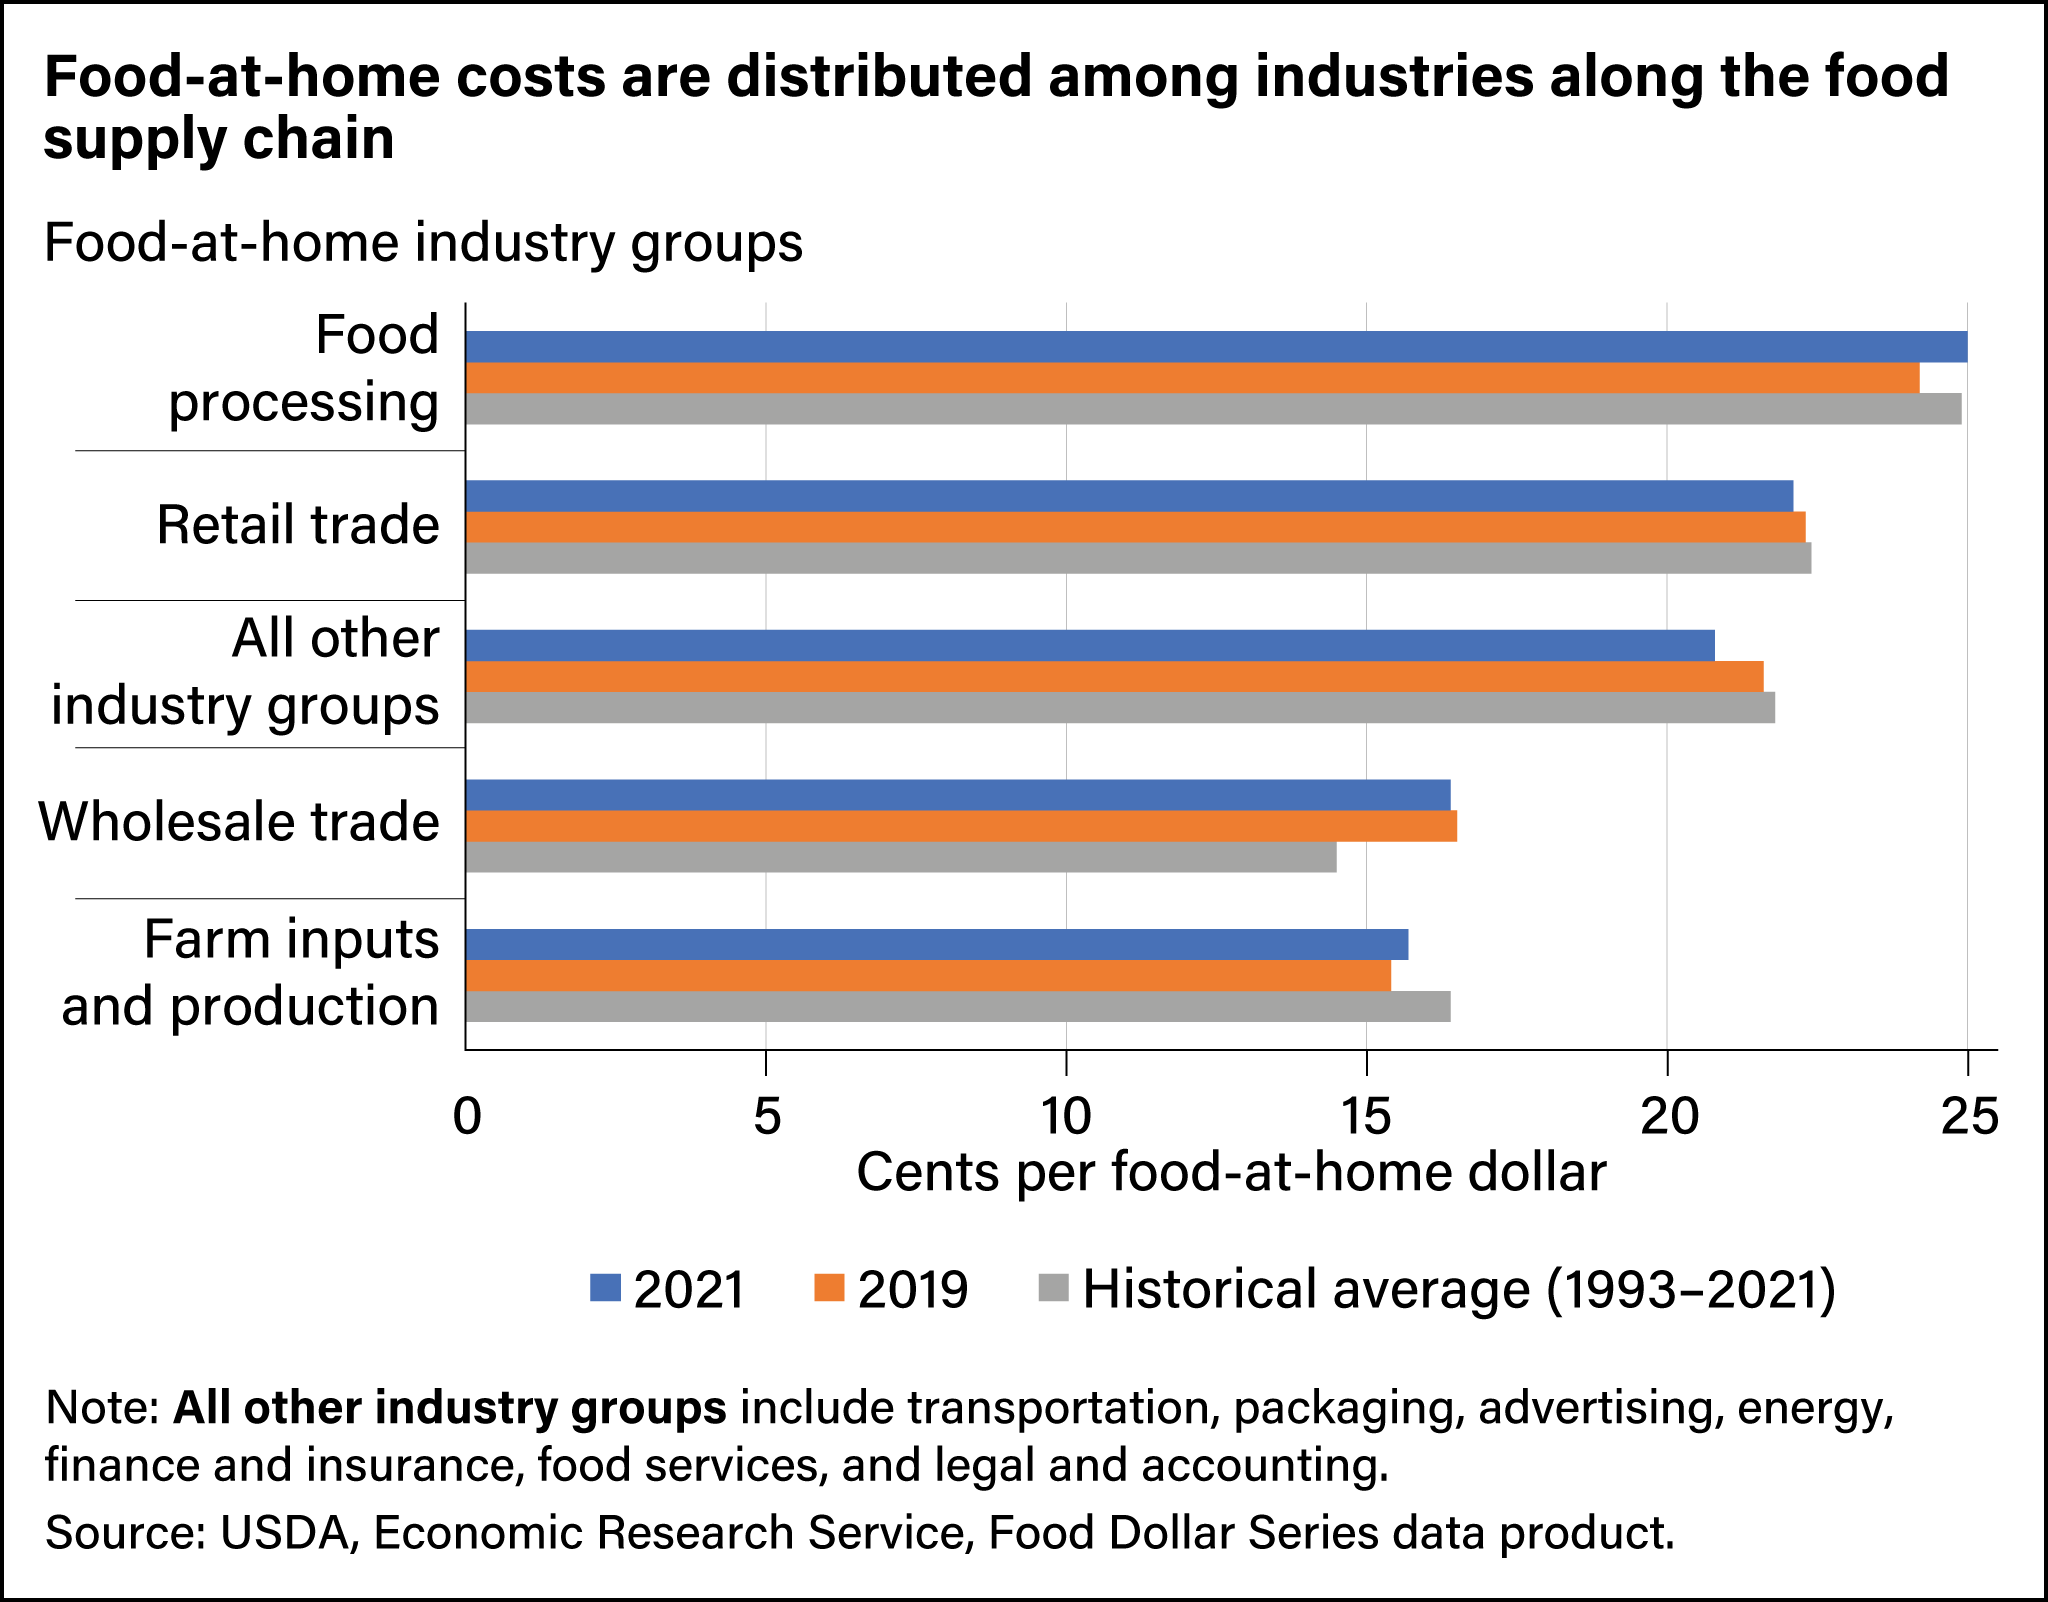
The ERS Food Dollar Series data product estimates the relative contribution to retail food prices of 12 industry groups in the food supply chain: agribusiness; farm production; food processing; packaging; transportation services; energy; wholesale trade; retail trade; foodservices; finance and insurance; advertising; and legal and accounting services. The industries that contribute the highest shares of costs are relatively consistent across years, although shifts occur in their relative contributions. Food processing stands out as the most expensive step along the food-at-home production process. Firms responsible for processing agricultural commodities into foods accounted for 24.2 percent and 25 percent of total food-at-home costs in 2019 and 2021, respectively. Costs for processing increased after the pandemic’s onset as packinghouses and other types of facilities struggled to stay open and staffed. Costs for wholesaling and retailing together represented 38.8 percent of total costs in 2019 and 38.5 percent in 2021.
Agribusiness and farm production accounted for 15.7 percent of overall food-at-home production costs in 2021, an increase from 2019 but below the historic average of 16.4 percent. These two industry groups represent the share of production costs associated with farm commodity production, excluding on-farm costs paid to other industry groups. Intermediate steps such as packaging and transportation, as well as industries elsewhere along the production process, including finance and insurance, advertising, and legal and accounting, also contribute to total food-at-home production costs.
Because food processing, wholesaling, and retailing costs generally account for a larger share of food prices than farm inputs (agribusiness) and production, the relationship between retail food prices and what farmers receive for their commodities can be theoretically and statistically weak. The ERS Price Spreads from Farm to Consumer data product measures the difference between a food’s retail price and the value of the agricultural commodities used to produce it. For products that require less processing, such as Cheddar cheese and all-purpose white flour, farmers tend to receive a higher share of what consumers pay than in the case of more highly processed foods such as bread.
Retail prices for minimally processed foods also tend to move more closely with farm-level prices though still not in tandem. In theory, an increase in the value of the farm commodities in a food would increase retail prices by the same amount if all businesses along the supply chain passed the cost increase through to retail. In practice, as was the case for Cheddar cheese in 2022, marketers do not typically do so.
U.S. dairy product exports increased in 2022, buoying milk demand. Growth in milk supply was comparatively small. U.S. dairy farmers facing high costs for inputs including cows, feed, and fertilizer managed to increase their output by less than one-tenth of 1 percent in 2022, leaving milk processors and dairy product manufacturers to compete for limited supply. The farm price of milk hit an all-time high of $27.20 per hundred pounds in May 2022 ($8.10 higher than in May 2021). The farm value of the milk components in Cheddar cheese rose 31 percent in 2022, from $1.57 per pound to $2.06 per pound. Retail Cheddar cheese prices, meanwhile, rose a comparatively modest 6 percent, from $5.44 per pound to $5.76.
More highly processed products have even less of a connection between their farm and retail prices. The farm share for wheat producers of white bread has been around 5 percent in recent years, but the farm share for all-purpose white flour has exceeded 20 percent. The retail cost of both products might increase with the farm price of wheat. However, as payments to wheat growers represent a much smaller share of bread’s retail price, wheat price shocks have much less potential to be passed through to retail bread prices. For example, farm-level wheat prices rose 44.5 percent in 2021, but retail-level cereals and bakery products increased 2.3 percent. In 2022, however, prices for farm-level wheat grew 31.0 percent, and retail prices for cereals and bakery products rose 13.0 percent.

A Look Ahead to 2023
U.S. food prices grew volatile after the onset of the COVID-19 pandemic and increased rapidly in 2022 as economic conditions and consumer demand changed and external factors weighed on the food supply chain. U.S. households, which shifted spending patterns early in the pandemic, continued to buy higher quantities and different types of FAH in 2022 compared with 2019. Consumers responded to food price increases in 2022 with less real (inflation-adjusted) FAH spending in 2022 than in 2021 and 2020, but higher food prices still led to an increase in nominal (not adjusted for inflation) food-at-home expenditures. The ERS Food Price Outlook forecasts that food prices will grow more slowly in 2023 than in 2022 but remain above historical average rates. Higher food prices will continue to affect consumer budgets in 2023.
This article is drawn from:
- Food Price Outlook. (n.d.). U.S. Department of Agriculture, Economic Research Service.
- Food Expenditure Series. (n.d.). U.S. Department of Agriculture, Economic Research Service.
- Weekly Retail Food Sales. (n.d.). U.S. Department of Agriculture, Economic Research Service.
- Food Dollar Series. (n.d.). U.S. Department of Agriculture, Economic Research Service.
- Price Spreads from Farm to Consumer. (n.d.). U.S. Department of Agriculture, Economic Research Service.
You may also like:
- Chelius, C. & MacLachlan, M. (2021, March 1). Retail Food Price Inflation in 2020 Outpaced Historical Average by 75 Percent. Amber Waves, U.S. Department of Agriculture, Economic Research Service.
- Zeballos , E. & Sinclair, W. (2021, October 4). Food Spending by U.S. Consumers Fell Almost 8 Percent in 2020. Amber Waves, U.S. Department of Agriculture, Economic Research Service.
- Okrent, A., Elitzak, H., Park, T. & Rehkamp, S. (2018). Measuring the Value of the U.S. Food System: Revisions to the Food Expenditure Series. U.S. Department of Agriculture, Economic Research Service. TB-1948.
- MacLachlan, M., Chelius, C. & Short, G. (2022). Time-Series Methods for Forecasting and Modeling Uncertainty in the Food Price Outlook. U.S. Department of Agriculture, Economic Research Service. TB-1957.