Food Spending by U.S. Consumers Fell Almost 8 Percent in 2020
- by Eliana Zeballos and Wilson Sinclair
- 10/4/2021
The USDA, Economic Research Service’s (ERS) Food Expenditure Series (FES) provides a comprehensive measure of the total value of all food purchases in the United States. The series tracks spending on food intended to be prepared at home, such as from grocery stores, and food that is prepared away from home, such as at restaurants. The FES allows Government agencies, academic researchers, and industry stakeholders to assess and track developments in consumer food purchasing behaviors and the U.S. food supply.
In 2018, ERS researchers revised the FES, incorporating new source data and improved methods to provide more robust and timely annual estimates. The new series uses data from the Economic Census of the U.S. Department of Commerce, U.S. Census annual surveys, and other data from U.S. statistical agencies and trade associations to measure monthly and annual food spending in the United States. The FES has informed recent analyses of how food spending in the United States changes under economic shocks, such as the Great Recession of December 2007 to June 2009 and most recently the Coronavirus (COVID-19) Recession. ERS published the 2020 update to the FES in May 2021 and publishes monthly FES updates with data delayed by 2 months.
The Food Expenditure Series Reveals Changes in Food Spending Trends Over Time
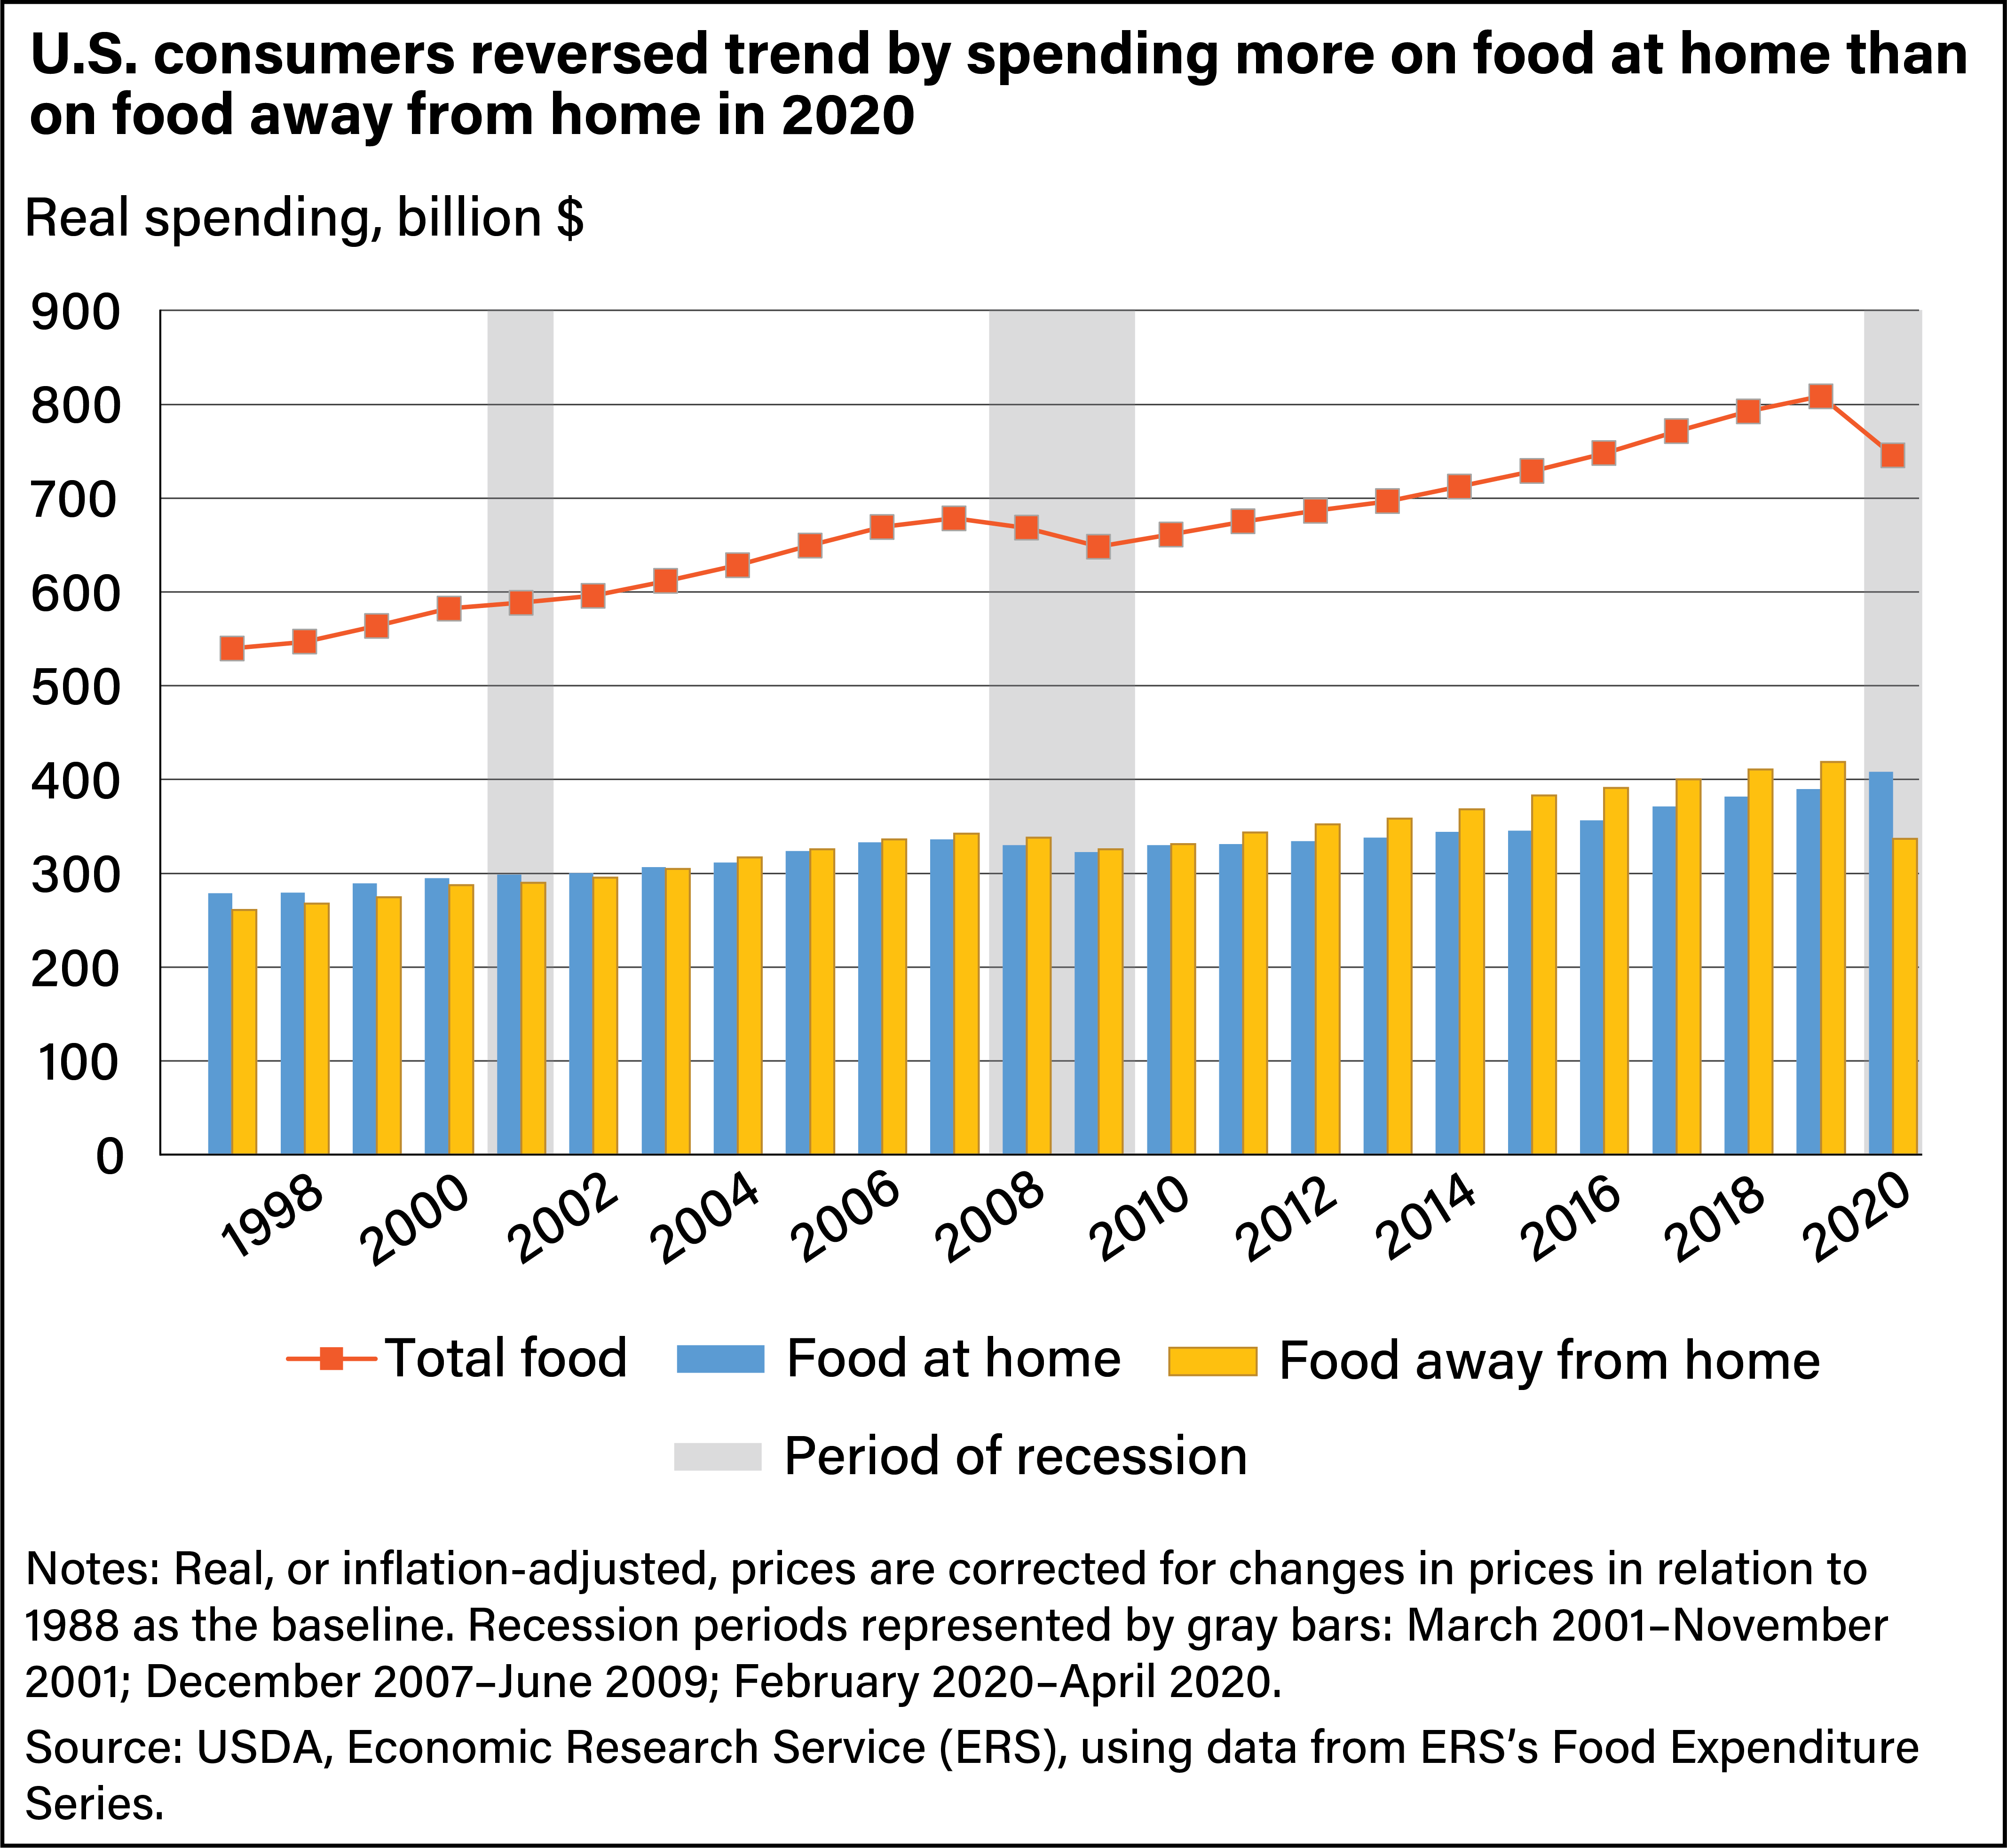
Real, or inflation-adjusted, annual food spending in the United States has increased every year since 1997 except in 2008, 2009, and 2020. Spending on food at home (FAH) and food away from home (FAFH) increased from 1997 to 2019, with real FAH increasing at a slower rate (39.7 percent) than for FAFH (60.5 percent).
In 2020, during the COVID-19 pandemic, real total food expenditures fell 7.8 percent from 2019. FAFH spending decreased by 19.5 percent, while FAH spending increased by 4.8 percent. The pronounced substitution from FAFH to FAH spending was the primary driver of the decrease in real total food expenditures in 2020. Consumption at FAFH establishments generally is a more expensive choice. As a comparison, real total food expenditures during the Great Recession decreased by 1.5 percent in 2008 and 3.0 percent in 2009. FAFH spending fell 4.9 percent between 2007 and 2009, and, unlike the 2020 recession, FAH spending also declined (4.0 percent). In 2020, as in previous recessions, U.S. consumers shifted food expenditures to more cost-efficient FAH outlets instead of FAFH eating-out establishments. However, public health concerns associated with the pandemic led many FAFH establishments to operate at a limited capacity or cease operations, compounding the change in how consumers spent their food dollars.
FAH and FAFH Spending Shares Have Changed
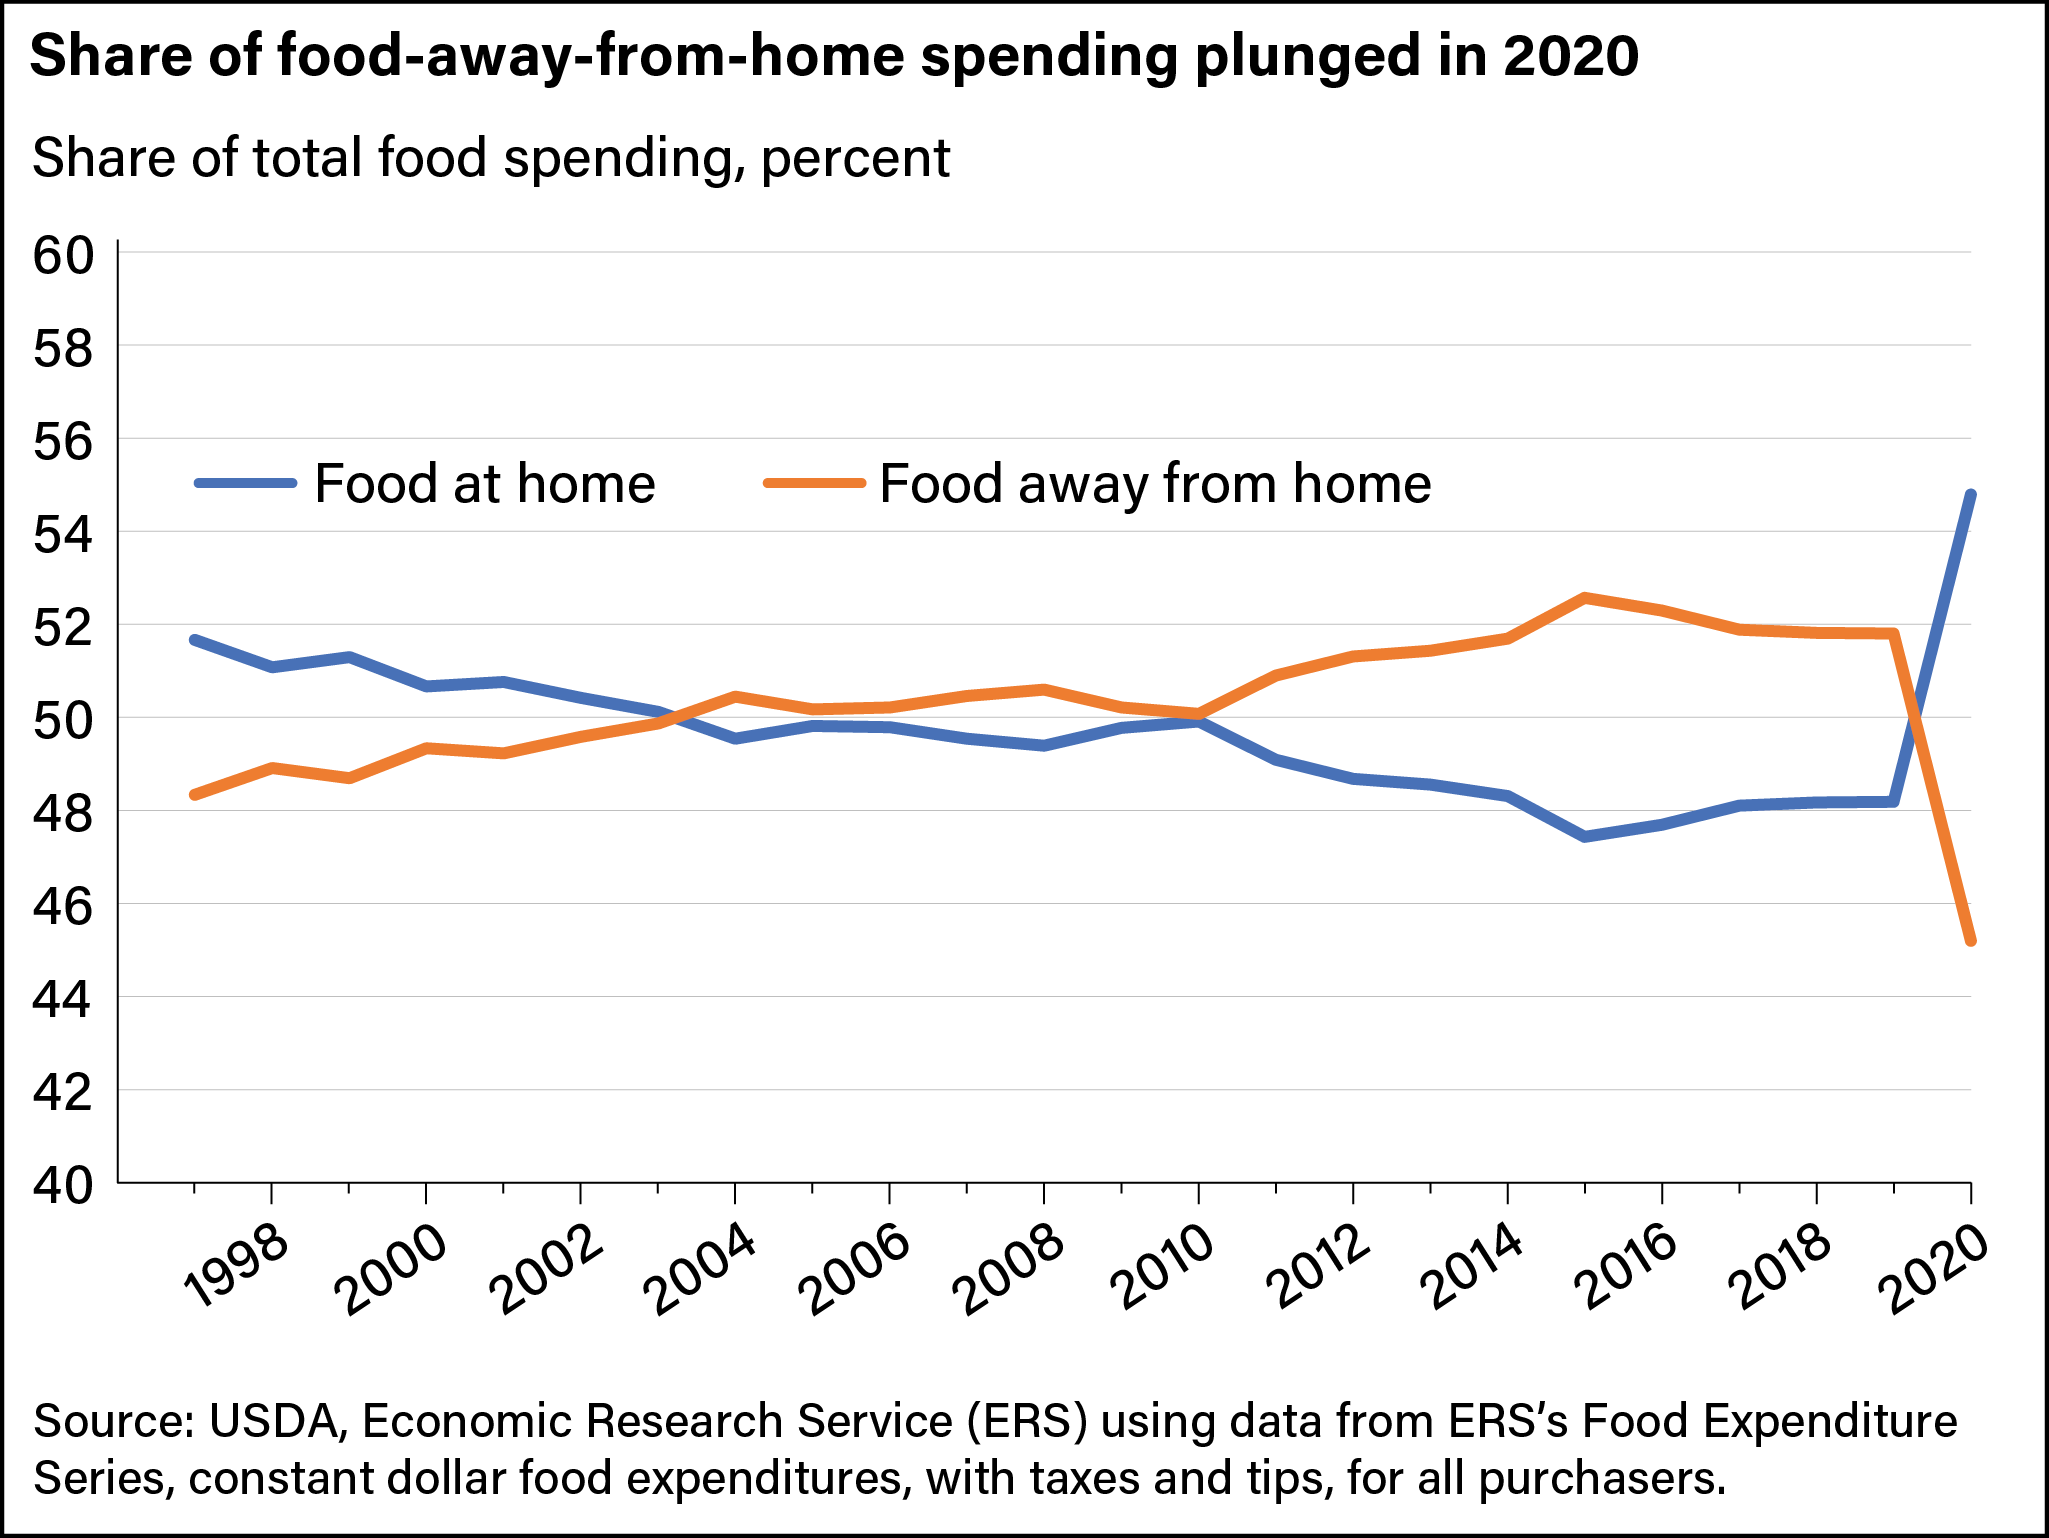
Real expenditures at FAFH establishments in 2019 accounted for 51.8 percent of total food spending, while the remaining 48.2 percent occurred at FAH outlets. Food expenditure shares are not proportionate to food quantities because food purchased away from home is generally priced higher than food prepared at home. FAFH outlets incur costs for the workers required to prepare and serve food, as well as for other overhead expenses such as for buildings, equipment, and utilities. The FAFH market has grown over the last two decades, except for slight decreases in the aftermath of the Great Recession in 2009 and 2010 (0.8 percent and 0.3 percent, respectively). And in 2020, the share of FAFH spending decreased 12.8 percent from the previous year, the first time it accounted for less than half of total food spending since 2003.
Consumers Purchase Food to Prepare at Home from Various Outlets
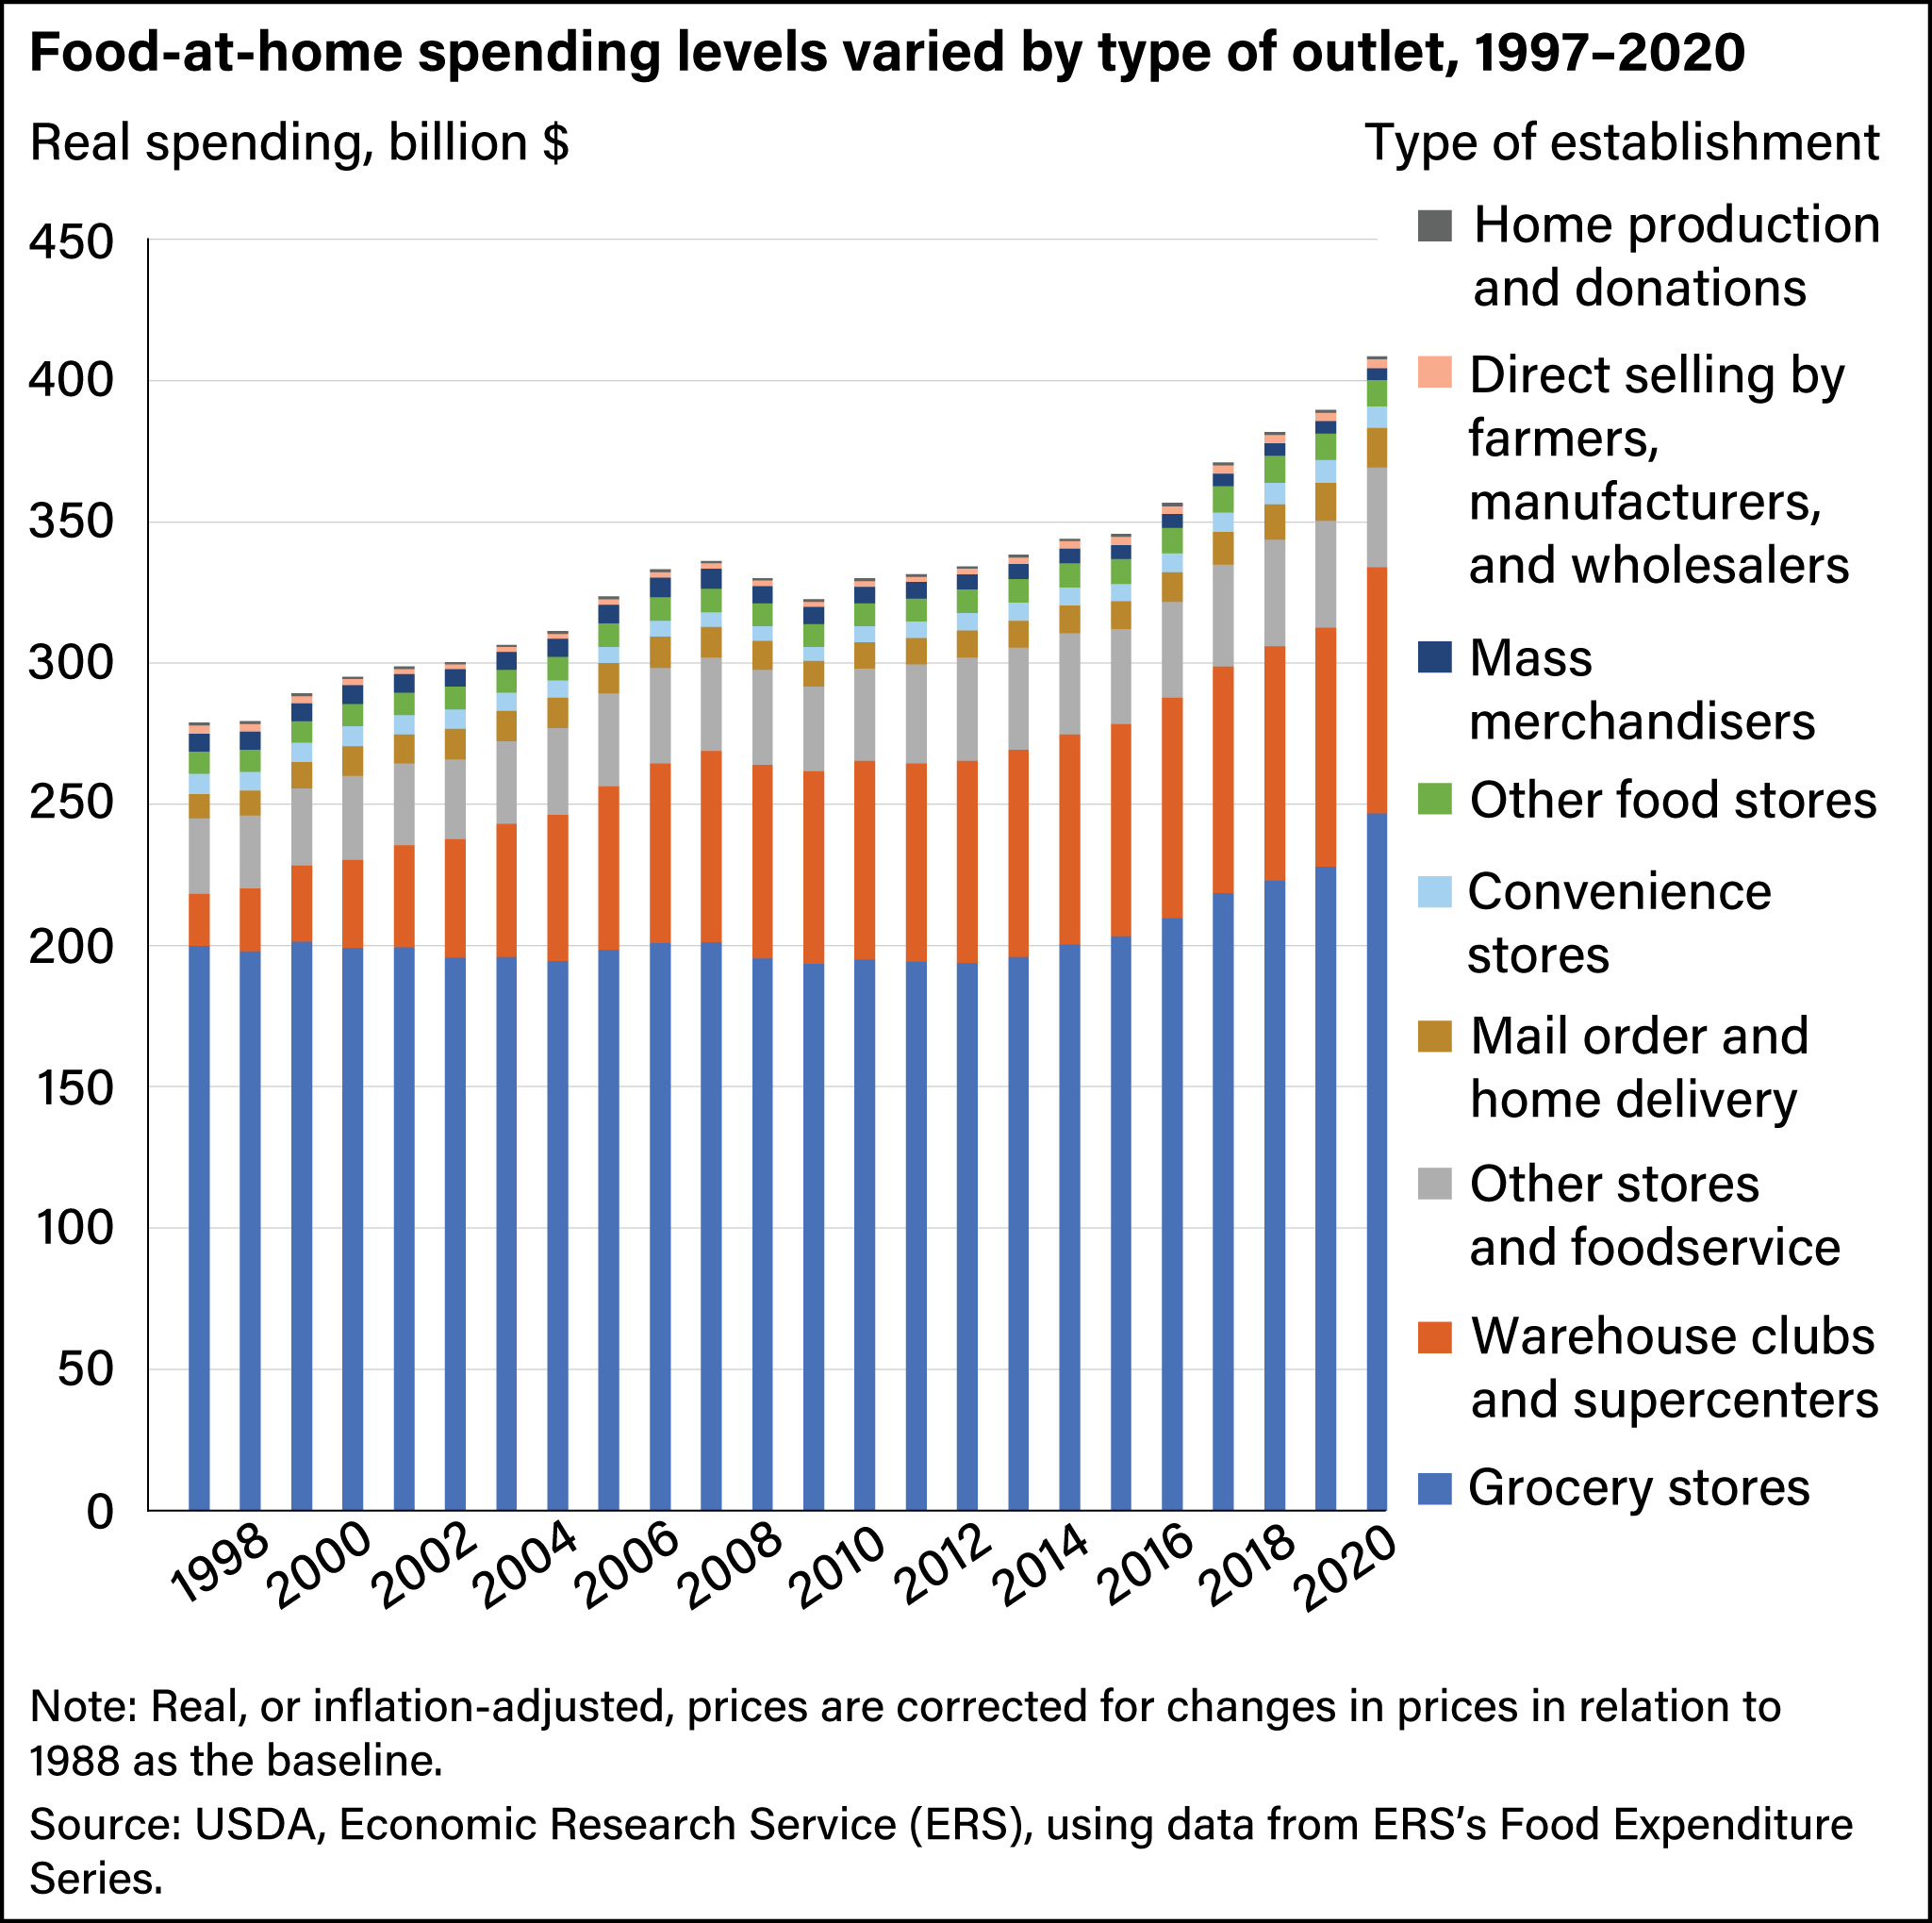
The FES tracks FAH expenditures at grocery stores; warehouse clubs and supercenters; other retail stores and foodservice; mail order and home delivery; convenience stores; other food stores; mass merchandisers; direct selling by farmers, manufacturers, and wholesalers; and home production and donations. Spending at grocery stores has accounted for the majority of FAH expenditures each year since 1997, but this share has steadily decreased from 71.6 percent in 1997 to 58.5 percent in 2019, and then increased to 60.4 percent in 2020. Expenditures at warehouse clubs and supercenters, retailers that often offer customers bulk items at discounted prices, contributed the second most to FAH spending. Warehouse clubs and supercenters increased their market share from 6.6 percent in 1997 to 21.4 percent in 2020. Collective expenditures at mail-order retailers, convenience stores, mass merchandisers, direct purchases from producers, home production or donations, and other FAH outlets accounted for 21.7 percent of real FAH spending in 1997. This share decreased to 19.8 percent in 2019 and further declined in 2020 to 18.2 percent.
The pandemic disrupted how U.S. consumers bought food across several different fronts. The 4.8-percent increase in FAH spending in 2020 was largely driven by sales at grocery stores, which saw an 8.2-percent increase in 2020 compared with 2019. Spending at warehouse clubs and supercenters increased 3.1 percent in 2020. Spending at mail-order food providers, which allow consumers to avoid interpersonal contact throughout the purchasing process, increased 4.5 percent (does not include online shopping at grocery stores). Spending on direct purchases from producers (farmers, manufacturers, and wholesalers) and home production increased by 11.1 and 0.6 percent, respectively. Three FAH outlet categories saw decreases in real expenditures in 2020: mass merchandisers such as dollar stores or general stores (8.8 percent), convenience stores (6.0 percent), and other retail stores and foodservice (6.7 percent).
Consumers Also Purchase FAFH from Different Outlet Types
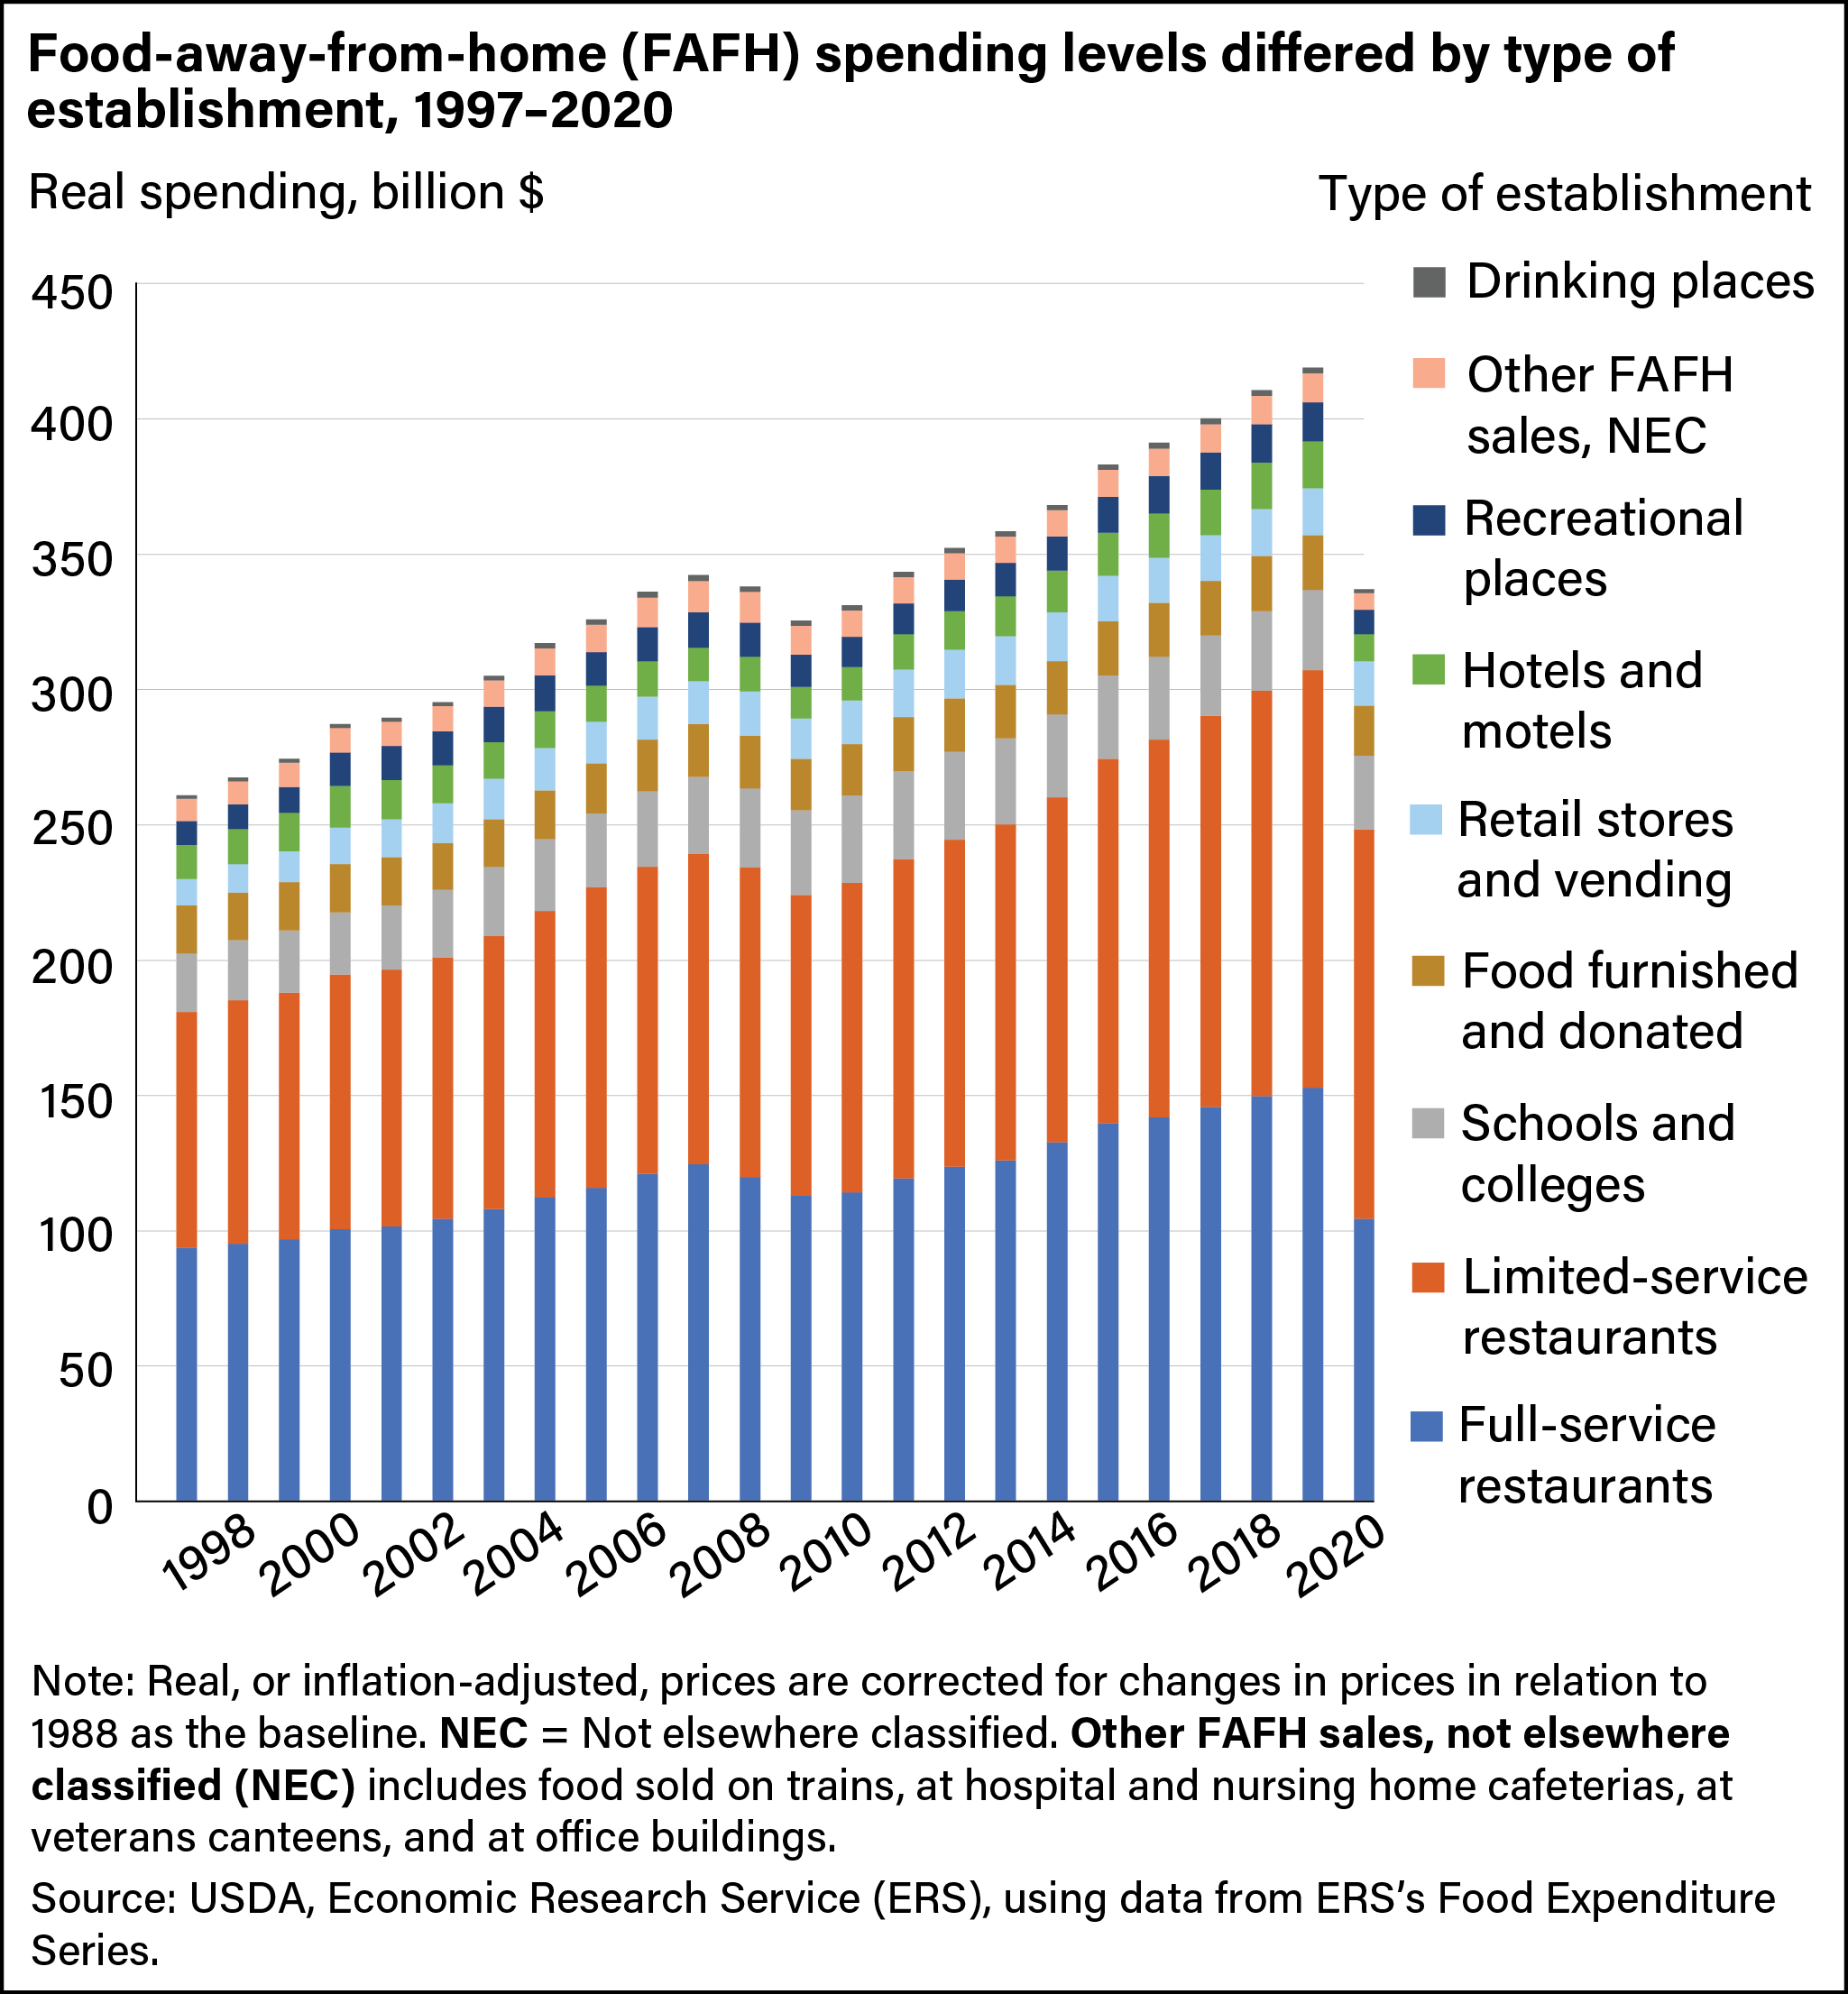
The FES tracks FAFH expenditures at full-service restaurants, limited-service restaurants, schools and colleges, food furnished and donated, retail stores and vending machines, hotels and motels, recreational places, and drinking places, as well as an “other” category that includes food sold on trains, at hospital and nursing home cafeterias, at veterans canteens, and at office buildings. From 1997 to 2020, an annual average of 70 percent of all FAFH purchases occurred at full-service or limited-service restaurants, with full-service taking up a higher share in all years except 2010 and 2020. Full-service restaurants’ share of the food-away-from-home market rose from 35.9 percent in 1997 to 36.5 percent in 2019, while limited-service restaurants posted a larger increase in market share from 33.4 to 36.8 percent over the same period. The share of food-away-from-home expenditures occurring at hotels and motels, as well as at schools and colleges, declined between 1997 and 2019, while the shares at recreational places and retail stores and vending machines increased slightly.
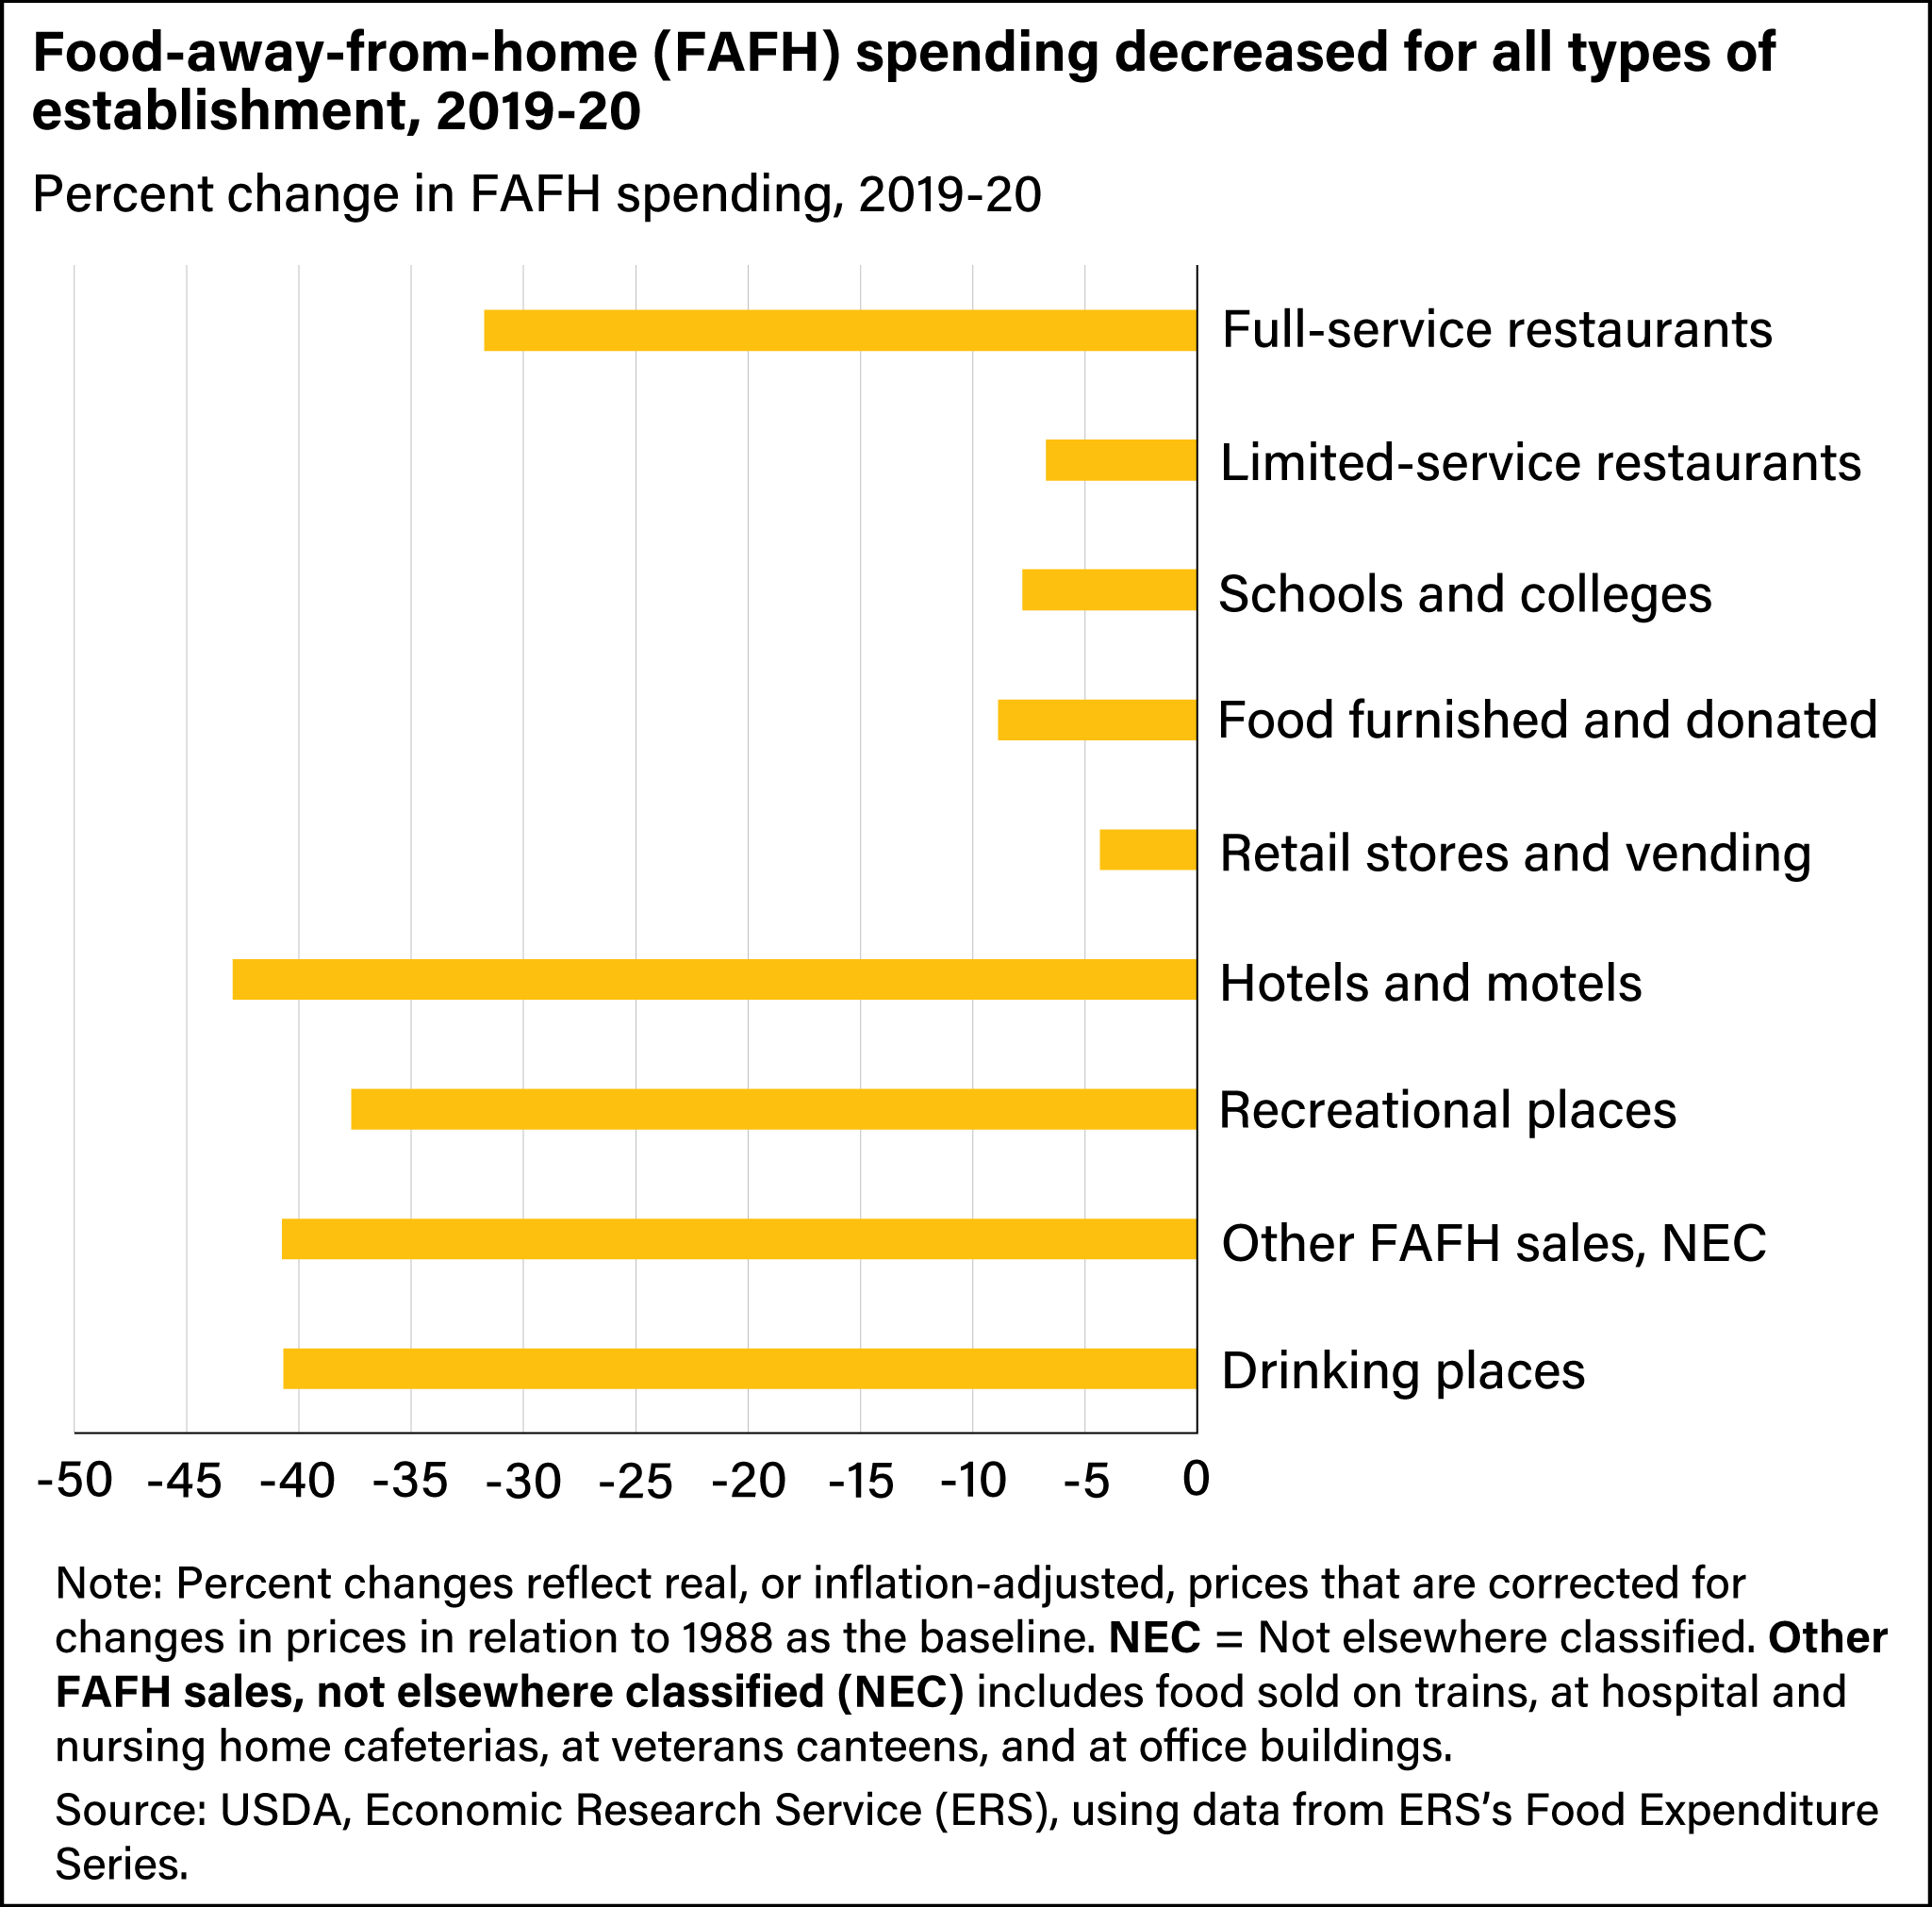
Each of the nine FAFH categories saw decreased spending levels in 2020 compared with 2019. Limited-service restaurants benefited from being able to adapt to pandemic safety measures, but retailers in this category still saw a 6.7-percent decrease in annual spending at their outlets. Full-service restaurants, which accounted for more FAFH spending than all other outlets from 1997 to 2019, experienced a decrease of 31.7 percent in 2020 partly because of closures for safety from the pandemic during some of the year. Hotels and motels, recreational places, and drinking places also experienced pandemic-related closures and capacity restrictions throughout much of 2020. As such, food spending at hotels and motels decreased by 42.9 percent, at recreational places by 37.7 percent, and at drinking places by 40.7 percent. Food expenditures at schools and colleges saw a decrease of 7.8 percent.
This article is drawn from:
- Food Expenditure Series. (n.d.). U.S. Department of Agriculture, Economic Research Service.
You may also like:
- Okrent, A., Elitzak, H., Park, T. & Rehkamp, S. (2018). Measuring the Value of the U.S. Food System: Revisions to the Food Expenditure Series. U.S. Department of Agriculture, Economic Research Service. TB-1948.


