

U.S. Food-Related Water Use Varies by Food Category, Supply Chain Stage, and Dietary Pattern
Highlights:
-
The U.S. food system, which provides the majority of domestically purchased foods and beverages, requires about one-third of the Nation’s total freshwater use.
-
Crop production uses over half of the water for food, while later supply chain stages also require a substantial amount of water.
-
Freshwater usage varies by the food categories that make up U.S. diets. If the U.S. population were to adopt healthier dietary patterns, food-system water use could substantially increase or decrease, depending on the dietary patterns realized.
Water is a key input for food production. It is used on farms to grow crops, raise livestock, clean processing equipment, generate electricity, and rinse produce. While water is important, available freshwater for human use is scarce. Much like other natural resources, freshwater is faced with supply and demand stresses, including population growth, climate change, and changing consumer preferences.
A recent USDA, Economic Research Service (ERS) study developed a data system and model that considers water use throughout the U.S. food system over 4 recent years (1997, 2002, 2007, and 2012). It specifically considers freshwater withdrawals from groundwater and surface water sources, also called blue water. The model does not measure other types of water, such as rainwater in crop production or saltwater for thermoelectric power generation. This work builds on the authors’ previous work that explored dietary patterns’ effect on food system water use. These studies found that the U.S. food system requires a substantial amount of water, mostly in the agricultural production supply chain stages (crop and livestock production). These studies found variations in the amount of water associated with different food categories, as well as tradeoffs in food system water usage among healthier dietary patterns.
Estimating the Water Requirements of the U.S. Food System
ERS researchers defined the U.S. food system as those involved, both directly and indirectly, in producing and marketing foods and beverages through points of purchase for both food at home (such as purchases at grocery stores or supercenters) and food away from home (such as purchases at sit-down restaurants or fast-casual establishments). The studies, unlike many others, include household kitchen operations, kitchen faucet water, and food-at-home acquisition trips, such as driving to the grocery store. The model results are based on the types and quantities of food demanded in the United States, as well as the water requirements to produce this mix of foods and beverages.
The scope of the studies is U.S. production for U.S. consumption since most foods and beverages are domestically produced and marketed. Water for fuel or fiber production and water for exports are outside of the scope of these studies. Direct and indirect water use in countries of origin for imported food and other imported goods used in domestic food production, such as fertilizers used by U.S. vegetable growers, is also excluded. However, the water used to transport and market these imported goods after entering the country is included.
The researchers build upon the ongoing efforts at ERS to develop a Food Environment Data System to serve as platform for several models, including an environmental input-output model. This is a national economy-wide model developed to track resources (such as gallons of freshwater) throughout the economy used by different industries. This approach allows for a comprehensive measurement of direct and indirect water used in the food system, also called embodied water. Consider a hamburger, for example. In cattle production, water is used for the animals' drinking and servicing needs, and water is also used to irrigate the crops that ultimately become livestock feed. Additional water is used in supply chain stages further downstream, such as to clean equipment at the processing plants and for electricity generation to keep beef products refrigerated. The total farm-to-fork water requirements of the hamburger are included in the estimates.
Four years are included in the analysis based on the most current data available. The U.S. Geological Survey publishes U.S. water withdrawal data that are linked to the closest year of economic data. A primary data source with sufficient detail for this work, the 2012 National Benchmark Make and Use Tables, was published in 2018 by the U.S. Department of Commerce, Bureau of Economic Analysis. Since the detailed Benchmark data are released more than 5 years after the data are collected, ERS is developing a method of using other economic data to facilitate analysis with more recent data. All other non-Benchmark data sources currently available would allow for estimates of water usage for 2017.

Annual domestic food system water use varied among the years studied. Water used for food production totaled 39 trillion gallons in 1997, then rose to 43 trillion gallons in 2002, before decreasing in 2007 (36 trillion gallons) and 2012 (34 trillion gallons). The amount of water over the years studied is roughly the same volume as Lake Tahoe or enough water to fill 54 million Olympic swimming pools. The food system’s share of all water used throughout the U.S. economy ranged from a low of 28 percent in 2007 to a high of 34 percent in 2002.
The water data is further broken down by water source: groundwater, which comes from aquifers underground, and surface water, which comes from lakes, rivers, or streams. The U.S. food system relies more on surface water than groundwater, even more so than the U.S. economy as a whole.
Water Use Varies Across Supply Chain Stages, But Are Mostly Consistent Over Time
The domestic food system water usage was examined at each supply chain stage for each year studied. Crop production consistently used the most water, accounting for 63 percent of total water use in 2012. Livestock production had a growing share of total water use, while the processing and packaging stage and distribution and marketing stage both had small, steady shares of food system water use. Both households and energy used substantial shares of water. The energy category represents the water needed for the production of energy, such as cooling at thermoelectric plants. Various stages of the food supply chain make use of this energy for farm equipment fuel and electricity for lighting and refrigeration. There is an evident relationship between food, energy, and water; water is needed for energy production, and both water and energy are needed for food production. Households use the second-most amount of water, ranging from 16 percent in 2012 to 20 percent in both 1997 and 2007.

Water Use Varies by Food Categories
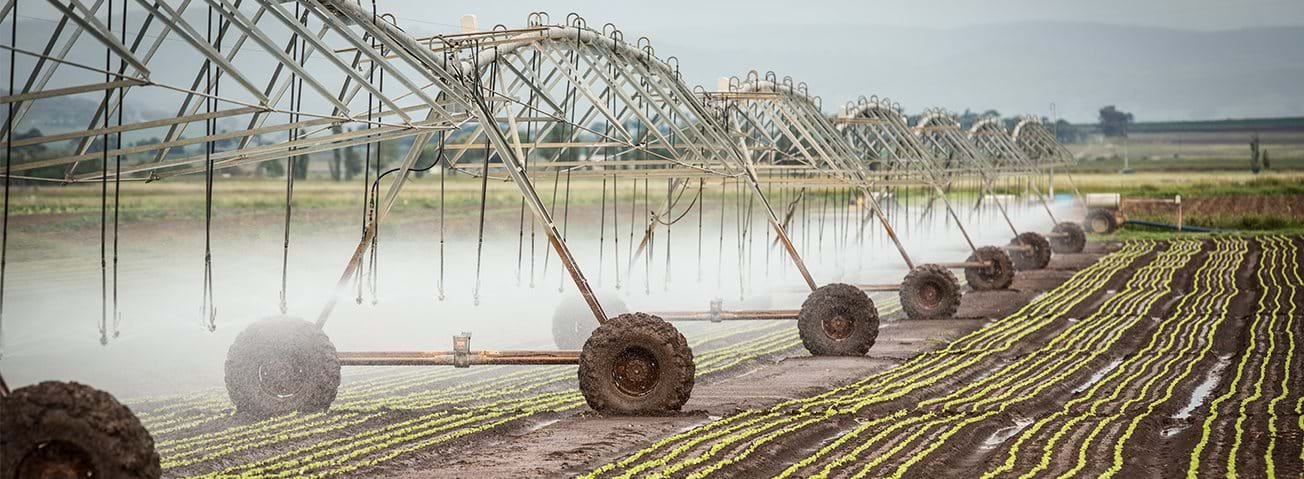
The analysis also breaks out food system water by food category. In the following results, the household stage is excluded since household water use cannot be attributed to individual food categories in an obvious, scientific way. In 2012, fresh vegetables used the most water throughout the supply chain stages at 5.1 trillion gallons or 21 percent. Fresh vegetables require a substantial amount of water, especially during critical times in their production. Fresh vegetables also have one of the highest proportions of irrigated production and water application rates compared to other crops that can be grown on dry land.

Other foods ranked second, a category that includes nuts, seeds, other snacks, and ready-to-eat or ready-to-heat foods. Other foods required 18 percent of food system water, roughly 4.5 trillion gallons annually. The beef, pork, and other meats category ranked third, using 2.5 trillion gallons of water in 2012, or 10 percent of the total.
As indicated earlier, the results are based on both the composition of foods demanded and the water requirements of production for the years studied. This does not necessarily mean that a fresh vegetable, such as a carrot, is more water-intensive when compared on an equal-mass basis to an individual item in a different category, such as cheese in the processed dairy category. Both the quantity and composition of food items purchased within these categories determine the amount of water use, in addition to the production practices and water use efficiency throughout the supply chain.
There are substantial water requirements of feed for the livestock that ultimately become animal-based food items. Of the 2.5 trillion gallons per year required to produce beef, pork, and other meat products in 2012, roughly the same amount of water was needed for livestock production as was needed for irrigating the crops that were ultimately fed to the livestock. Another animal-based category, poultry, required 964 billion gallons per year in 2012, and 12 percent of water was used at the livestock production stage, while 63 percent of water was needed at the crop production stage.
Water Use Tradeoffs Exist Between Different Dietary Patterns

In a 2018 study published in the journal Ecological Economics (see below), ERS researchers considered the foods and beverages consumed in 2007 by the average U.S. consumer. This dietary pattern, called the Baseline Diet, was far from the national dietary recommendations in the Dietary Guidelines for Americans, 2010. The average consumer was eating too many refined grains, saturated fats, and added sugars and not eating enough fruits and vegetables, according to these recommendations.
The Baseline Diet was defined by 4,000+ unique foods and beverages reported as consumed by the U.S. population in 2007, which were linked to 74 broad food categories and the 344 industry groups in the U.S. economy. The 2007 data were the most current at the time of the earlier study, given the release of the primary data source with sufficient detail for this work. Therefore, the Baseline Diet and scenarios represented the U.S. food demand, prices, and incomes in 2007. Because of the diet model construction, both the quantity and composition of the food items selected change within each food category to align with the Dietary Guidelines, each with a different water requirement ratio.
The ERS researchers modeled four alternative diet scenarios, all of which are compliant with healthy eating guidelines. The first two diet scenarios represent the shortest, least disruptive route to healthy diets from the Baseline Diet. One of these is an omnivore diet, which includes food from both animal and plant sources (Minimum Difference Healthy Omnivore), and the other is lacto-ovo vegetarian (Minimum Difference Healthy Vegetarian), which includes eggs and dairy products but no meat, poultry, or fish. These dietary patterns are based on the most common diets among U.S. consumers in 2007 who were eating in line with the Dietary Guidelines, and they are made up of many of the same popular food items. These diet scenarios come at a cost, however: If the U.S. population adopted either of these two diet scenarios, food system water usage would increase by 16 percent. With these two diet scenarios, there is evidence of tradeoffs between a healthier diet and food system water use.
The second two diet scenarios represent the potential for water savings from dietary changes by using the model to minimize food system water use. Specifically, these models use objective functions that select food commodities requiring the least amount of water while still meeting all dietary guidelines. Since there is no penalty in the objective functions from making large changes from the Baseline Diet, the model solutions can produce very large changes that may not reflect consumer tastes as represented in the Baseline Diet. Again, the researchers consider healthy omnivorous (Minimum Water Healthy Omnivore) and vegetarian (Minimum Water Healthy Vegetarian) diets. These diets show a substantial decline in embodied water: a 63-percent decline for the omnivore diet and a slightly larger decline of 66 percent for the vegetarian diet. To put the decline in water use in context, if the U.S. population changed their diets such that the minimum water diet scenarios became the new national average and the food system used the same volume of water (on a per-gram basis) for each of the 4,000+ unique foods and beverages consumers choose from, the daily water savings would be between 48.9 to 51.1 billion gallons, roughly the equivalent of between 74,000 to 78,000 Olympic-sized swimming pools.
If the U.S. population were to adopt any of these four alternative, healthy diets, water use would be impacted. However, the water savings diet scenarios result in a much larger change, particularly in the direction of water conservation. Whether the healthy diet includes meat, poultry, and fish products does not have a large impact on total water embodied by the diets; the omnivorous and vegetarian results were similar.
These findings inform policymakers and the research community about the domestic water resources needed to meet U.S. food demand and may provide insights to consumers on the impacts of their consumption choices. As evidenced by ERS’s dietary scenarios, there is a potential to eat healthier food while also saving water, ultimately resulting in a more sustainable U.S. food system.
Tracking the U.S. Domestic Food Supply Chain’s Freshwater Use Over Time, by Sarah Rehkamp, Patrick Canning, and Catherine Birney, ERS, July 2021
Measuring Embodied Blue Water in American Diets: An EIO Supply Chain Approach, by Rehkamp, S., and P. Canning, Ecological Economics, May 2018, https://doi.org/10.1016/j.ecolecon.2017.12.028
Resource Requirements of Food Demand in the United States, by Patrick Canning, Sarah Rehkamp, Claudia Hitaj, and Christian J. Peters, ERS, May 2020