
Global agricultural trade’s importance has increased over the last few decades, facilitated by technological changes, productivity gains, trade liberalization, and income growth.
More than one-third of the volume of global agricultural trade is concentrated among several large economies. The top five global importers of agricultural goods are China, the United States, the European Union (EU), the United Kingdom (U.K.), and Japan. The top five global exporters are the EU, the United States, Brazil, China, and Canada.
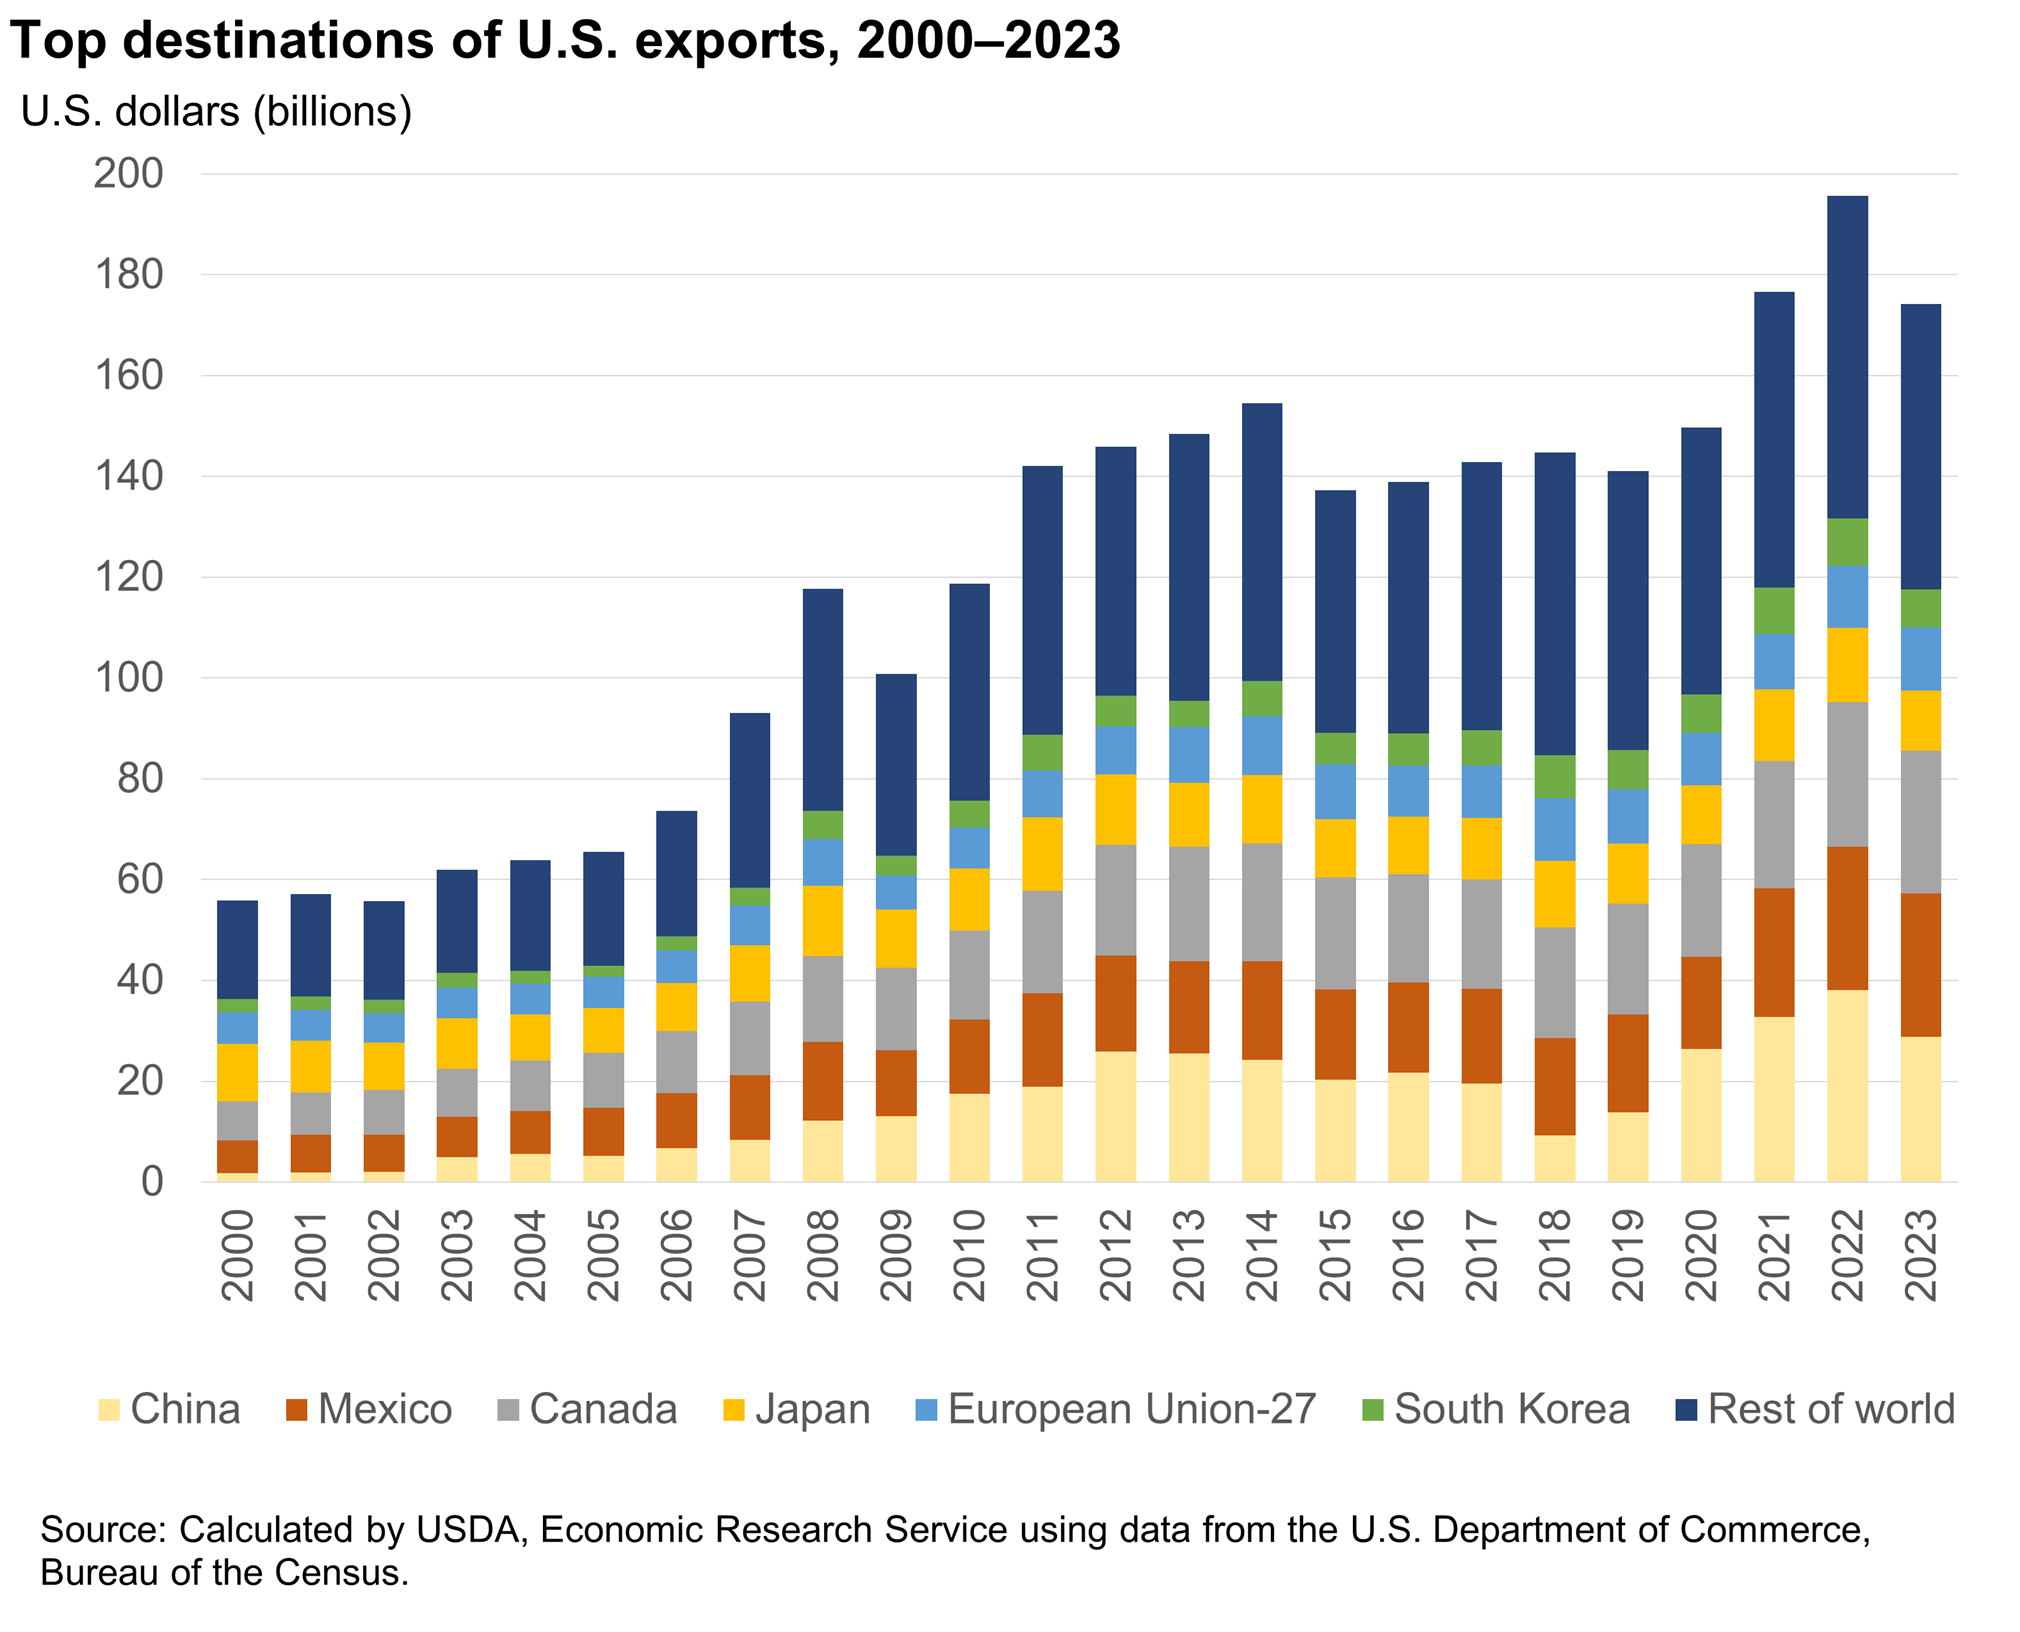
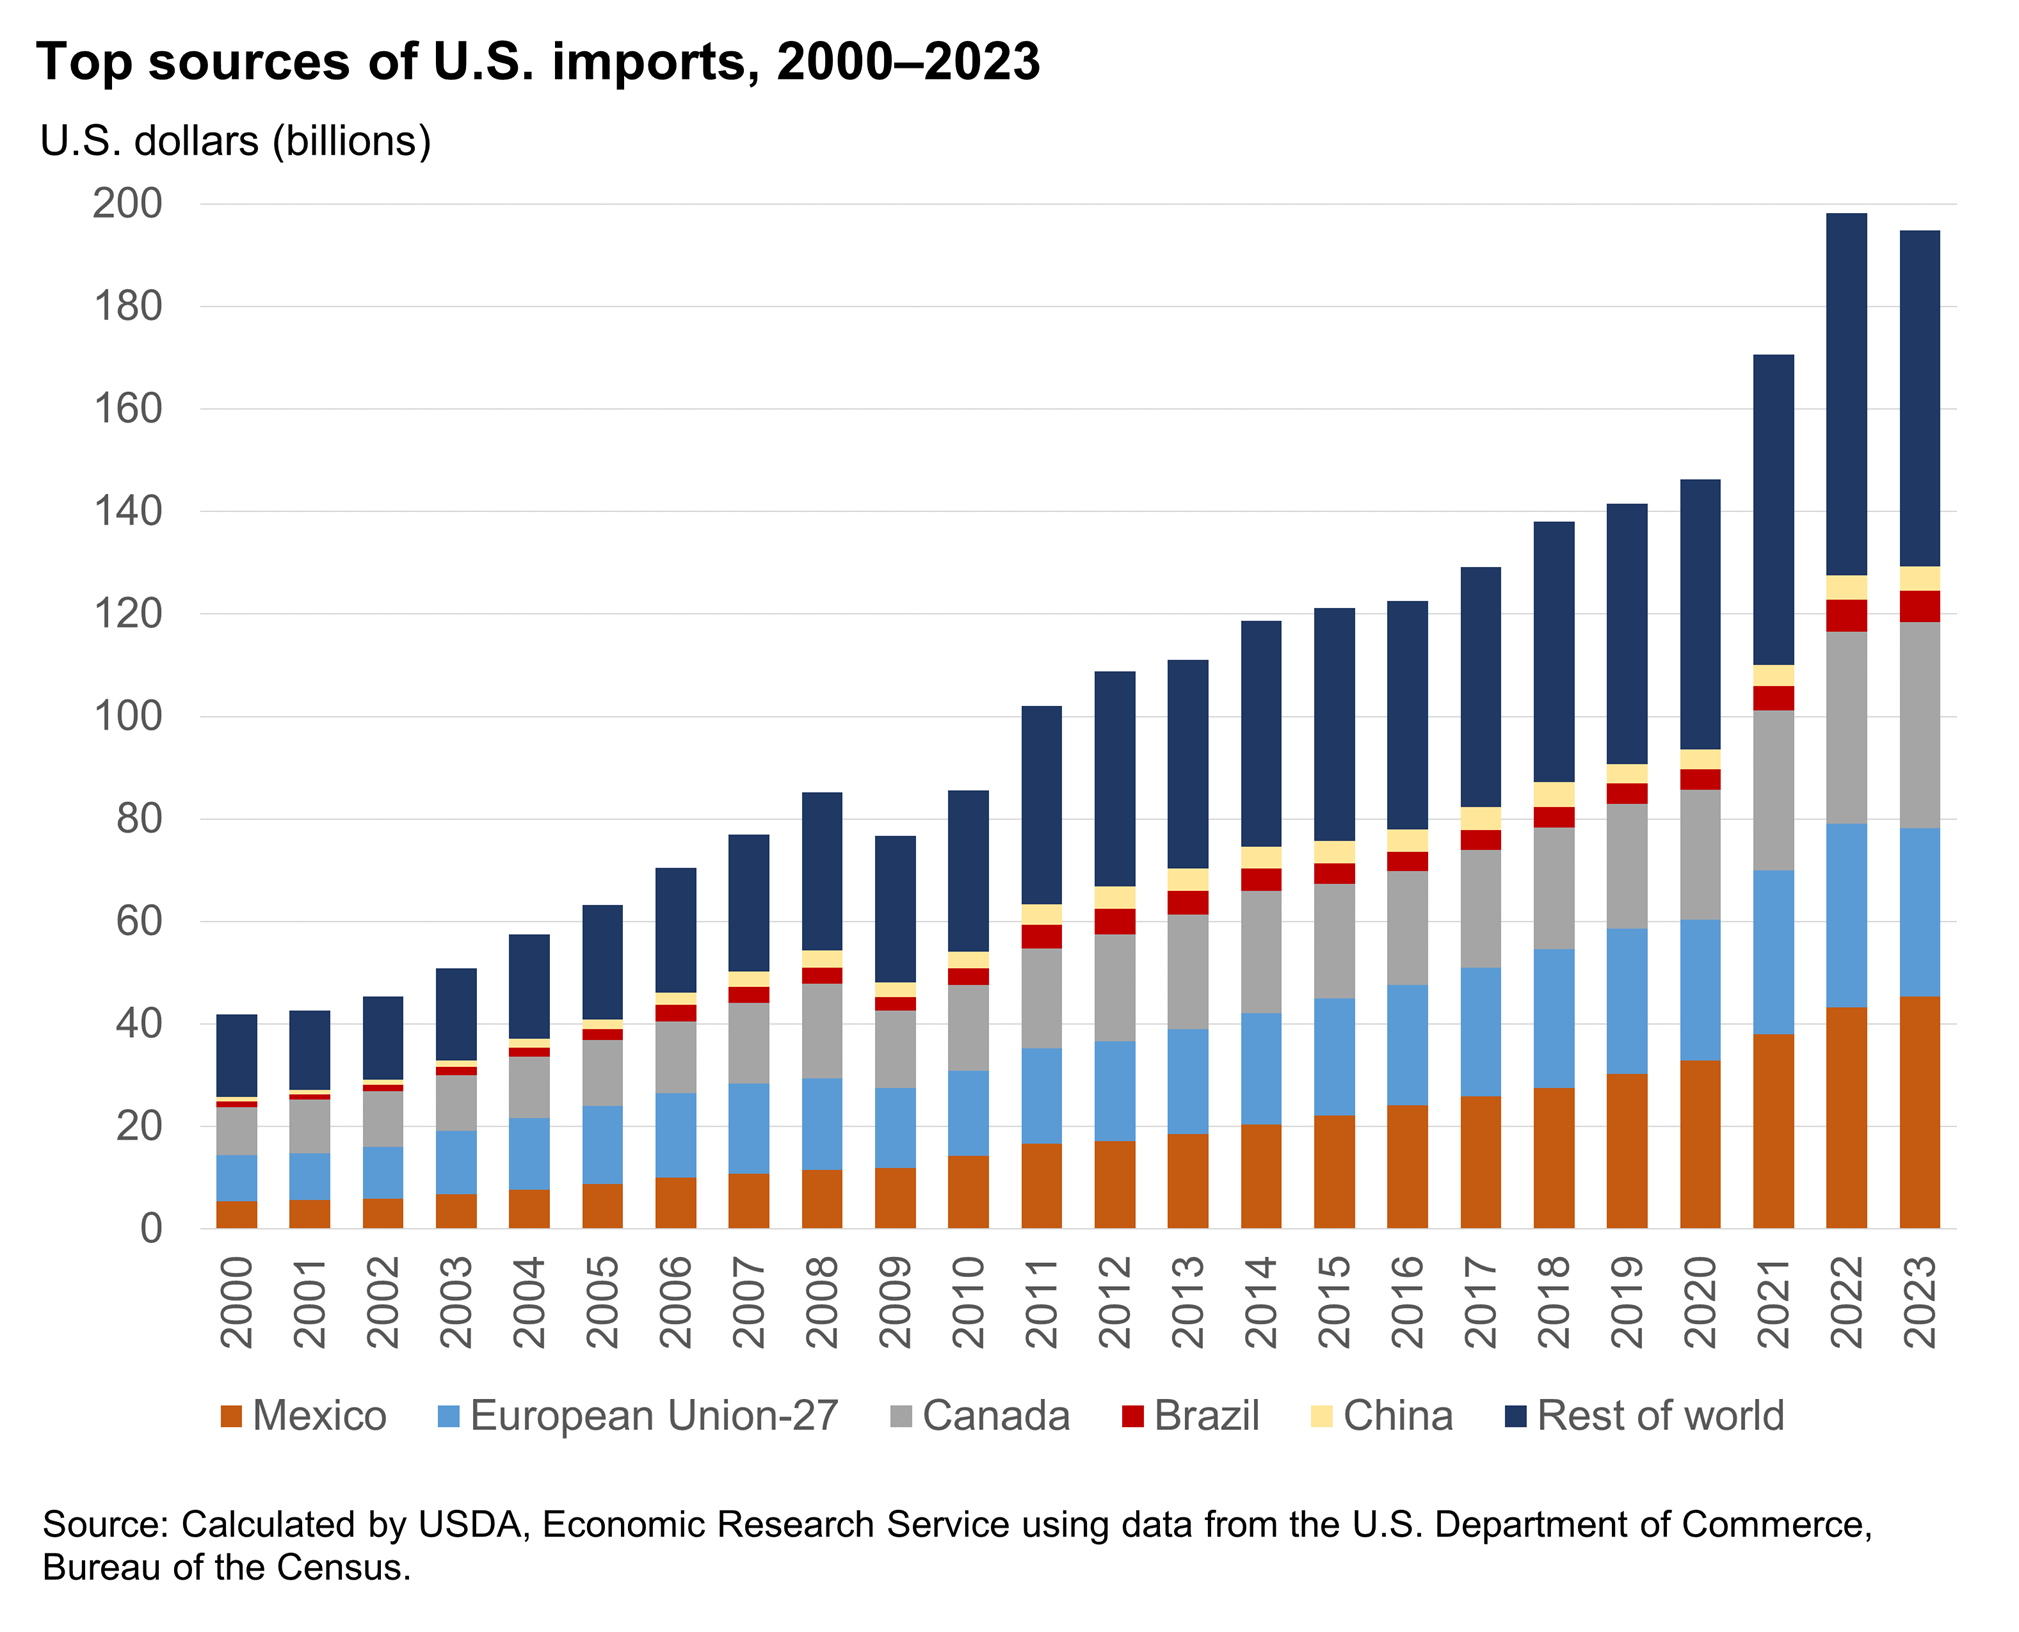
The United States continues to be a key participant in global agricultural trade. Total U.S. agricultural trade fell from record levels in 2022 with U.S. agricultural exports valued at $174 billion and imports valued at $195 billion in 2023.
China was the largest market for U.S. agricultural exports in 2023, comprising 17 percent of the total. China is closely followed by Canada and Mexico which each received $28.4 billion of U.S. agricultural goods, together totaling 33 percent of U.S. exports. Japan and the EU are also among the top five agricultural export destinations for the United States, although their shares of U.S. exports have decreased since 2000. These top five U.S. agricultural trading partners accounted for 63 percent of U.S. agricultural exports in 2023.
Download chart data in Excel format
Mexico and Canada are two of the United States' three largest suppliers of agricultural products ($45.4 billion and $40.1 billion, respectively, in 2023). Mexico supplied 23 percent of the United States’ imported products, including horticultural products such as fruit, vegetables, and alcoholic beverages. Canada is also a source of horticultural products, as well as grains and meats. The European Union is one of the top three import sources, accounting for $32.9 billion worth of U.S. agricultural imports in 2023, with horticultural products such as wine, spirits, and essential oils accounting for more than 60 percent of that value. Brazil and China supplied 3 percent and 2 percent of U.S. imports making them the fourth and fifth largest sources of agricultural imports. In total, the top five sources of imports accounted for 66 percent of all U.S. agricultural imports in 2023.
Download chart data in Excel format
Continental Africa is also expected to become an increasingly important participant in global trade and an important trading partner with the United States. The continent has more than 1.4 billion people and the population is expected to continue growing swiftly. Projected changes in demographic, income, and food demand patterns in Africa offer potential opportunities for trade.
Because of the importance of these geographies to U.S. agricultural trade, USDA, Economic Research Service (ERS) economists conduct research and analysis on the economies, agricultural sectors, and policies of U.S. key trading partners. ERS also assesses environmental, food safety, and food security challenges confronting countries and regions in an increasingly global agricultural market, in addition to researching the economic opportunities the market provides.
Geography-specific reports, information, and data are available on Brazil, Canada, China, the European Union, India, Japan, Mexico, South Korea, and the continent of Africa.