
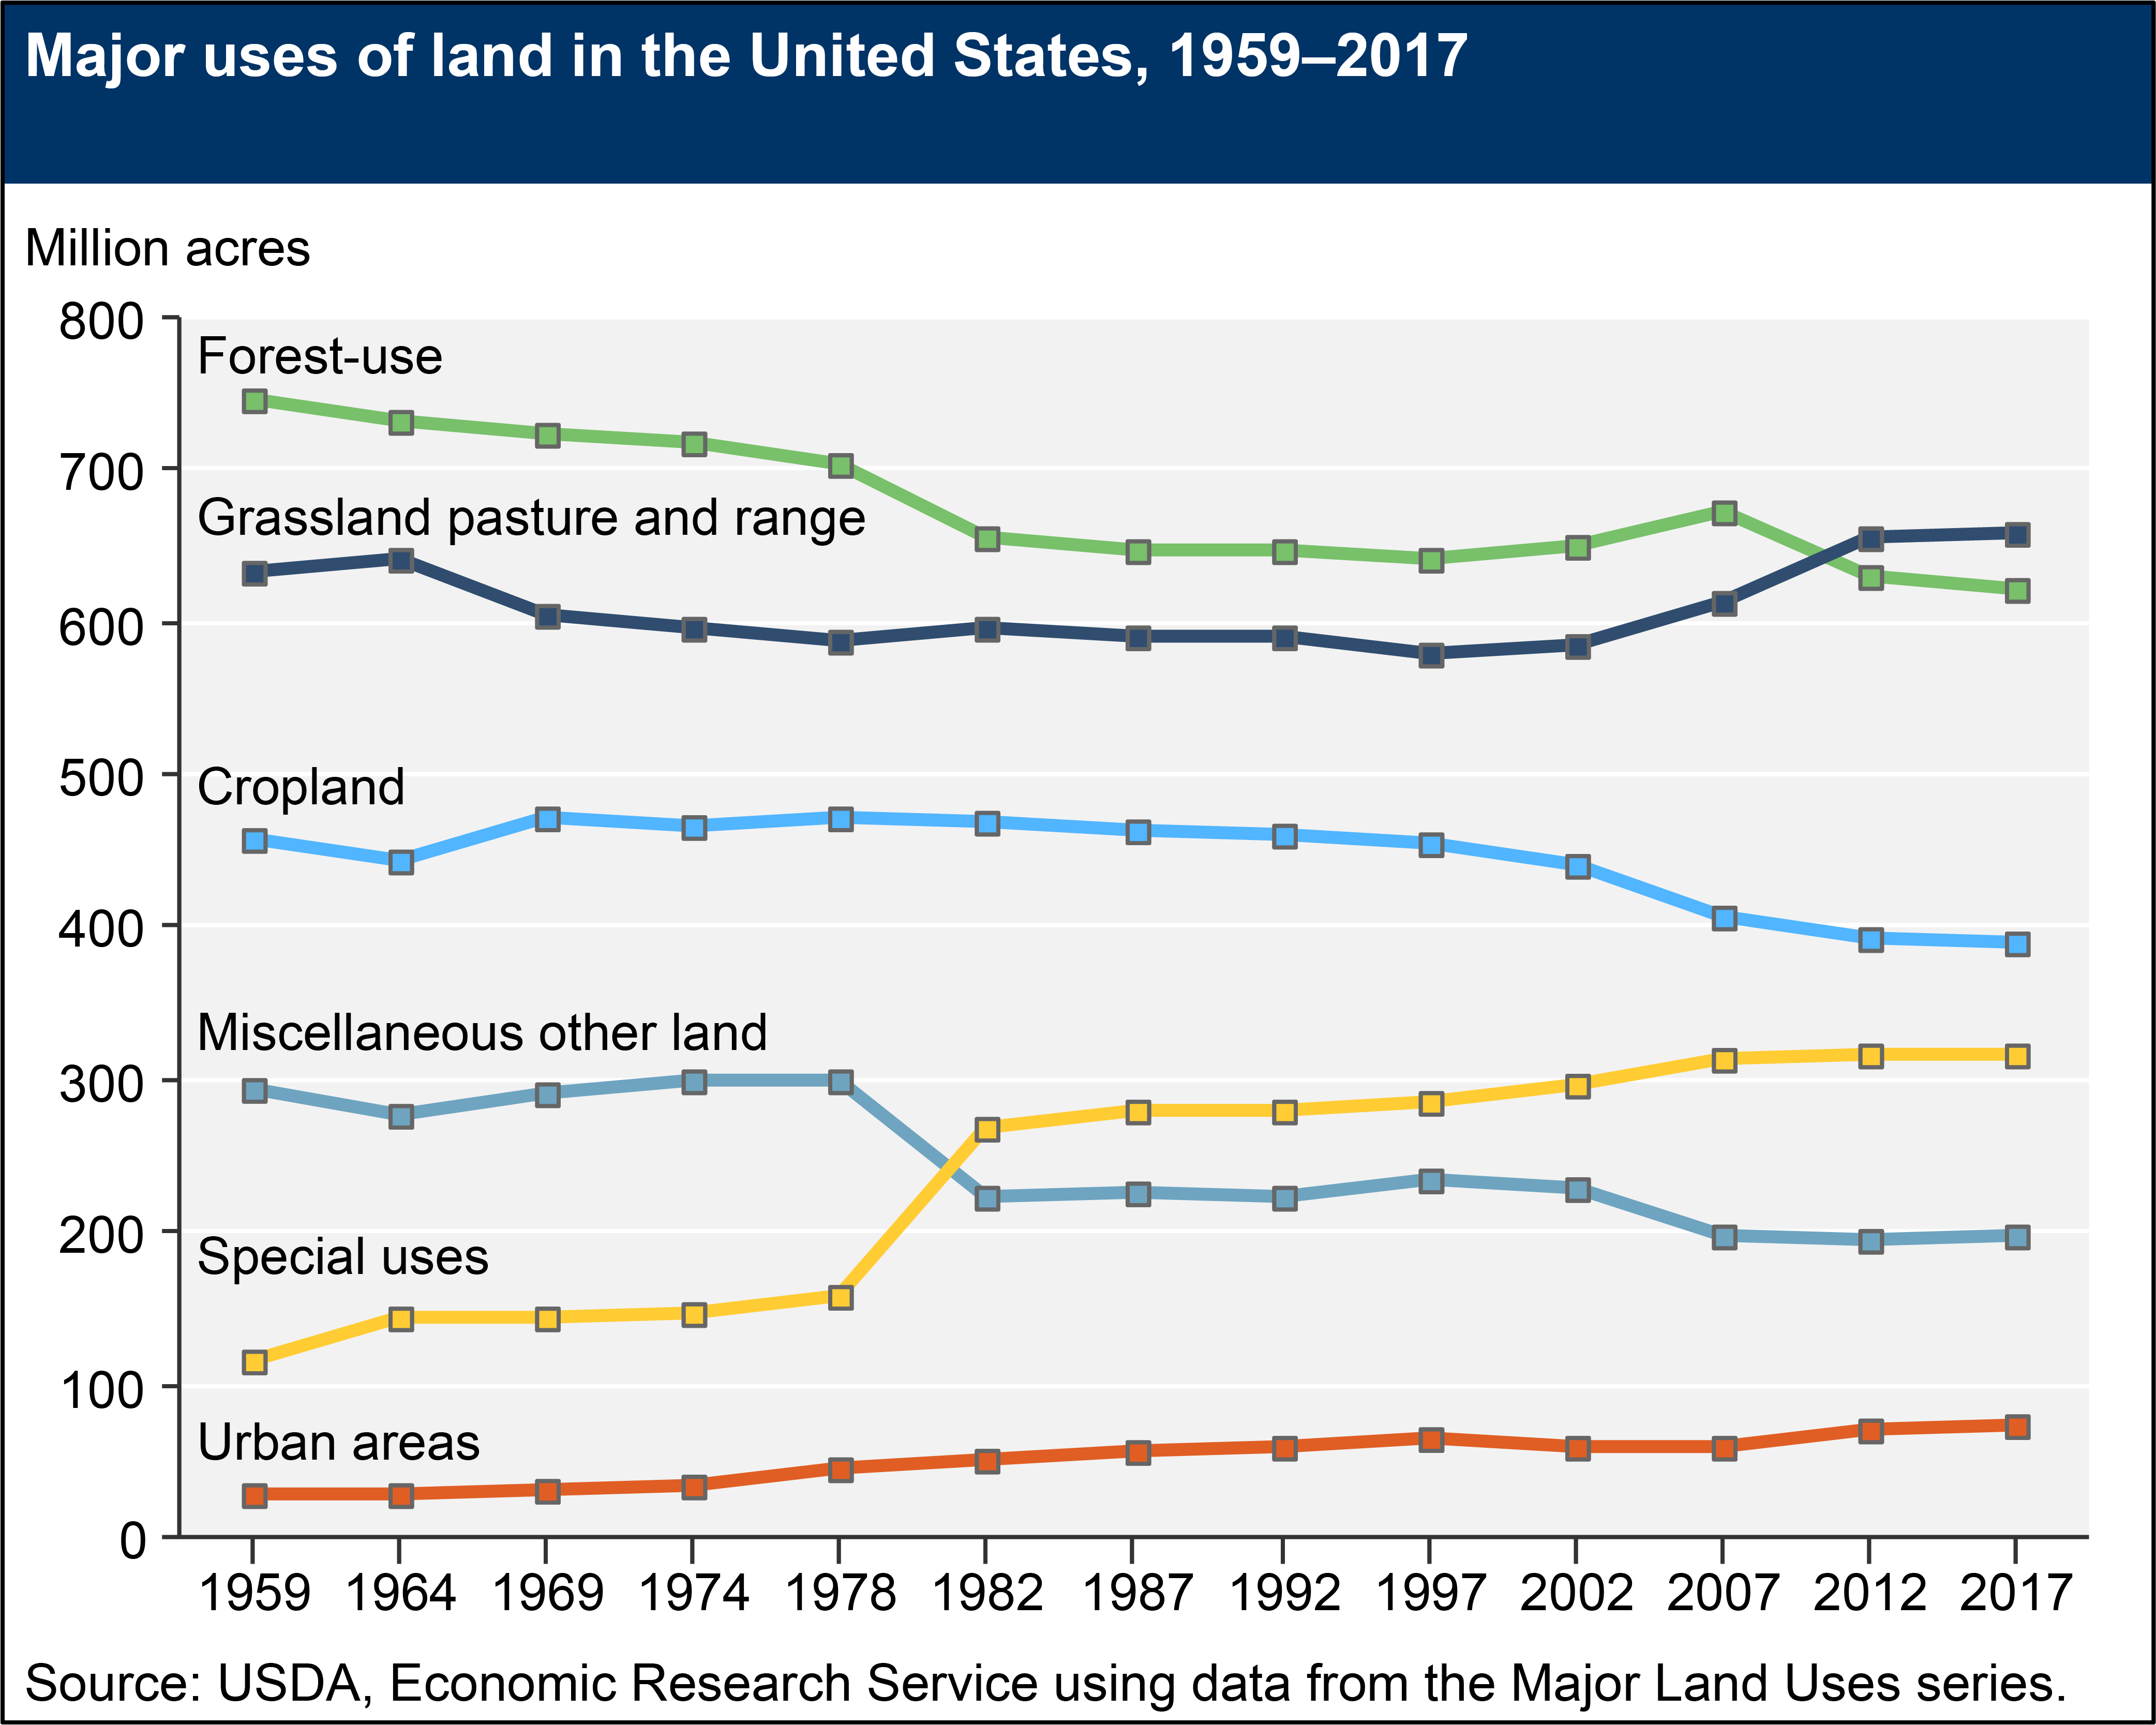
The U.S. land area covers nearly 2.26 billion acres. According to the latest update to ERS's Major Land Uses (MLU) series, grassland pasture and range uses accounted for the largest share of the Nation's land base in 2017, with land in forest uses (which includes grazed forest land) accounting for the next largest share. Although the shares of land in different uses have fluctuated to some degree over time, land area in the top three categories (i.e., grassland pasture and range, forest, and cropland) has remained relatively stable. Land dedicated to special uses, which includes land in State/national parks and wilderness areas, has increased substantially since the MLU series began 1945. Urban land use has also increased, albeit more modestly, as population and economic growth spur demand for new housing and other forms of development. About 53 percent of the 2017 U.S. land base (including Alaska and Hawaii) is used for agricultural purposes, including cropping, grazing (on pasture, range, and in forests), and farmsteads/farm roads.
Download chart image | Chart data
Land-use change occurs for a variety of reasons. Changing commodity and timber prices, agricultural and natural resource policies, urban pressure, and environmental factors (e.g., droughts) prompt private landowners to shift land to uses that maximize economic returns. Although land-use change can be bidirectional for some uses—such as forestry, grassland, and cropland—conversions to an urban use are typically irreversible. As part of the Major Land Uses program, ERS analyzes trends in all of these uses and examines factors driving broad land-use patterns and trends. Other ERS research takes a more indepth look at particular issues, including farmers’ land-use decisions in response to ethanol-induced increases in corn demand, the role of crop insurance and other farm programs in grassland-cropland conversions, the effects of drought risk on participation in land retirement programs, and effective targeting of conservation funding to maximize benefits of restoring and conserving wetlands. Technology has also affected land use and regional land-use shifts—especially in cropland. The rapid adoption of new technology, improved crop varieties, improved insect and disease control, and other changes have boosted agricultural productivity to the extent that more production can be obtained from the same cropland base.
In 2017, total U.S. cropland acreage (a category comprising cropland used for crops, idled cropland, and pastured cropland) reached its lowest level (390 million acres) since the MLU series began in 1945 and 2 million acres below the previous low that was observed in 2012. The decrease of cropland over this 5-year period stemmed from a 2-million-acre reduction in cropland used for crops, which accounts for the largest share of total cropland. The trajectory of cropland acreage also varies by region. Some regional changes in cropland used for crops represent year-to-year fluctuations that tend to balance out over time, but other areas (e.g., the Northeast and Southeast regions) have experienced clear long-term declines. Urban pressures and a comparative disadvantage in cropland profitability resulted in the conversion of cropland to alternative, more profitable uses in these regions. However, changes at the regional level had resulted in little change in the concentration of acreage used for crops in major crop-producing regions during the 1969–2017 period.
Even when cropland acreage appears relatively constant at a national level, the mix of crops produced changes in response to market forces and policy changes. For example, wheat acreage has declined 50 percent from its historic high in the early 1980s, a trend attributable to a variety of factors, including a reduction in the relative profitability of wheat due to increased foreign competition, Conservation Reserve Program (CRP) participation in wheat-producing areas, and genetic refinements to corn and soybean varieties that allowed these crops to be planted in areas previously used primarily for wheat. In contrast, soybean acreage has more than tripled since the 1960s, primarily as a result of strong international demand, while corn acreage has also risen in recent years in response to policy-induced biofuel demand.