Trends and patterns in the ownership of agricultural land are of perennial interest to all involved with the farm sector. Farmland tenure, which broadly refers to the institutions governing the control and use of farmland, shapes many farm decisions, including those related to production, conservation, and succession planning. Given the relatively advanced age of many farmers, both tenure and ownership can also have important implications for access to land, an issue that is particularly salient for new and beginning farmers.
A majority of U.S. land in farms is owner-operated—just over 60 percent, according to the 2022 Census of Agriculture. The national share of farmland that is owner-operated has been relatively stable over the past 50 years, with a noticeable decline during the farm financial crisis of the 1980s. Higher rates of farmland rental are reported in the Mississippi Delta region, as well as the Corn Belt and the Northern Plains.

Download chart image | Chart data
In 2016, USDA's Economic Research Service published a comprehensive study of farmland ownership, tenure, and transfer in U.S. agriculture. The study provides both a descriptive baseline analysis of land ownership and a more detailed look at several aspects of land tenure, including non-operator landlords, rental agreements, the acquisition and transfer of land, and how decisionmaking is shared by landlords and their tenants. The analysis is primarily derived from the results of the 2014 Tenure, Ownership, and Transition of Agricultural Land (TOTAL) survey, which was administered by USDA’s ERS and National Agricultural Statistics Service (NASS) as part of a special followup to the 2012 Census of Agriculture to collect data from the owners and operators of agricultural land. For the ERS report and related interactive charts, see:
- U.S. Farmland Ownership, Tenure, and Transfer
- Interactive charts: Visualizing U.S. Farmland Ownership, Tenure, and Transition
Findings from the report include:
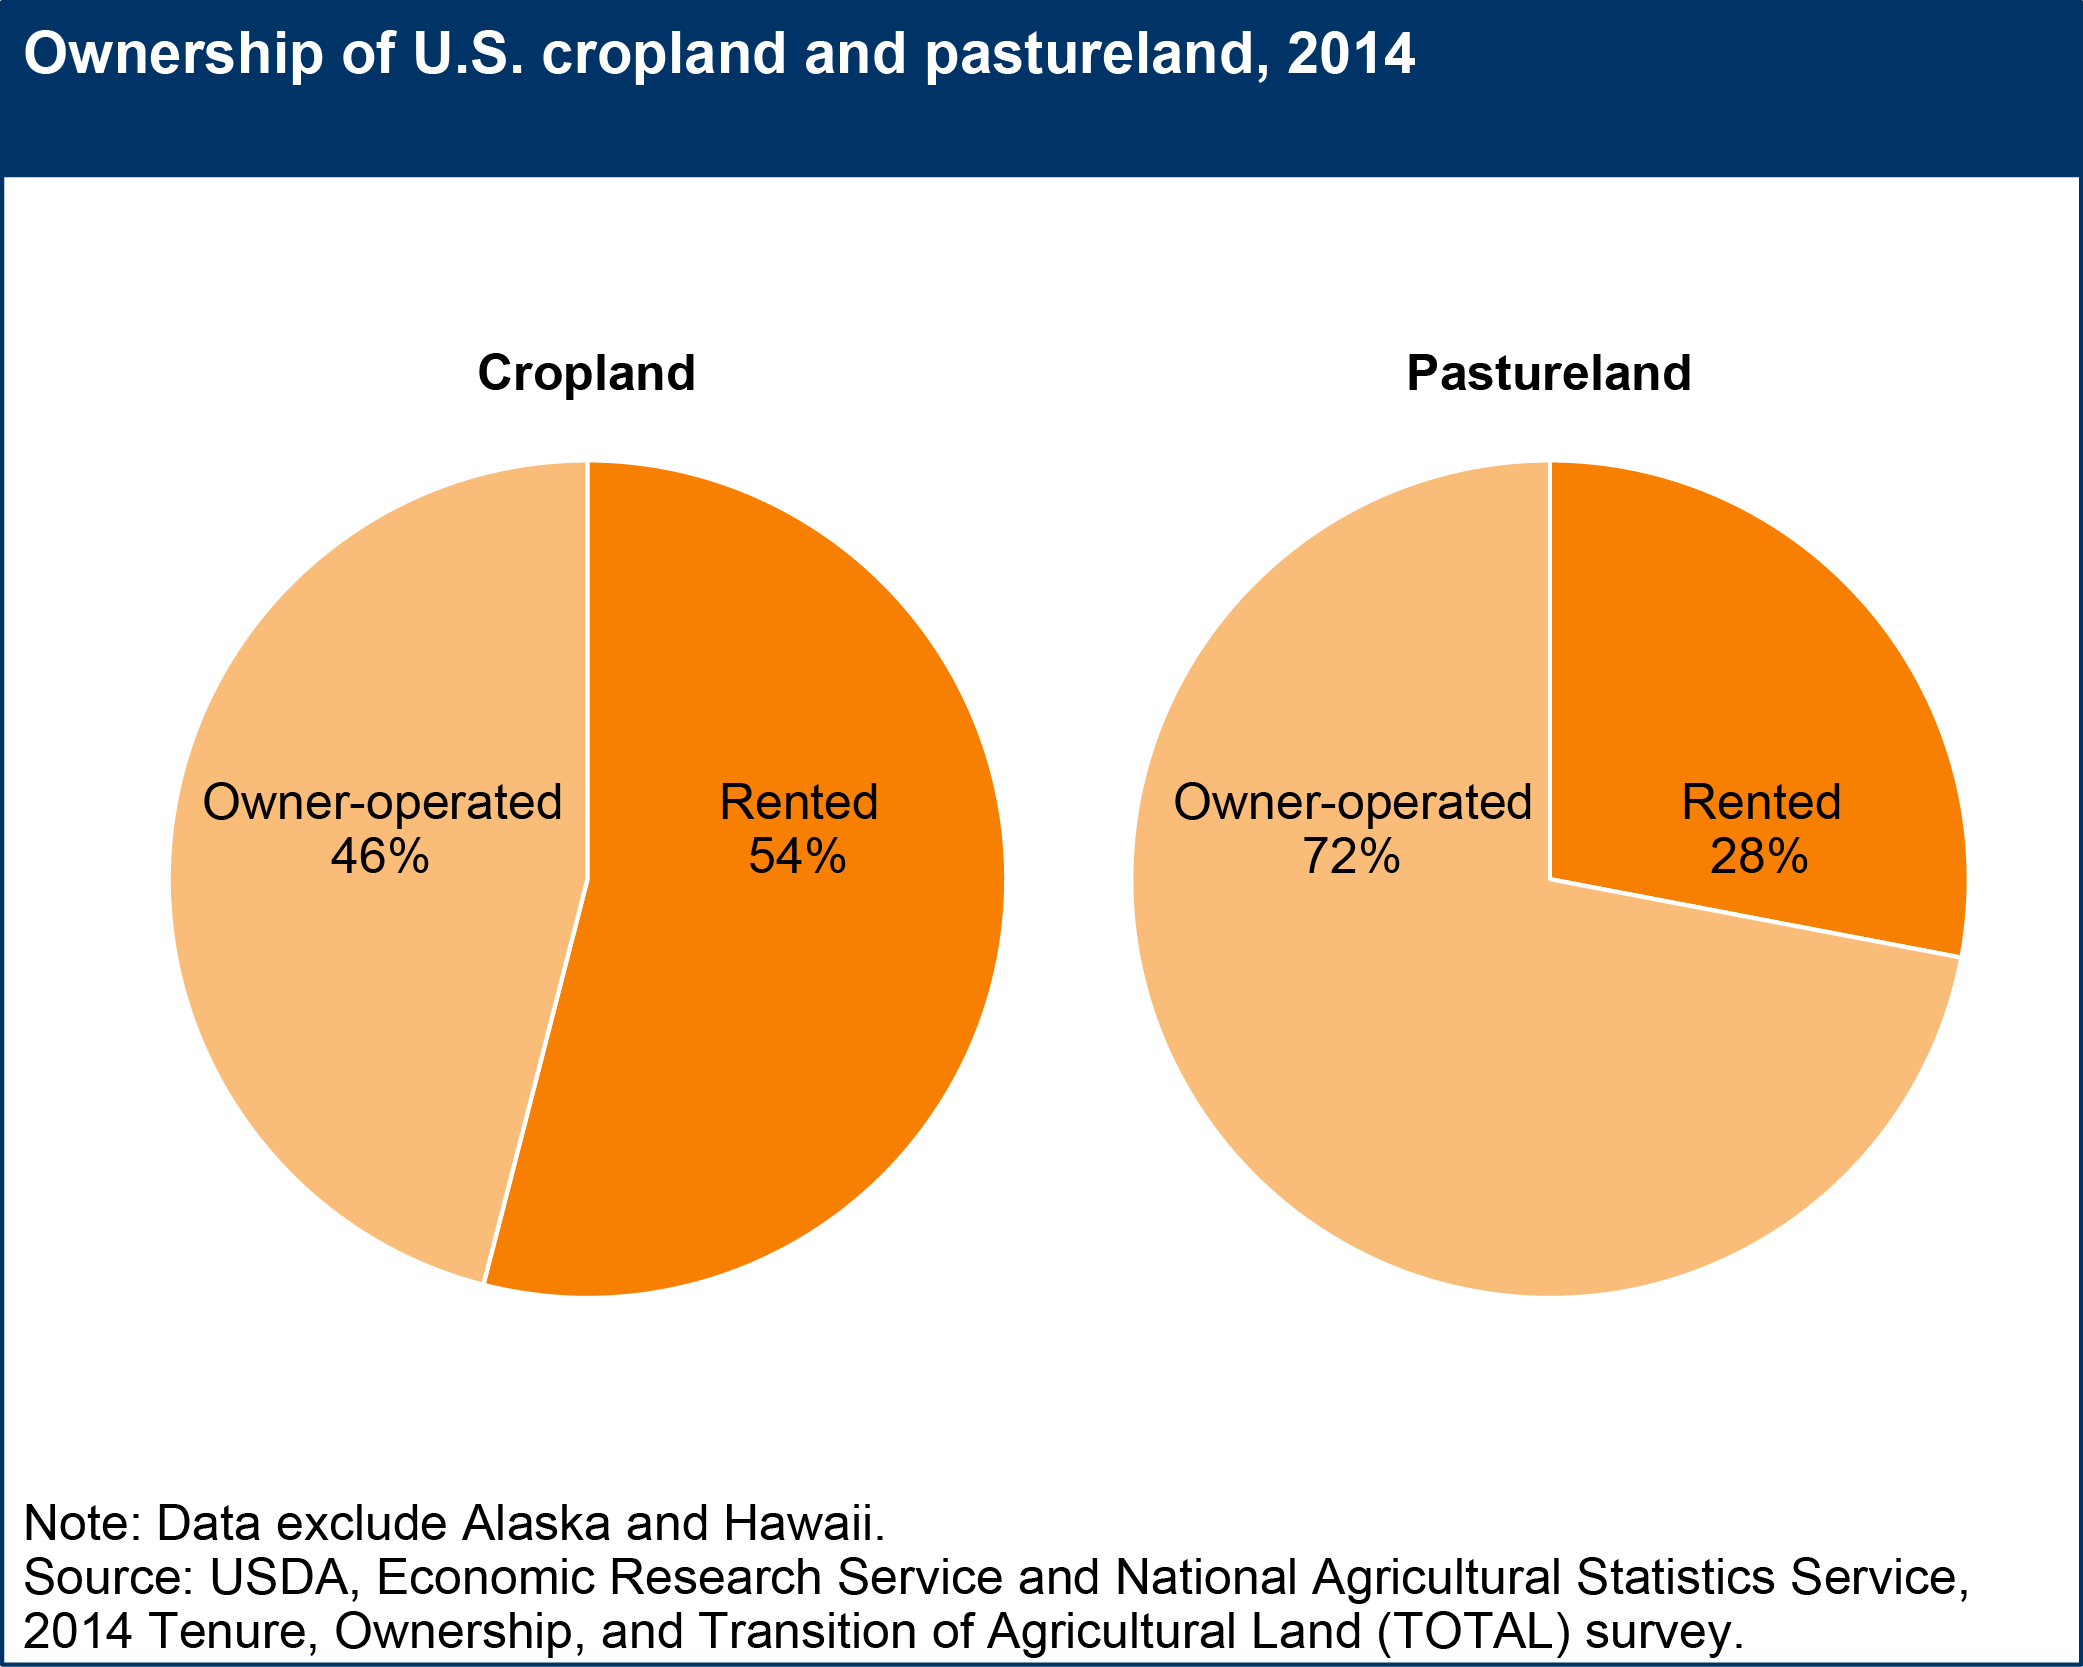
Approximately 39 percent of the 911 million acres of farmland in the contiguous 48 States was rented. More than half of cropland is rented, compared with just over 25 percent of pastureland. In general, rental activity is concentrated in grain production areas; cash grains such as rice, corn, soybeans, and wheat, and also cotton, are commonly grown in areas where over 50 percent of farmland is rented.

Smaller family farm operators are more likely to be full owners of land they operate. Forty-five percent of farmland is in small family farms, and nearly half (46 percent) of this land is found in operations that own all the land they operate. Fifty-one percent of land in farms is in midsize and larger family farm operations, which are most commonly a mixture of rented and owned land. Nonfamily farms account for 4 percent of all farmland, 28 percent of which is found in full-owner operations.

The majority of rented acres are owned by non-operator landlords. Eighty percent of rented farmland (283 million acres, 30 percent of all farmland) is owned by non-operator landlords, those that own land used in agricultural production but are not actively involved in farming. The remaining 20 percent of rented land (70 million acres) is owned by other farm operators (referred to as "operator landlords").

Retired farmers make up 38 percent of non-operator landlords. In addition, farmers approaching retirement are more likely to be landlords than younger operators. Twenty-seven percent of land operated by those under 34 years of age is associated with full-tenant operations, while just 8 percent is fully owned by the operator. On the other hand, 7 percent of land operated by those who are 65 or older is found in full-tenant operations and 43 percent is fully owned by the operator.

Most landlords have long-term relationships with their tenants, suggesting that access to new land through renting may be limited. Seventy percent of acres rented from operator landlords have been rented to the same tenant for over 3 years and 28 percent for over 10 years. Non-operator landlords tend to have even lengthier relationships with their tenants; 84 percent of acres have been rented to the same tenant for over 3 years and 41 percent for over 10 years.

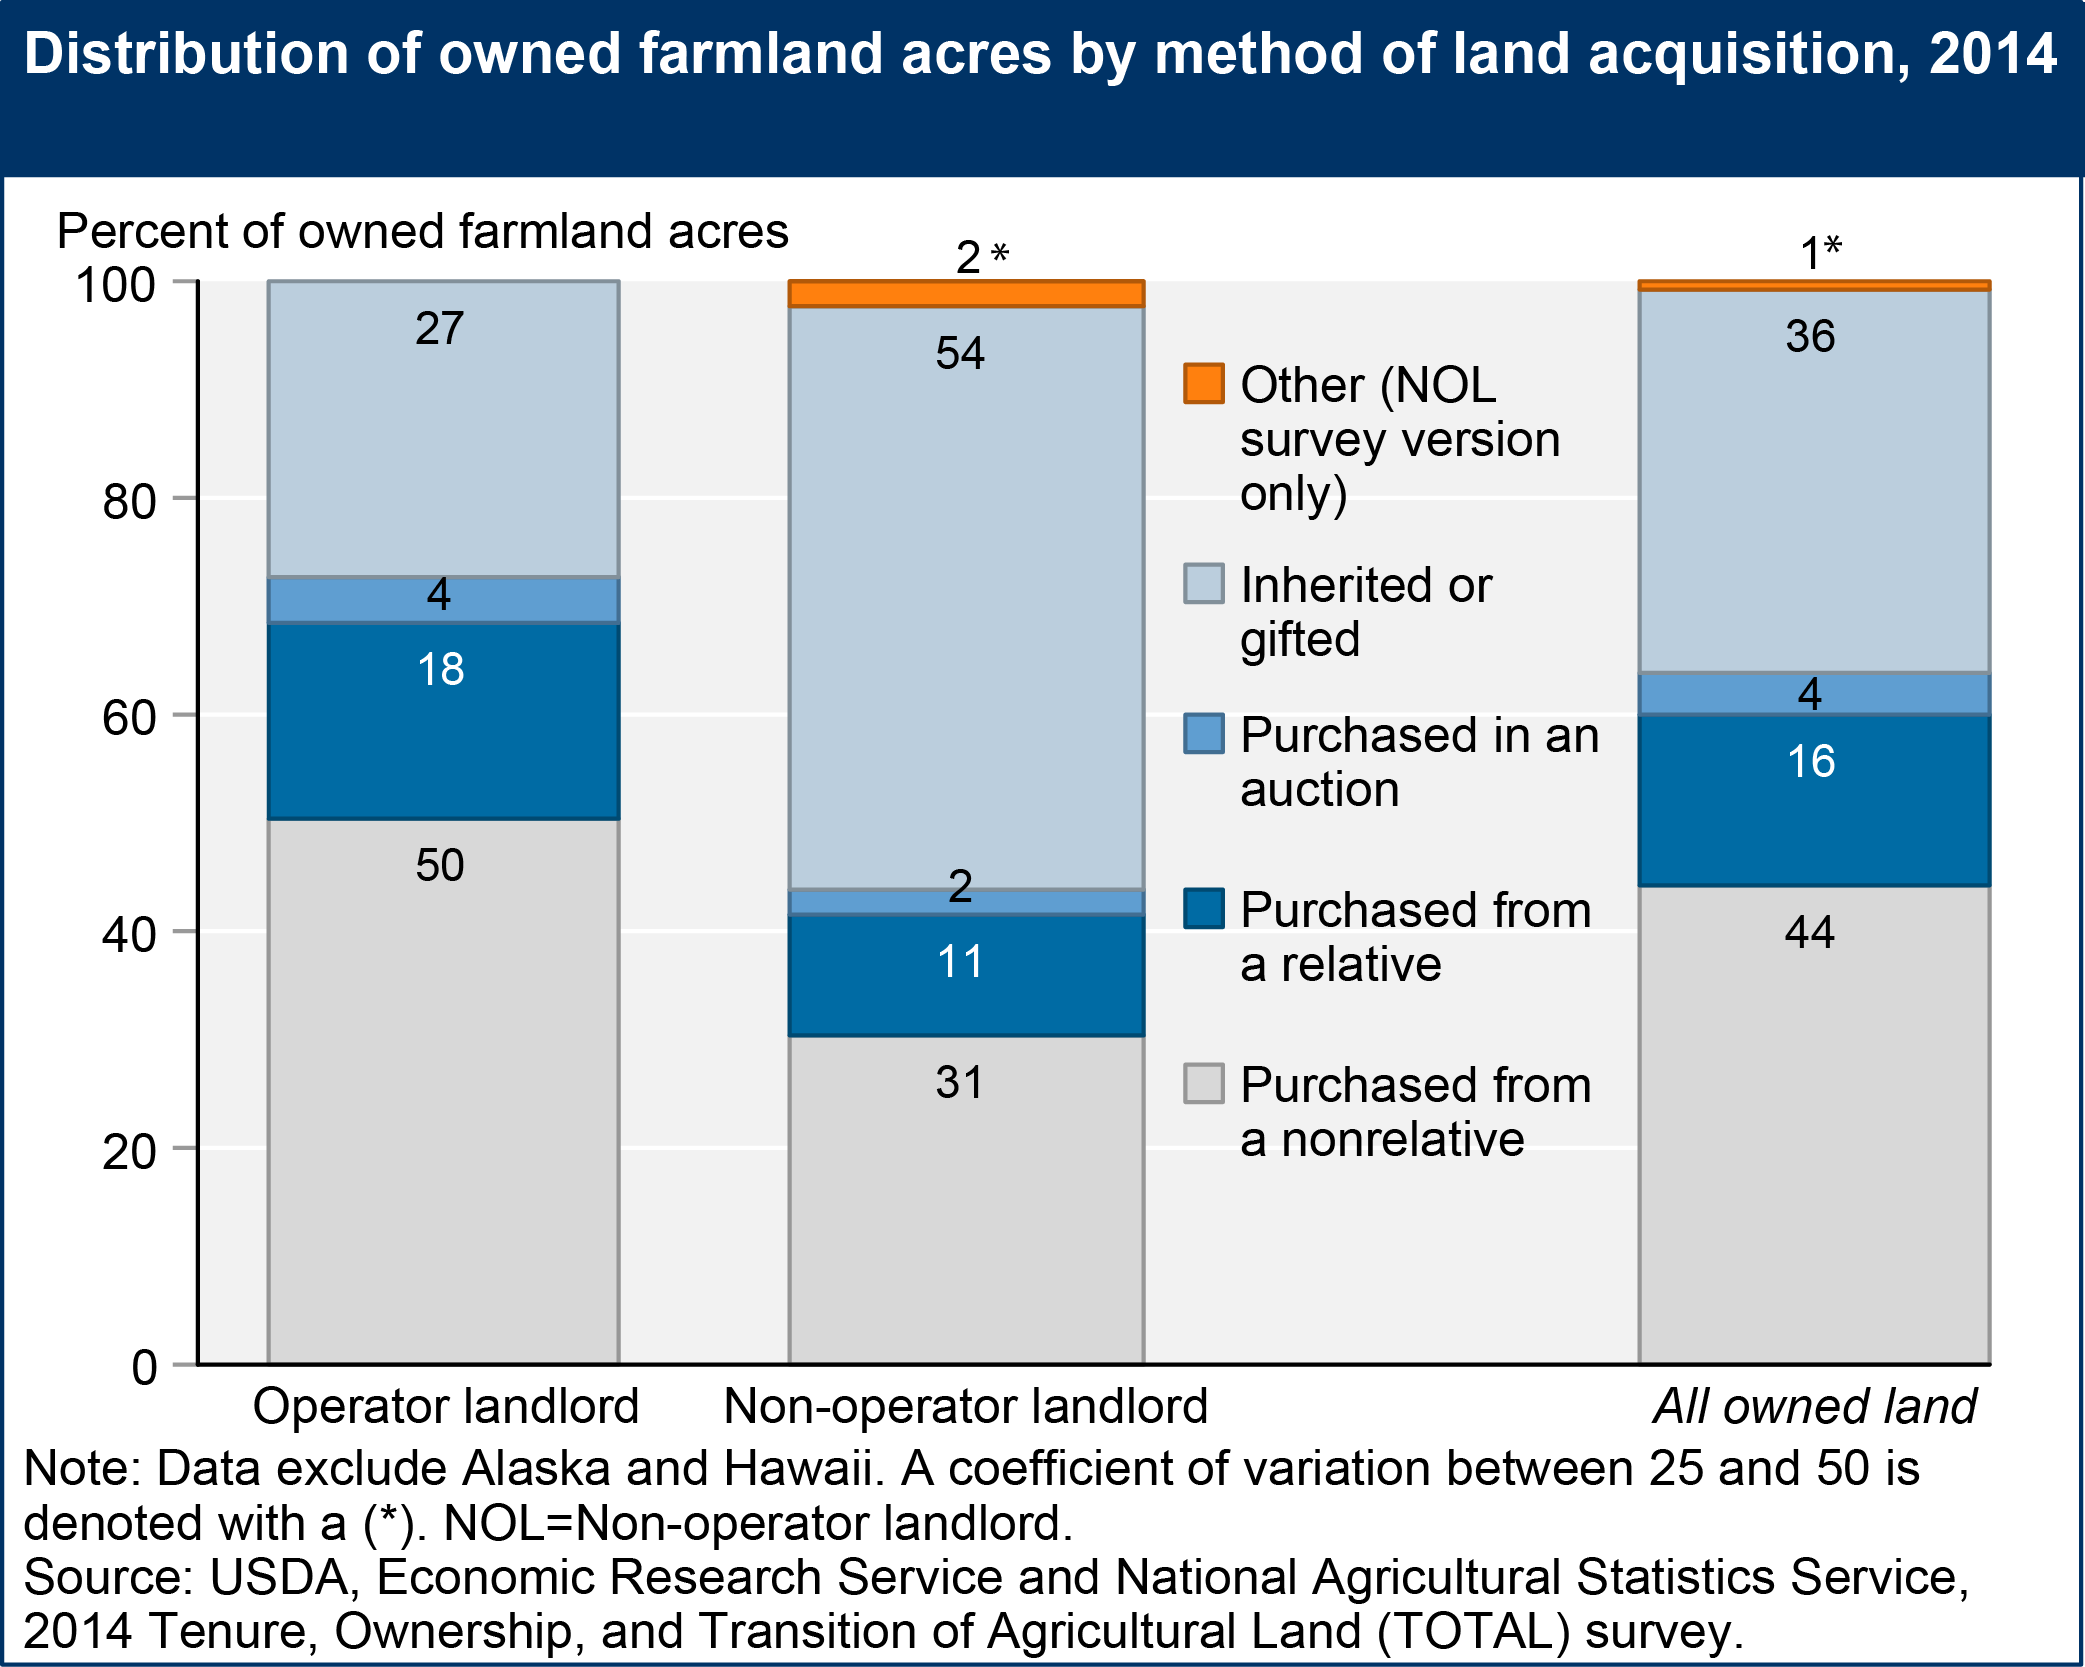
Non-operator landlords are more likely than operator landlords to acquire land through inheritance. Operator landlords acquired over 50 percent of their owned land through a purchase from a nonrelative, while non-operating landlords acquired over 50 percent through an inheritance or gift. Of the 45 percent of non-operator landlords who have no prior experience with farming, more than two-thirds either inherited or received their land as a gift. Thus, although a considerable fraction of non-operator landlords have not farmed, some familial or personal relationship to farming may exist.

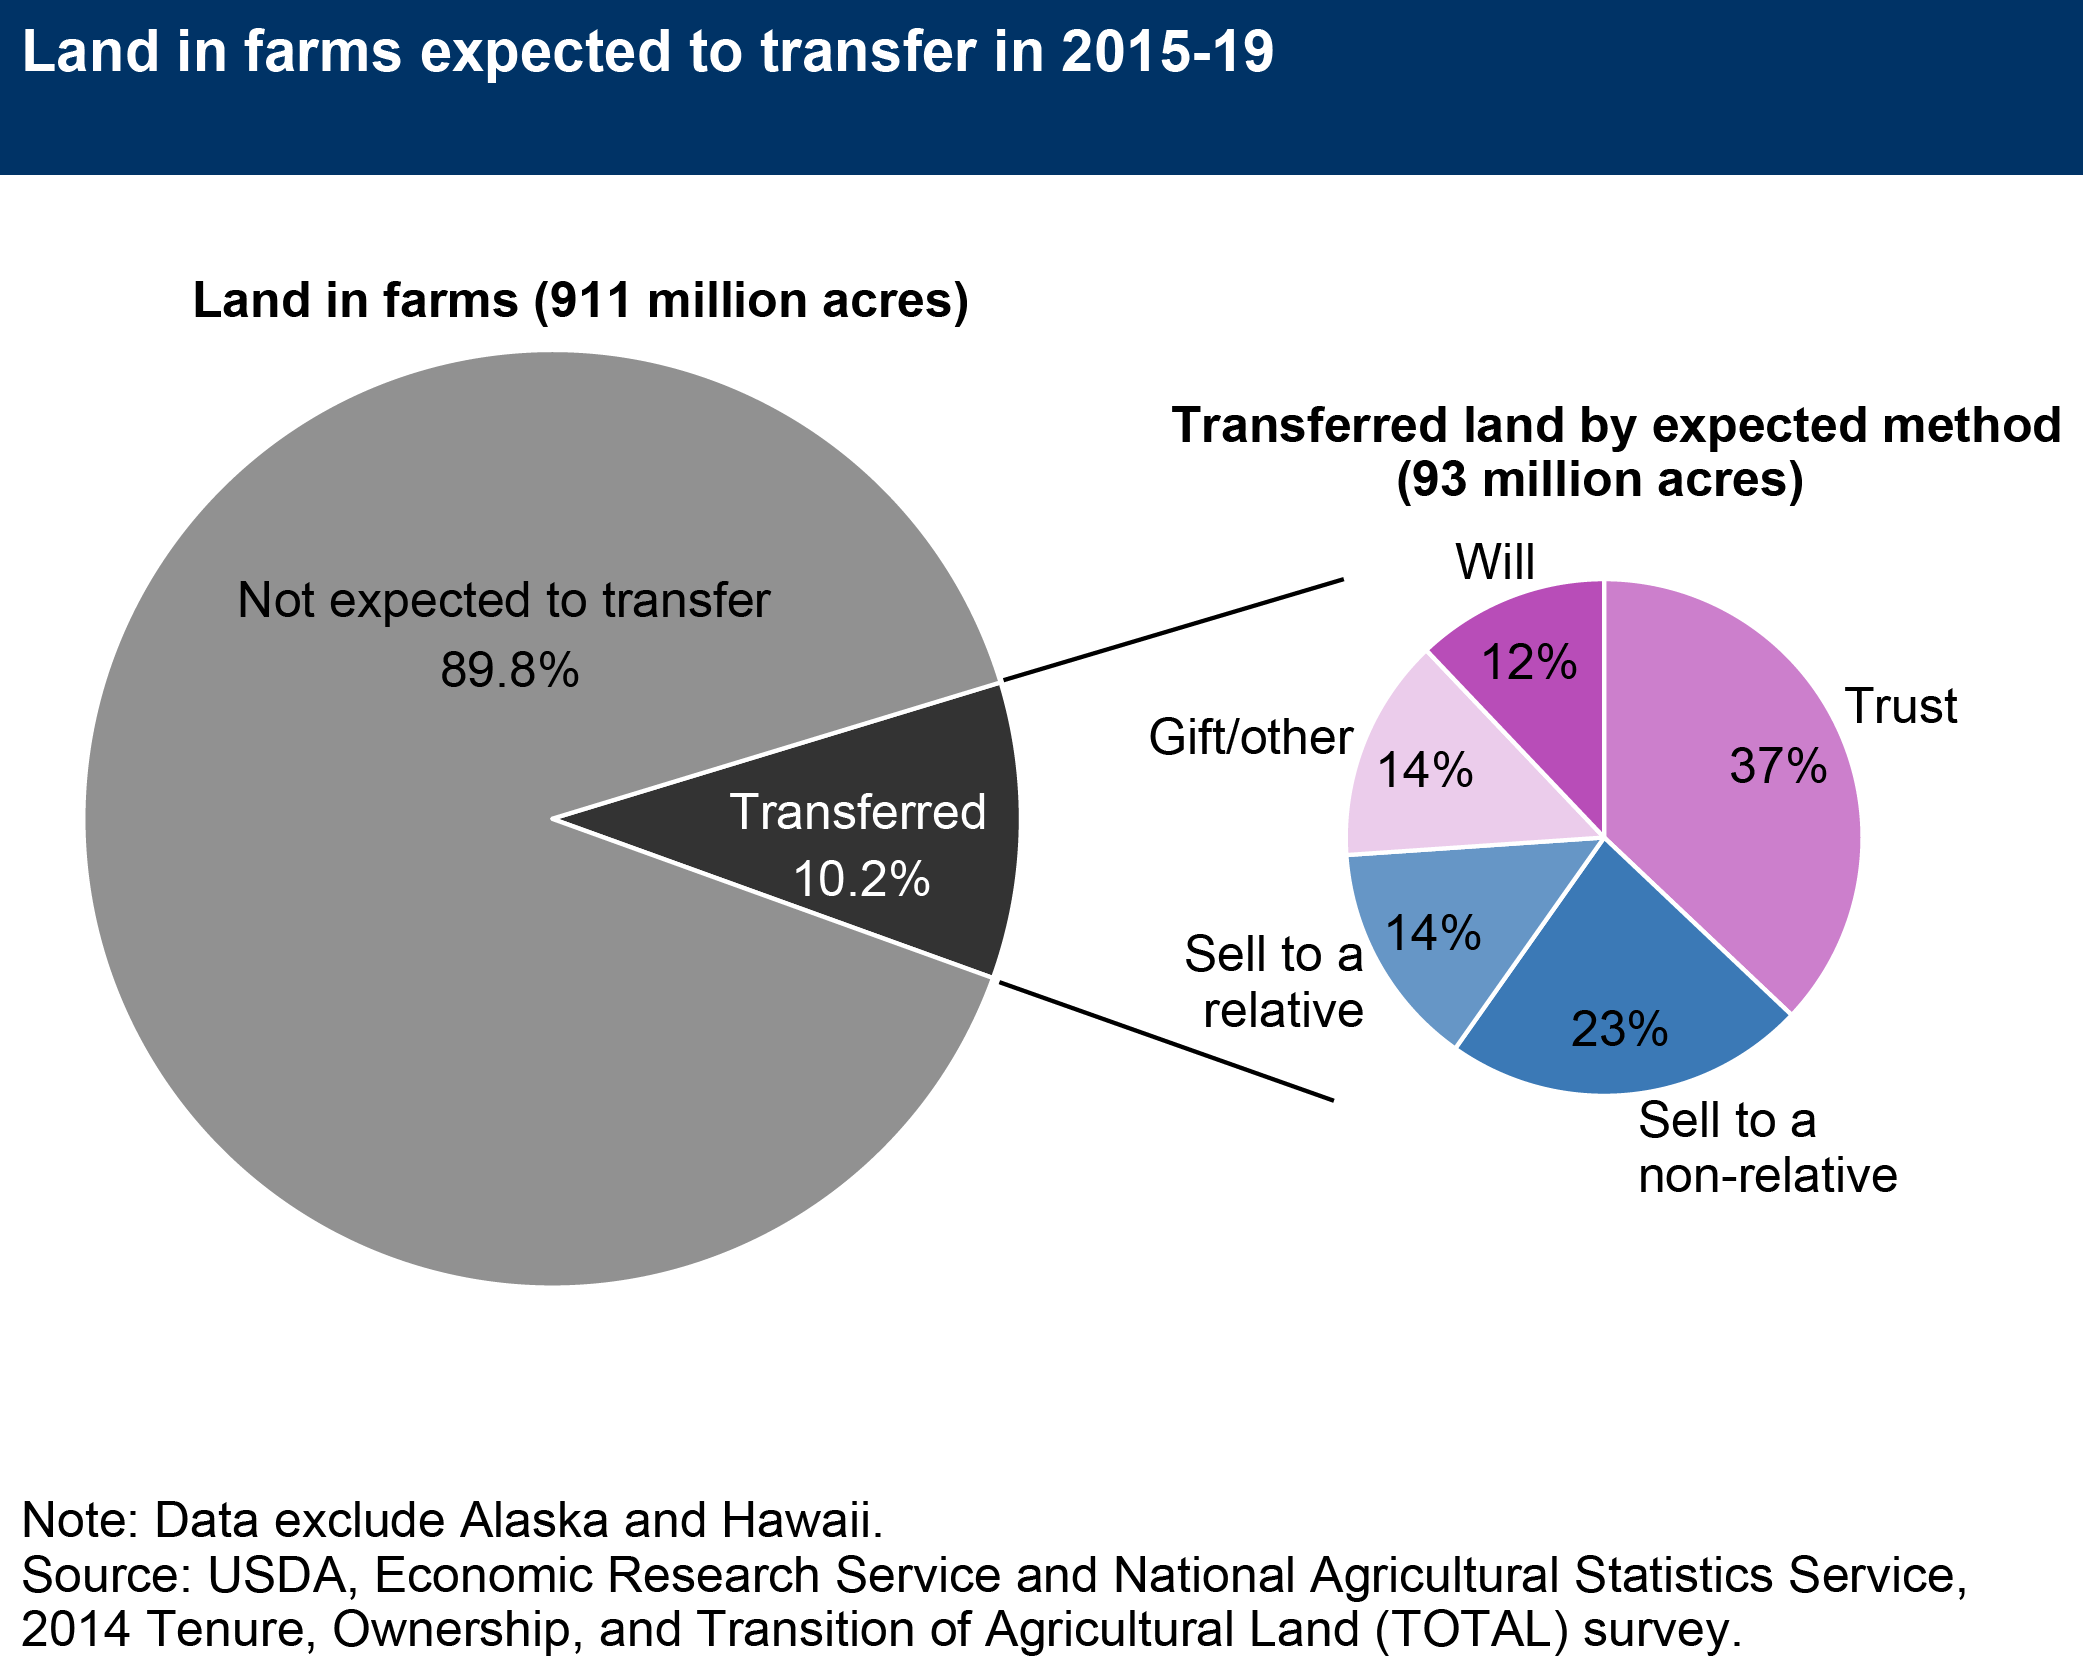
Ten percent (93 million acres) of all land in farms is expected to be transferred during 2015–19, most of which (6 percent) will change hands through gifts, trusts, or wills. Of all land expected to be transferred, only about a quarter (21 million acres) will be sold between nonrelatives. Another 14 percent (or 13 million acres) is anticipated to be sold from one relative to another. While the amount of farmland expected to be sold is relatively small, some of the land transferred through trusts, wills, and gifts may then be sold by the new owners, bolstering the supply of land available for purchase.

For additional information based on TOTAL published by ERS, see:
- The ERS report,
U.S. Farmland Ownership, Tenure, and Transfer
(EIB-161, August 2016). - The Amber Waves feature, Land Acquisition and Transfer in U.S. Agriculture (August 2016).
- Interactive charts, Visualizing U.S. Farmland Ownership, Tenure, and Transition.
For information on the survey available through NASS, see:
- QuickStats to access data from the 2014 Tenure, Ownership, and Transition of Agricultural Land (TOTAL) Survey.
- Highlights publication of results from the 2014 Tenure, Ownership, and Transition of Agricultural Land Survey.
