Suggested citation for linking to this discussion:
U.S. Department of Agriculture, Economic Research Service. (2024, December 3). Farm household well-being: Income and wealth in context.
Farm Operators' Household Income Compared With U.S. Household Income
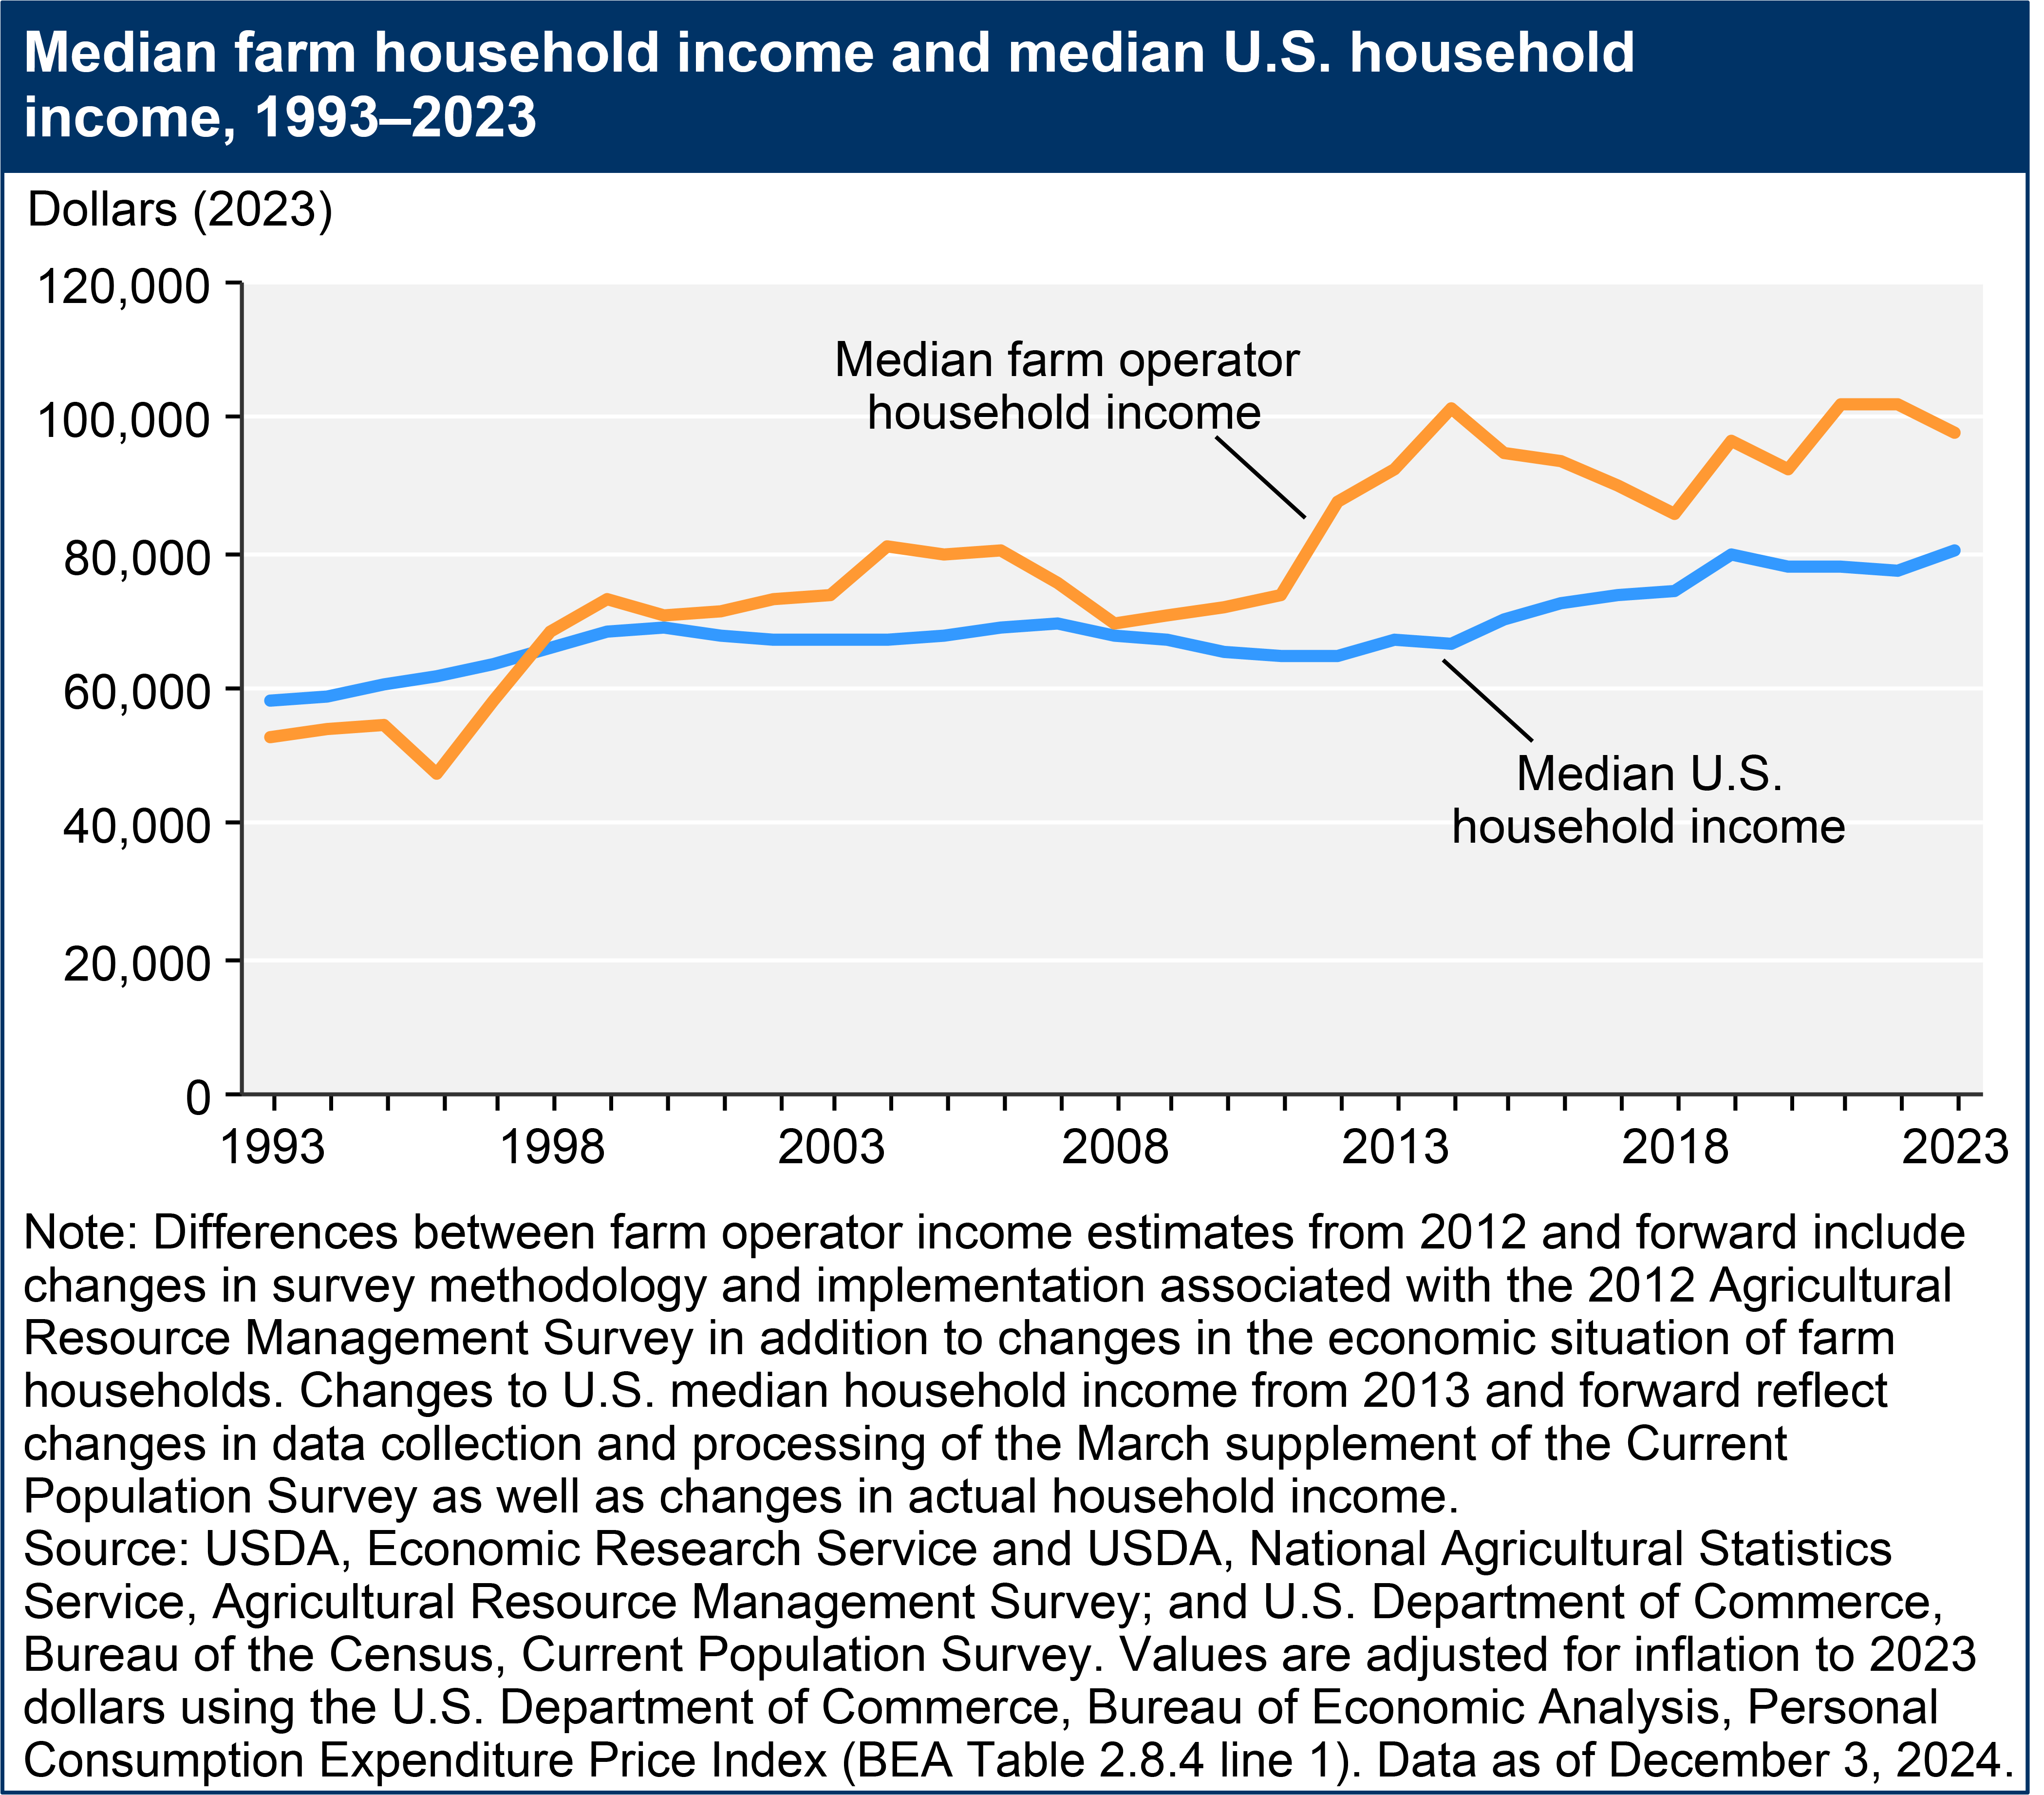
Since the 1980s, the USDA, Economic Research Service has reported an income measure for farm operator households comparable to the U.S. Department of Commerce, Bureau of the Census’ (Census Bureau) Current Population Survey measure for all U.S. households. Generally, the income measure is net money income from farm and off-farm sources, except that farm depreciation is included as an expense. See glossary for more details.
Farm household income is reported for households of the principal operators of family farms (i.e., the 96 percent of farms where the majority of the business is owned by an operator and individuals related to an operator by blood, marriage, or adoption). Median total farm household income has exceeded the median U.S. household income in every year since 1998. However, the gap between median farm and U.S. household income has varied over time. In 2023, median farm operator household income exceeded median U.S. household income by 21.6 percent ($97,984 compared with $80,610).

Download chart image | Chart data
For more on comparisons between all U.S households and farm households, including historic data on mean and median farm operator household income and ratios of farm household to U.S. household income, see the Farm Household Income and Characteristics data product.
Farm Business Income Compared with U.S. Self-Employed Households
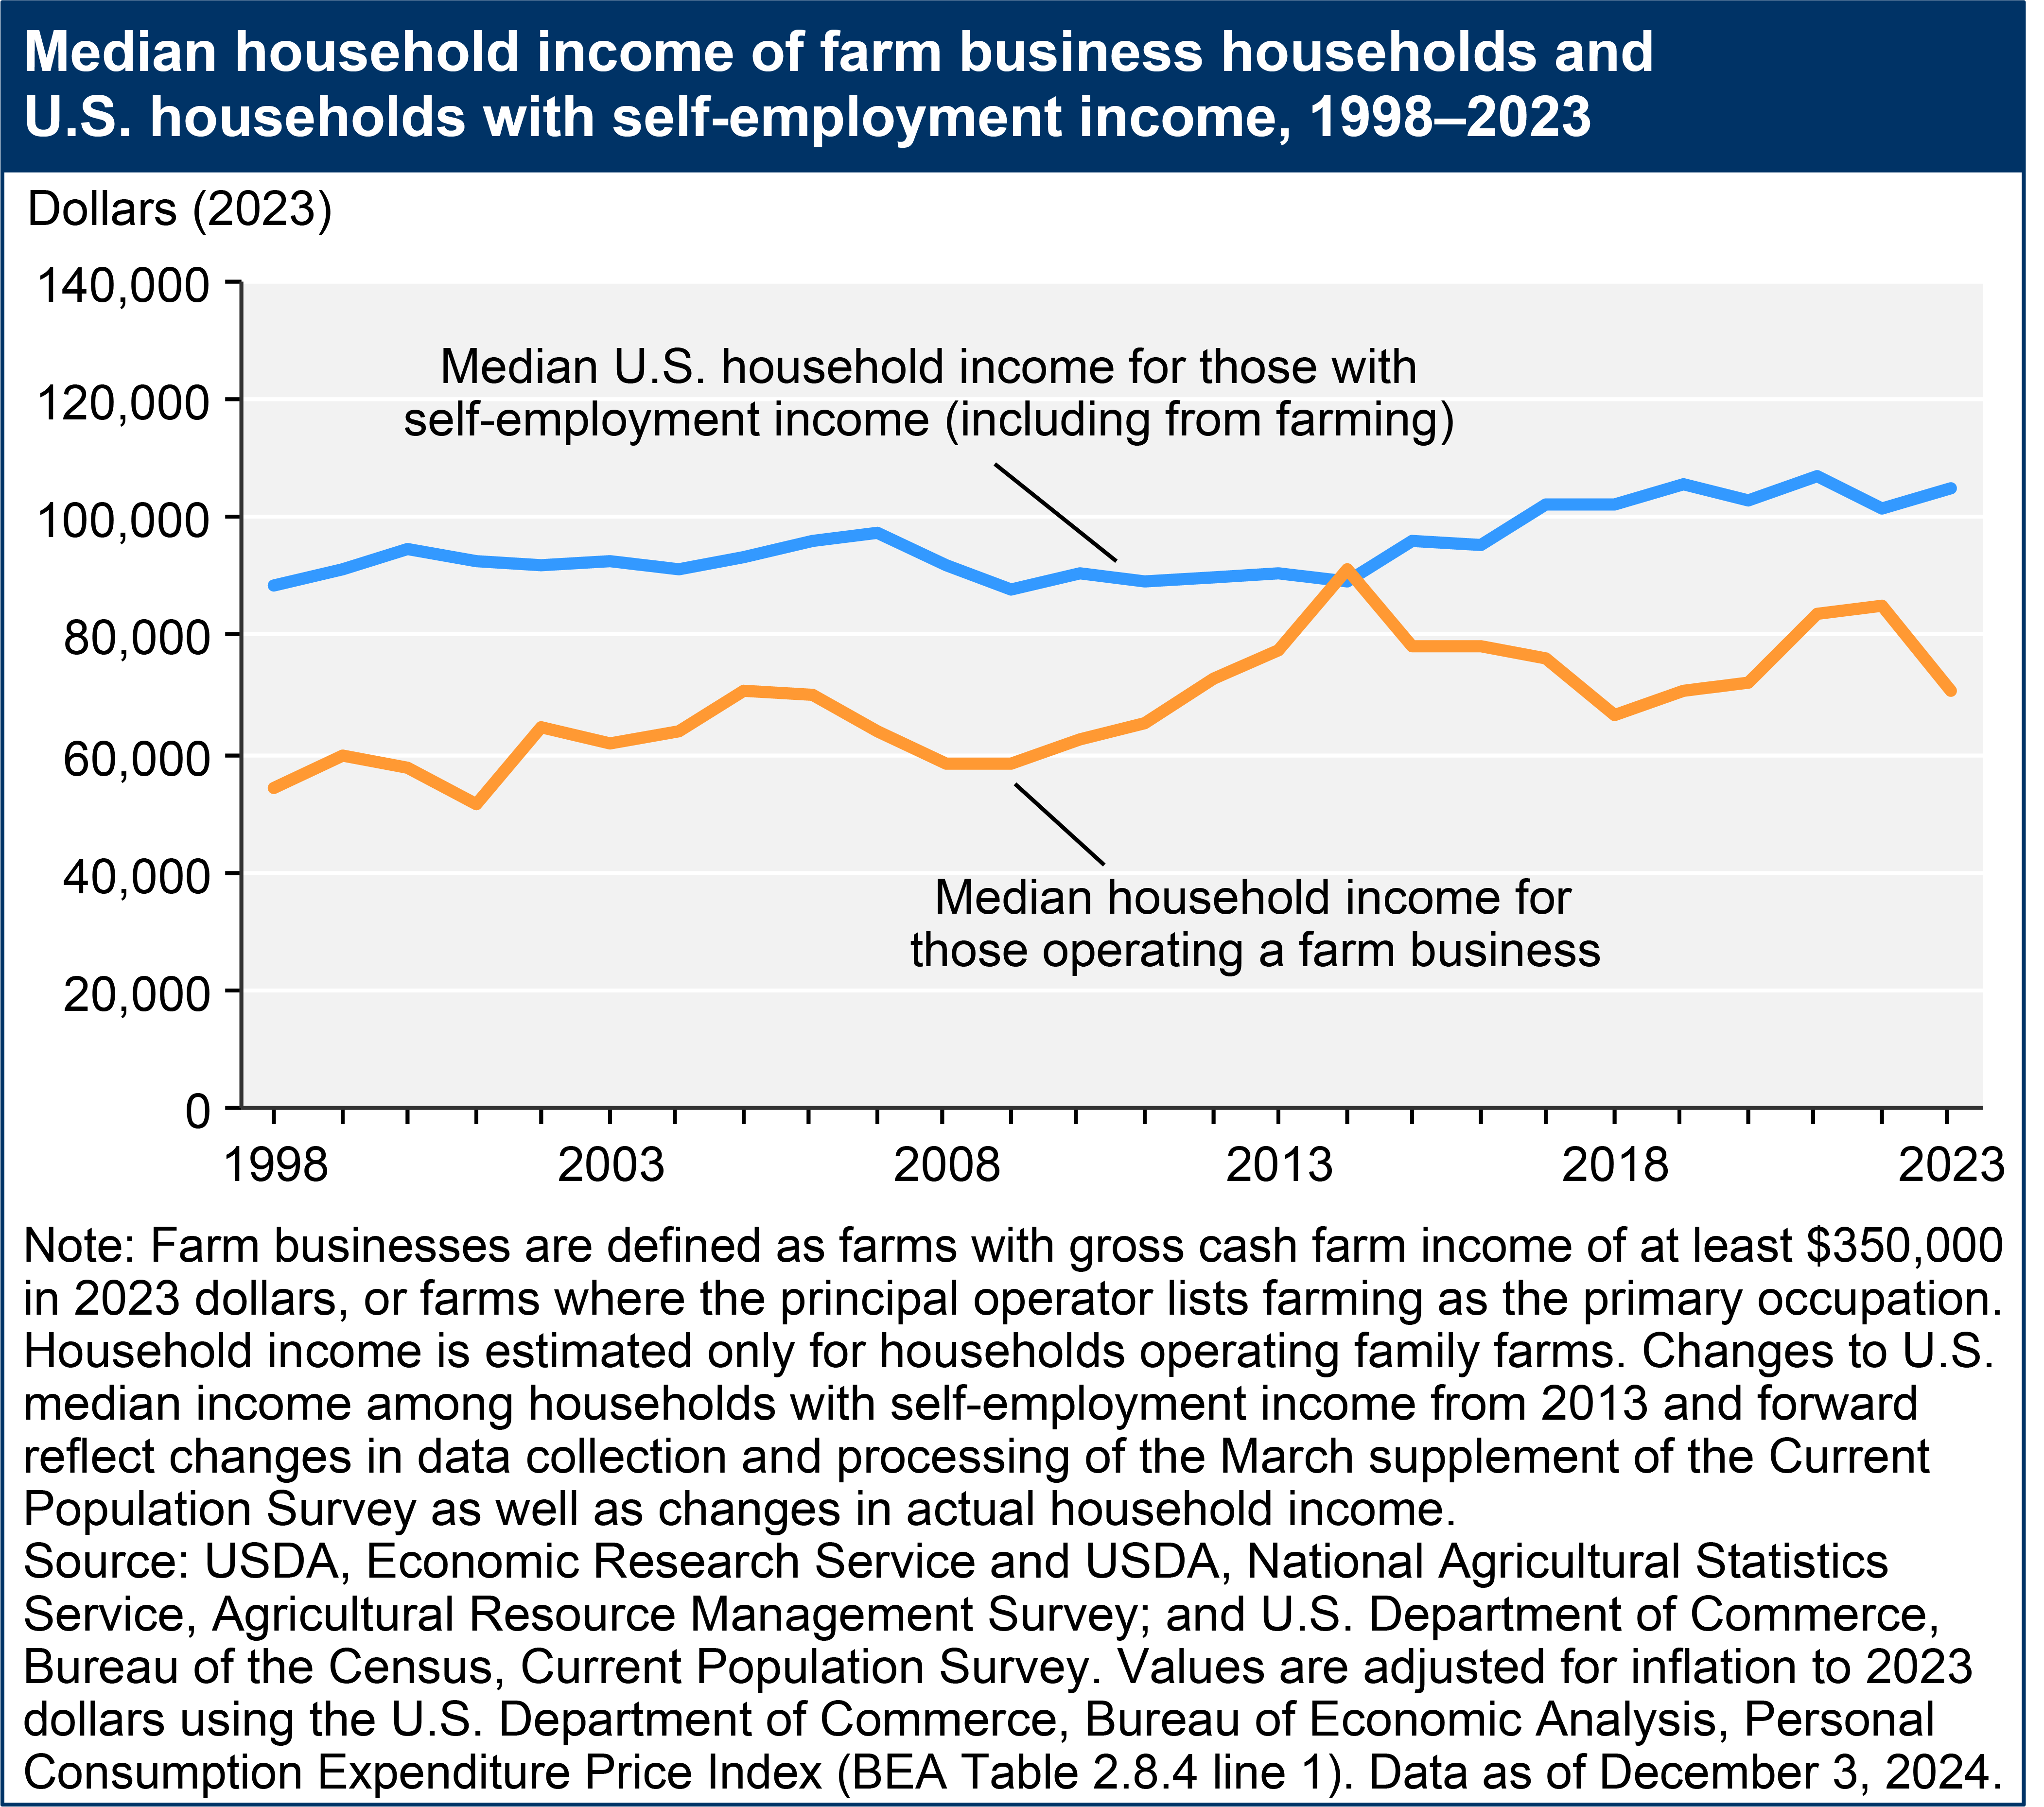
Although the median income of farm households has outpaced that of all U.S. households in recent years, operating a farm business carries considerable risk. Farm profits are subject to significant fluctuations and the income volatility of farm households is greater than that of all U.S. households. Therefore, it is useful to compare incomes of farm business households (i.e., households operating farms that report farming as their primary occupation plus commercial farms with at least $350,000 of gross cash farm income) with all self-employed households in the United States, using estimates from the Census Bureau's Current Population Survey.
Median farm business household income has remained below the income of self-employed households since 1997, except for 1 year, 2014. However, the gap between median farm and self-employed households has varied during this period. Between 1997 and 2014, farm business households saw an increase in their inflation-adjusted median incomes. In 1997, the median income of farm business households was $49,201 (in 2023 dollars), compared with $85,996 for self-employed households. In 2014, median income of farm business households exceeded that of all self-employed U.S. households ($91,437 versus $89,325 in 2023 dollars), but after 2014, median income of farm business households generally fell in real terms and relative to all self-employed U.S. households. In 2023, the median income of farm business households was $70,902, compared with $104,949 for self-employed households.

Download chart image | Chart data
Composition of Off-Farm Income
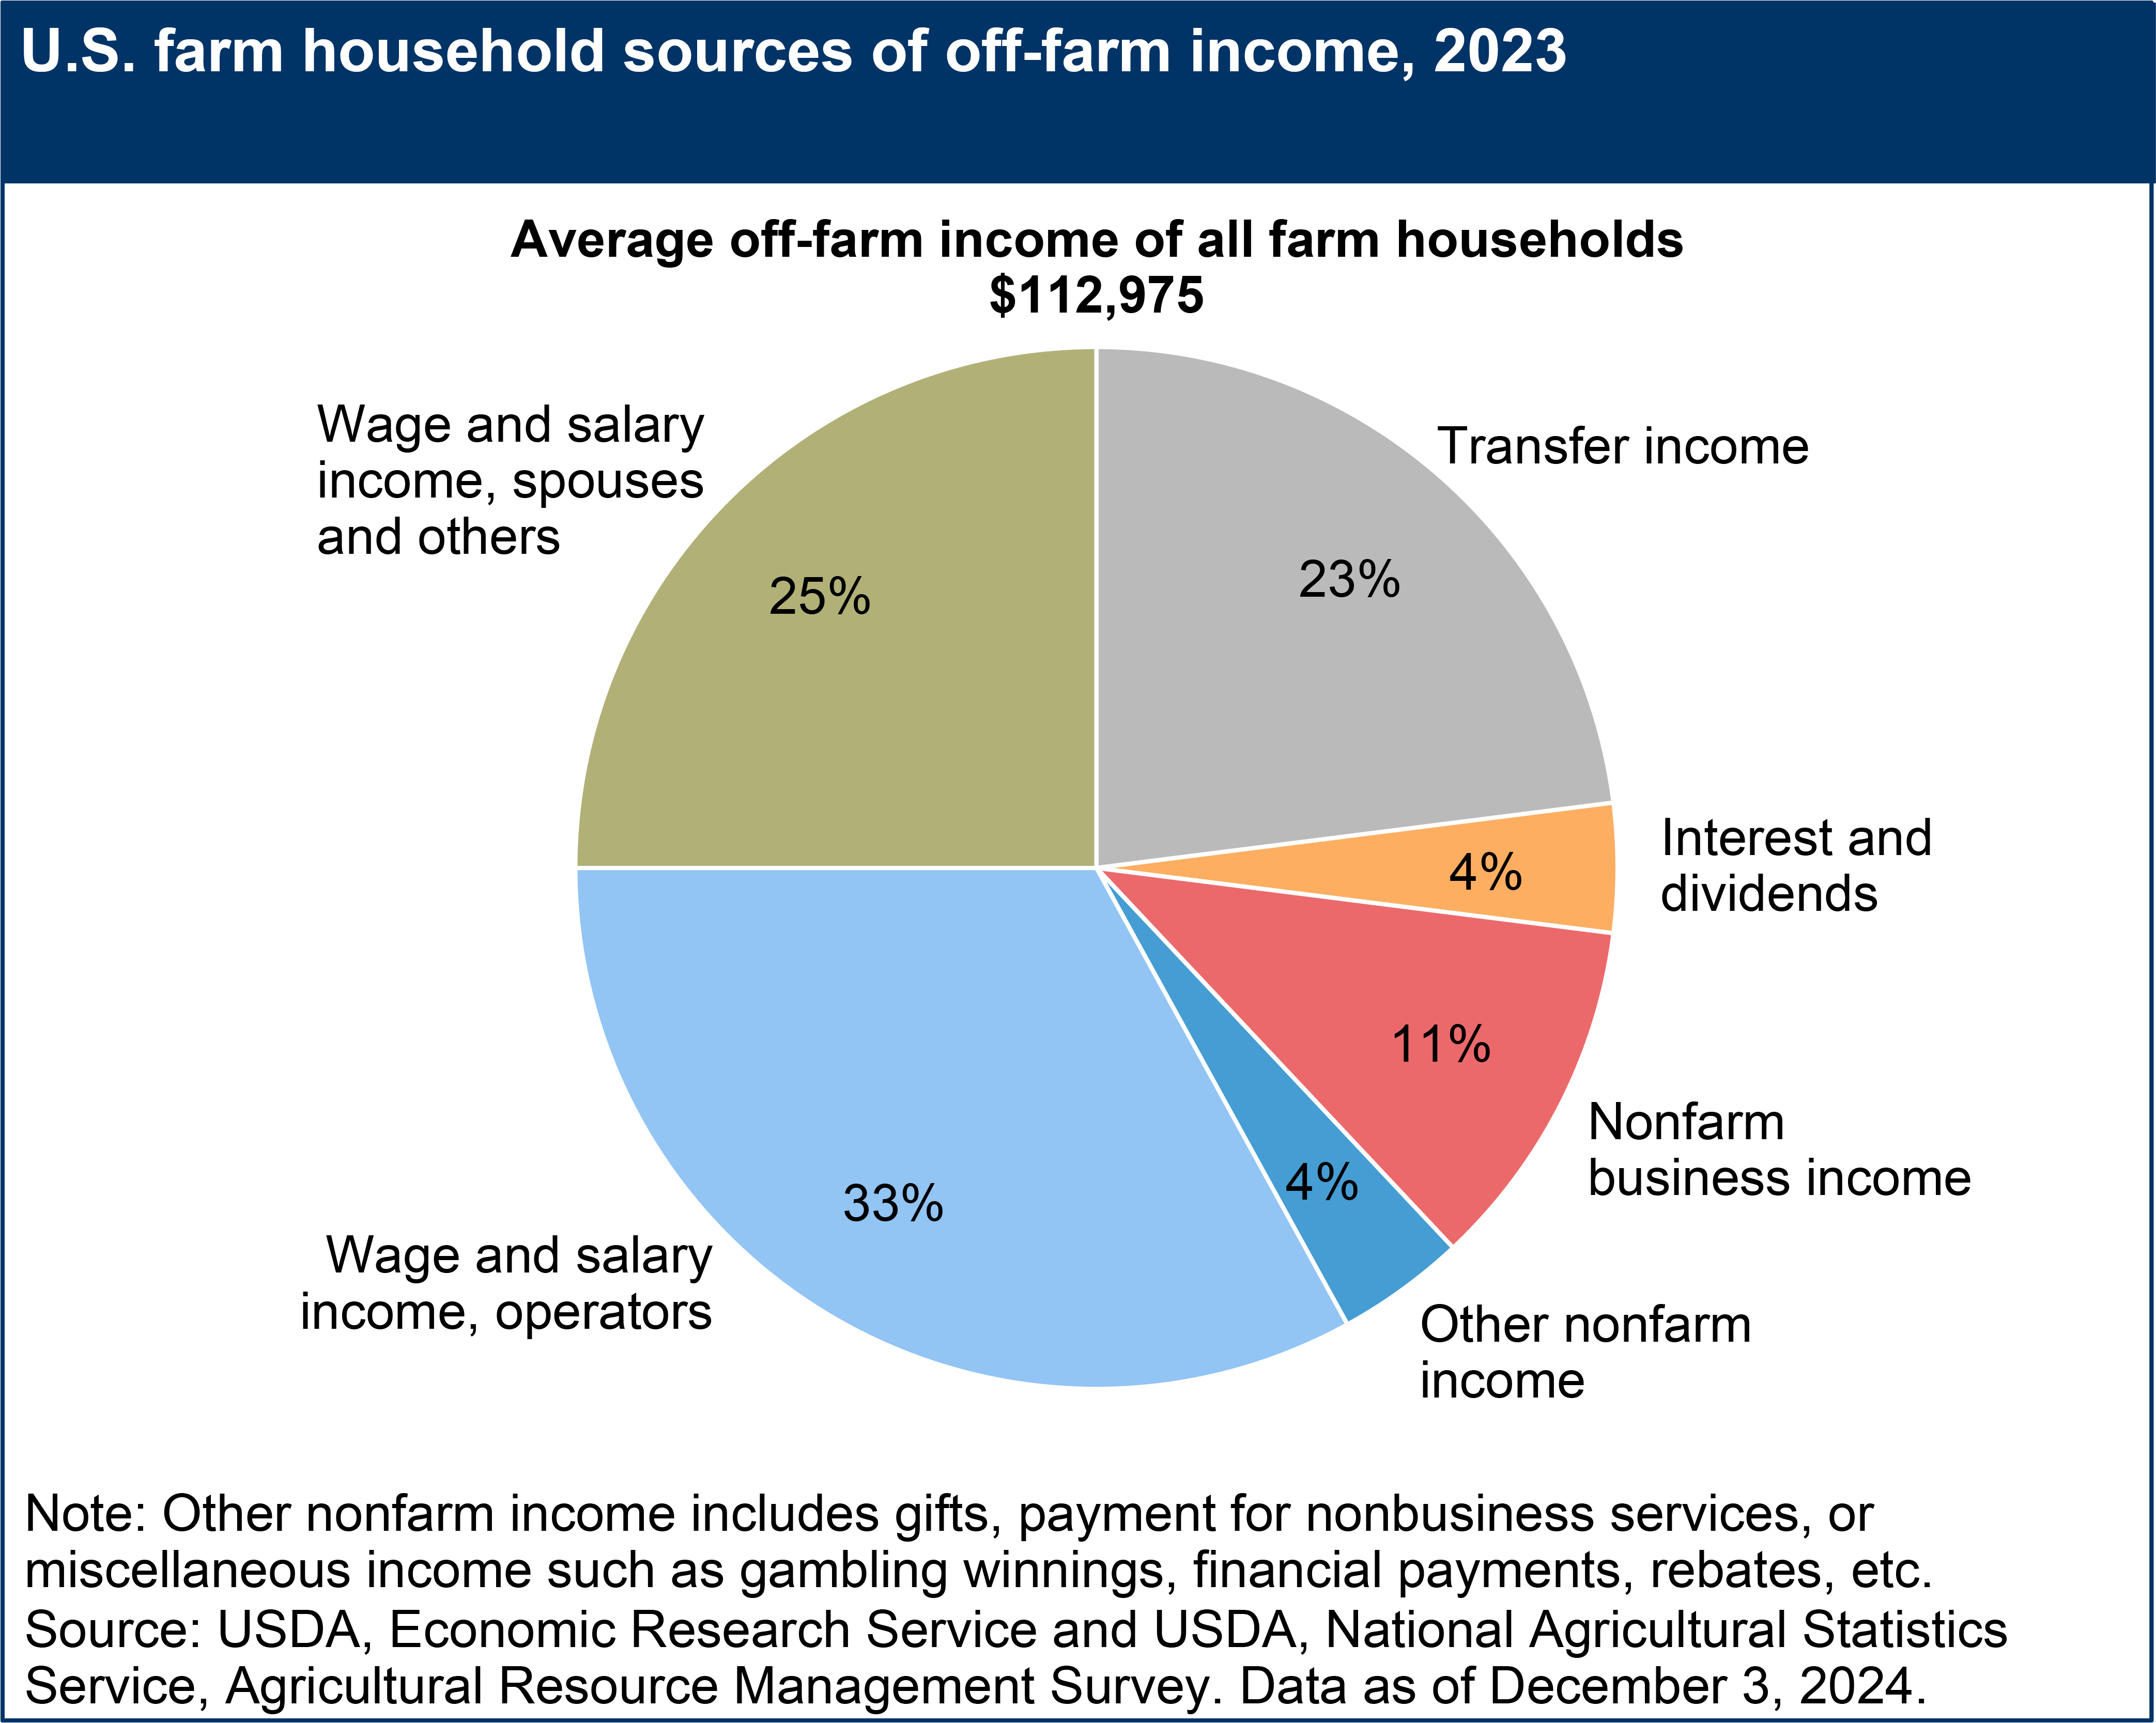
Most farm households operate residence farms and depend on off-farm (or nonfarm) income to cover at least some portion of their living expenses. Of the total off-farm income earned by all farm operator households, the majority (58 percent) comes from wages and salaries of household members (e.g., operators, spouses, and others), followed by transfers (e.g., Social Security) (23 percent), and earnings from nonfarm businesses (11 percent). The remaining 8 percent come from all other sources of off-farm income, such as interest and dividends.

Download chart image | Chart data
Farm Household Wealth and Income
Farm operator households have more wealth than the average U.S. household because significant capital assets, such as farmland and equipment, are generally necessary to operate a successful farm business. In 2023, the median U.S. farm household had $1,439,138 in wealth. Households operating commercial farms (those with gross cash farm income of at least $350,000) had $3.6 million in total wealth at the median, substantially more than the households of residence or intermediate farms.
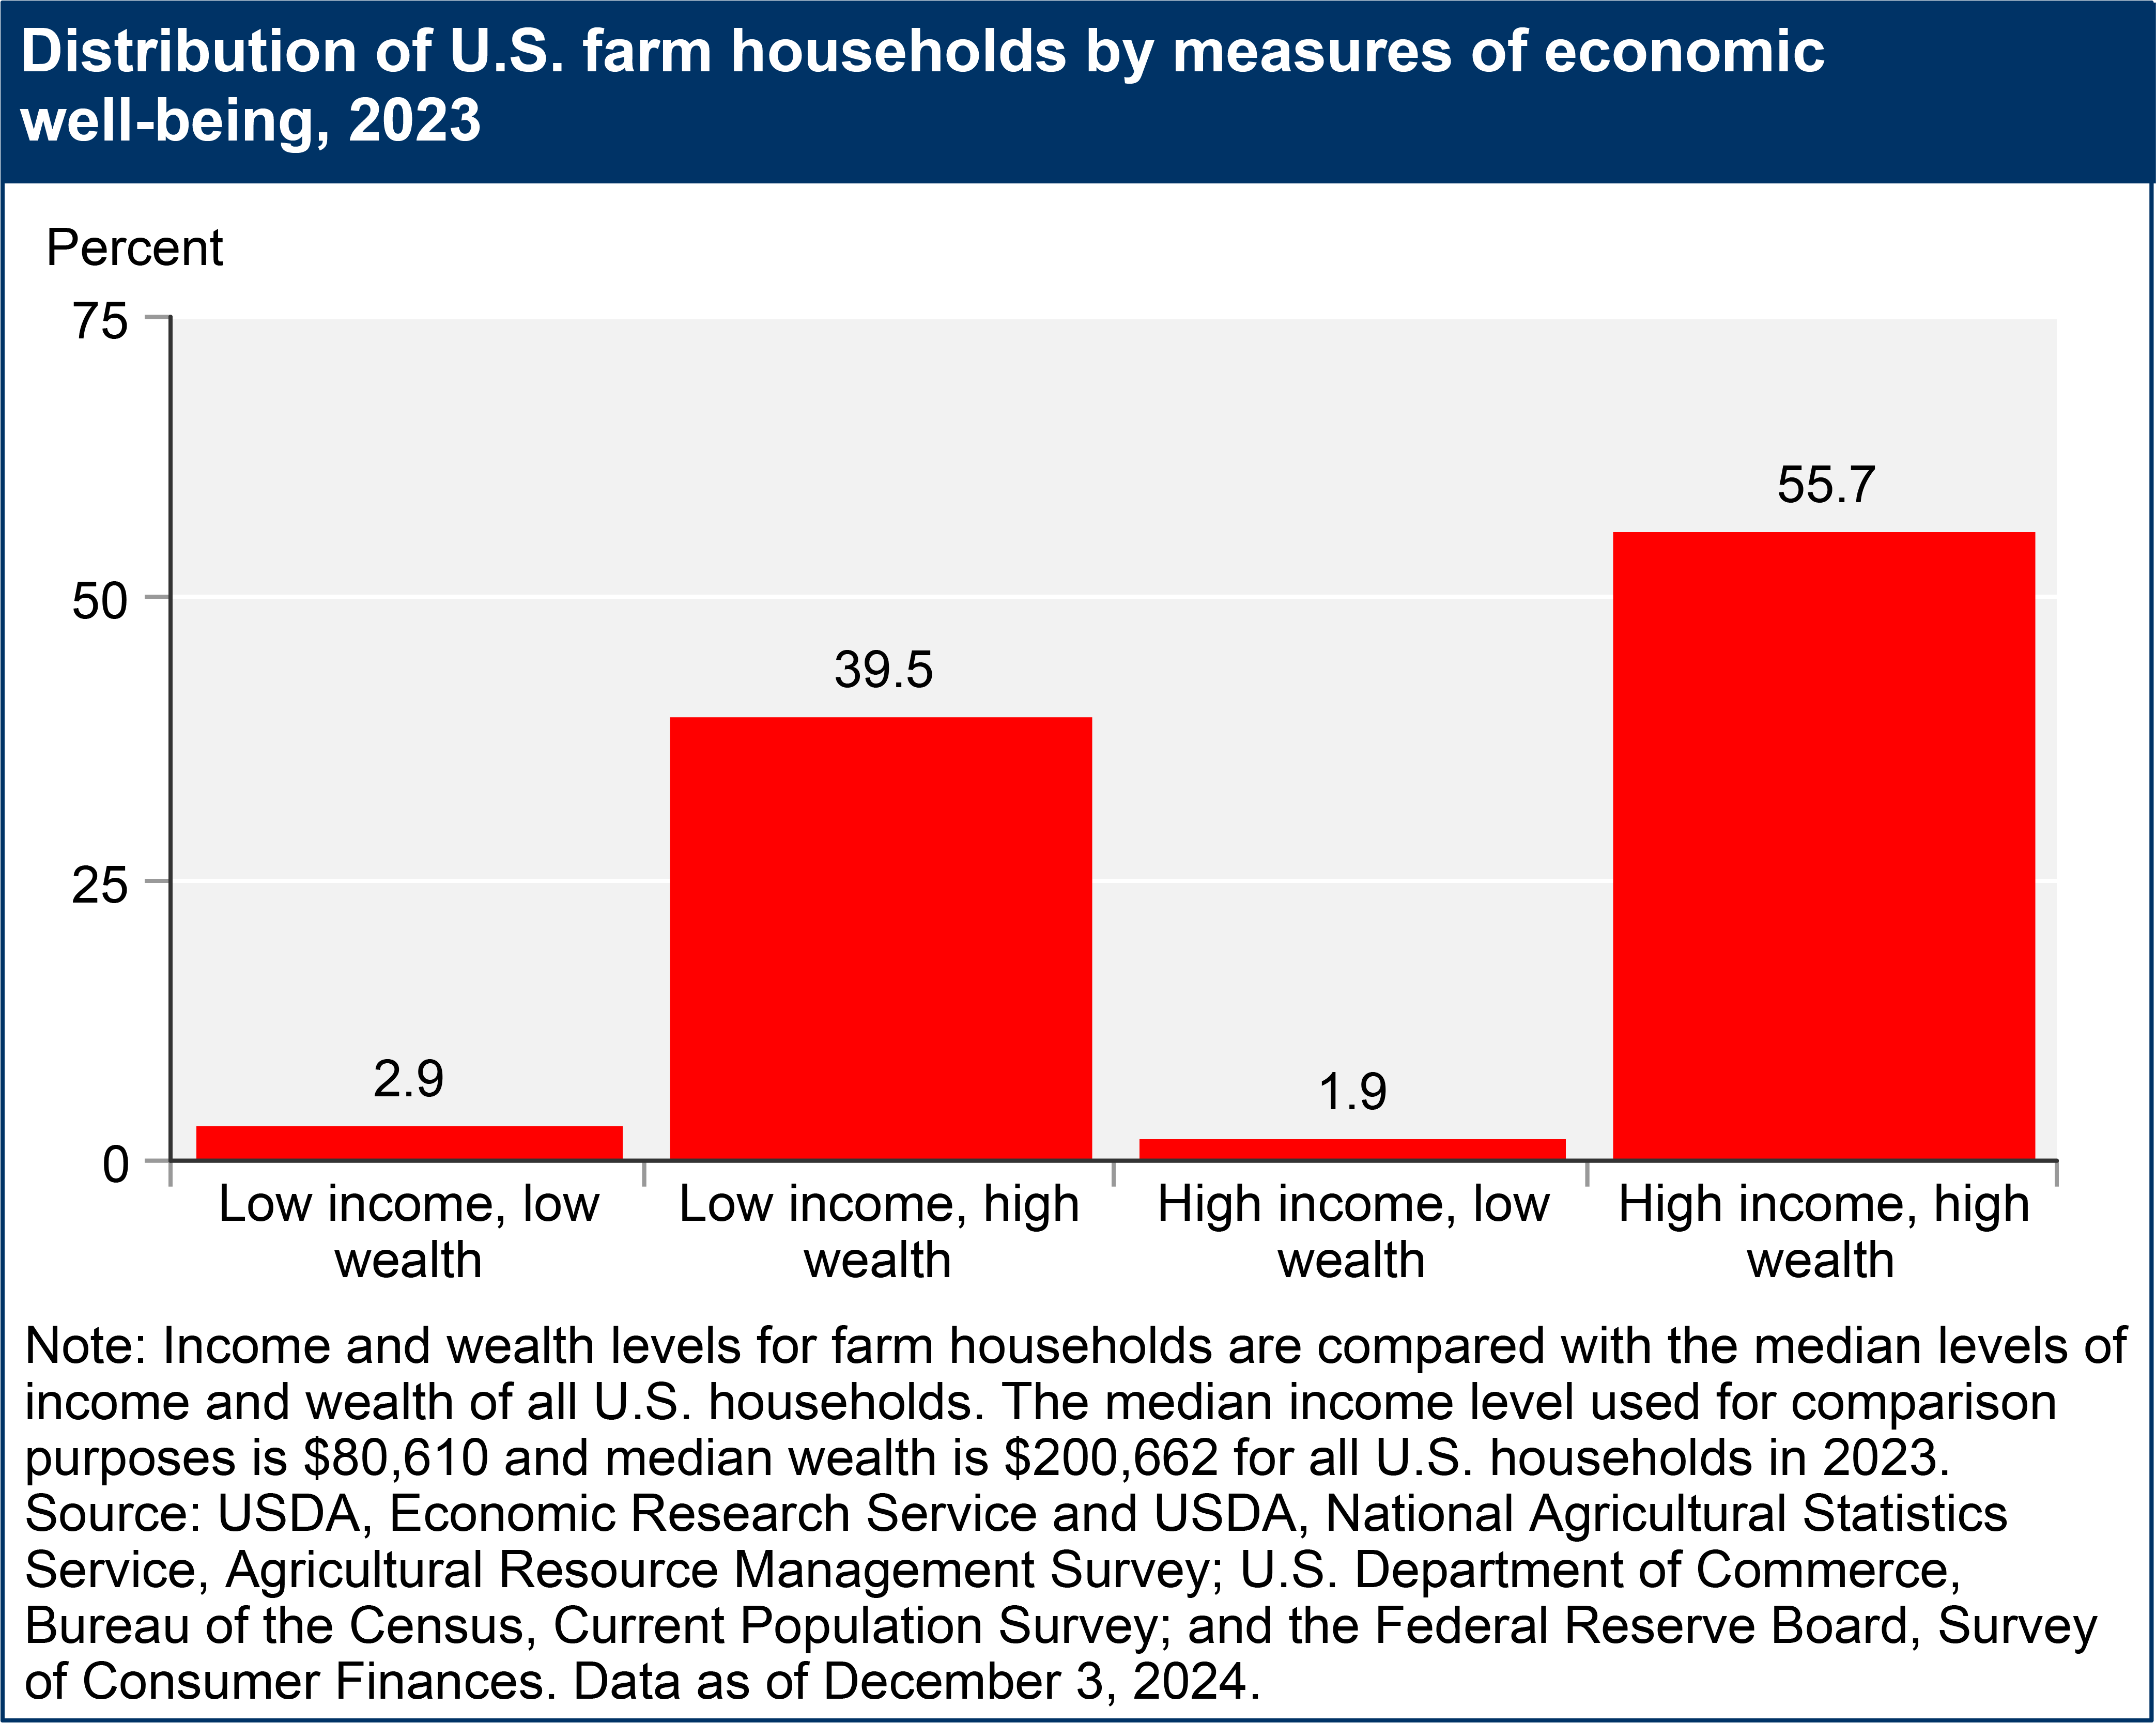
USDA, ERS divides farm households into four groups based on relative levels of income and wealth. The estimated medians of U.S. household income and wealth are used to divide low from high levels. Median income (or wealth) is the level at which 50 percent of households have greater income (or wealth) and 50 percent have less.

Download chart image | Chart data
Farm and other U.S. households differ in the pattern of wealth compared with income. In 2023, fewer than 5 percent of all farm households had wealth levels that were lower than the estimated U.S. median household level and over 95 percent had wealth levels higher than the U.S. median, in contrast to 50 percent in each group among all U.S. households. Around 40 percent of all farm households had higher wealth but lower income than the median among all U.S. households.
