ERS Charts of Note
Subscribe to get highlights from our current and past research, Monday through Friday, or see our privacy policy.
Get the latest charts via email, or on our mobile app for  and
and 
Thursday, April 25, 2024
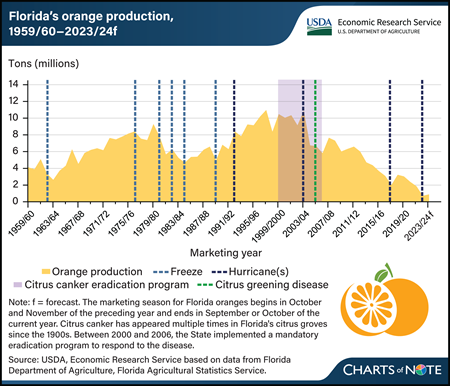
Florida’s citrus industry has long been susceptible to freezes, hurricanes, and disease. A series of devastating freezes in the 1970s and 1980s caused production to shift to more southern regions of the State. Then after near-record output in the 2003/04 season, subsequent events decreased Florida’s orange output at an average rate of 6 percent a year. Between 2004 and 2005, 4 hurricanes reduced the size of the orange crop and further spread citrus canker, a bacterial disease damaging to tree health and fruit quality, to previously unaffected areas. The Florida citrus industry faced an additional challenge in 2005, when citrus greening disease, a bacterial disease deadly to citrus trees, was first detected in its commercial groves. Citrus greening disease leads to premature fruit drop, unripe fruit, and eventual tree death. With no known cure, citrus growers use a variety of management strategies to protect young trees, increase tree immune response, sustain grove health, and improve fruit marketability. While these management strategies can partially offset yield losses, they increase the costs of production. Hurricanes in 2017 and 2022 dealt further damage to Florida’s citrus industry. Since 2003/04, bearing acreage of Florida’s orange trees has declined at an average rate of 3 percent per year. In April 2024, USDA forecast Florida’s orange 2023/24 production at 846,000 tons, 19 percent higher than the previous year but the second-lowest harvest in nearly 90 years. This chart updates information in the USDA, Economic Research Service Fruit and Tree Nuts Outlook, published in March 2023.
Wednesday, April 24, 2024
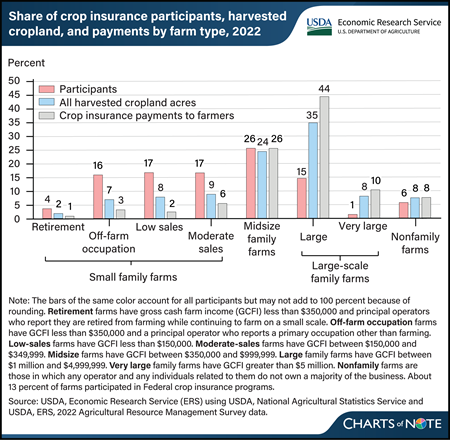
About 13 percent of U.S. farms participated in Federal crop insurance programs in 2022, with the highest share of participants coming from small family farms. The four types of small family farms (retirement, off-farm occupation, low sales, and moderate sales) accounted for 54 percent of the participants in Federal crop insurance programs and received 12 percent of the insurance payments. Small family farms harvested 26 percent of all cropland acres. On the other hand, midsize and large-scale family farm operators accounted for a slightly lower proportion of Federal crop insurance participants (42 percent) but harvested a majority of the U.S. cropland acres (67 percent) and received 80 percent of payments from Federal crop insurance. Larger farms like these account for 46 percent of agricultural acres operated in 2022. Researchers with USDA, Economic Research Service examined survey data and found that participation rates varied widely across commodity production. In 2022, 62 percent of farms producing row crops (cotton, corn, soybeans, wheat, peanuts, rice, and sorghum) purchased Federal crop insurance, while 9 percent of farms growing specialty crops, such as fruits, vegetables, and nursery crops, did the same. This chart appears in America’s Farms and Ranches at a Glance, published December 2023.
Tuesday, April 23, 2024
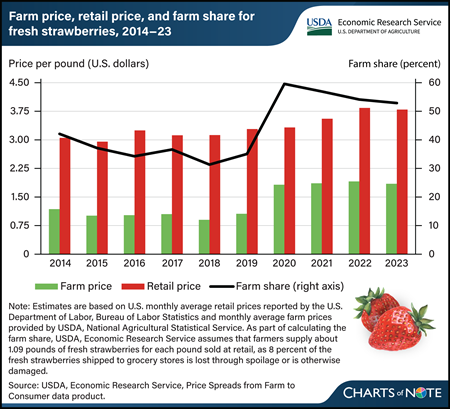
As summertime approaches, it may interest shoppers that U.S. farmers have received more than half of what consumers paid for fresh strawberries since 2020. In 2023, the average retail price for fresh strawberries was $3.80 per pound, a few cents less than in 2022, but about 52 cents more than in 2019 and 75 cents more than in 2014. Marketing costs, including payments to firms for packing, transporting, wholesaling, and retailing fresh strawberries, have been down since 2020. However, farm level prices, which factor into retail prices, have been generally higher. In the farm share calculations, USDA, Economic Research Service (ERS) estimates that about 8 percent of fresh strawberries is lost through spoilage and trimming, so it’s assumed marketers buy about 1.09 pounds of fresh strawberries from farmers for each pound they sell at retail. Using this adjusted volume, the farm share of the retail price—the ratio of what farmers receive to what consumers pay per pound in grocery stores—was 53 percent in 2023. More information on ERS farm share data can be found in the Price Spreads from Farm to Consumer data product, updated February 27, 2024.
Monday, April 22, 2024
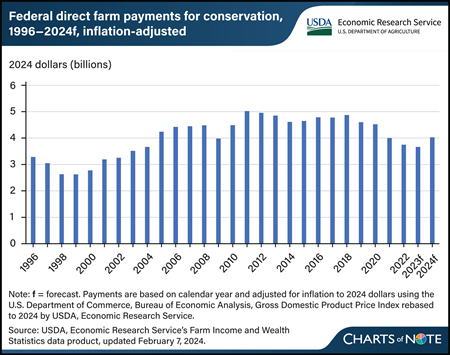
USDA, Economic Research Service (ERS) forecasts direct Federal payments for conservation programs for 2024 to increase by 10 percent, more than $363 million in inflation-adjusted terms, to $4 billion. This increase primarily is due to expected payments from the Inflation Reduction Act used to support various conservation programs. The act allocated $19.5 billion to support USDA conservation programs such as the Environmental Quality Incentives Program, the Regional Conservation Partnership Program, the Conservation Stewardship Program, the Agricultural Conservation Easement Program, and the Conservation Technical Assistance Program. Among this allocation is also the fund dedicated to measure, evaluate, quantify carbon sequestration and greenhouse gas emission reductions from conservation investments. These programs are aimed at helping farmers and ranchers expand conservation practices that reduce greenhouse gas emissions and increase storage of carbon in soil and trees. Conservation payments include programs under the management of the USDA, Farm Service Agency, such as the Conservation Reserve Program, as well as the USDA, Natural Resources and Conservation Service. ERS tracks Government payments made directly from the U.S. Government to farm sector recipients such as farm and ranch operators, contractors, and nonoperator landlords. The term “direct” emphasizes that there are no intermediaries acting between the U.S. Government and farm sector recipients, so insurance indemnities are excluded. The forecast conservation payments are in line with the 27-year average from 1996 through 2022 of $4.1 billion in inflation-adjusted dollars. However, despite the increase, forecast 2024 levels—if realized—are below the record for highest conservation payments of more than $5 billion in 2011. This chart is drawn from the ERS Farm Income and Wealth Statistics data product.
Thursday, April 18, 2024
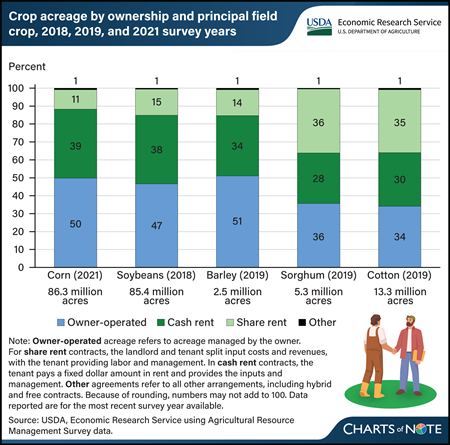
The proportion of farmland managed under a lease agreement and land that is managed by owner-operators varies across crops, according to data collected from Agricultural Resource Management Surveys (ARMS). Owner-operators farmed close to half of U.S. corn, soybean, and barley acres but roughly a third of sorghum and cotton acres. While both cotton and sorghum acreage were roughly evenly split among owner-operated, cash-rent, and share-rent agreements, share-rented farmland had a lower proportion of corn, soybean, and barley acreage. Cash contracts are those in which the tenant pays a fixed rent and provides both inputs and management, and share-based contracts are those in which the landlord and tenant split costs and revenues. Other agreements, such as hybrid arrangements, make up less than 1 percent of crops based on planted acreage in the survey year. Researchers with USDA, Economic Research Service (ERS) examined information supplied by farmers from ARMS across various crops to find that the overall trend in the farmland market favors cash-rented farmland. More information on land leasing can be found in the ERS report Farmland Rental and Conservation Practice Adoption, published in March 2024.
Wednesday, April 17, 2024
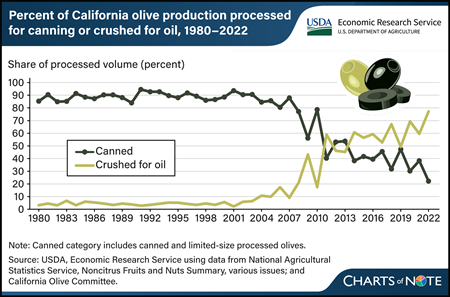
The turn of the century marked a shift in California’s olive industry. Historically, the State’s olive industry—which accounts for about 84 percent of olive acreage in the United States—was synonymous with canned olive production. Between 1980 and 2000, about 90 percent of California’s production was used for canned olives, most of which were of the black-ripe variety. California black-ripe olives are harvested green, before full maturity, and turn black from oxidation during processing. These shiny black-ripe olives are commonly sold as whole pitted or sliced canned products at retail or food service, where they often are used as pizza or salad toppings. Since the mid-2000s, the share of California’s olive production used to make olive oil has grown rapidly, from 10 percent in 2005 to more than 75 percent in 2022. This shift has been driven by increases in labor costs and import competition, as well as technological advancements that have made harvesting new olive oil-type cultivars comparatively quicker and less expensive. California olive oil production rose from 2 million pounds in 2006 to an average of 21 million pounds in 2021–23. Despite this increase in U.S. olive oil production, imports still supply more than 98 percent of the domestic consumption. This chart is based on the USDA, Economic Research Service Fruit and Tree Nuts Outlook Report, released March 2024.
Tuesday, April 16, 2024
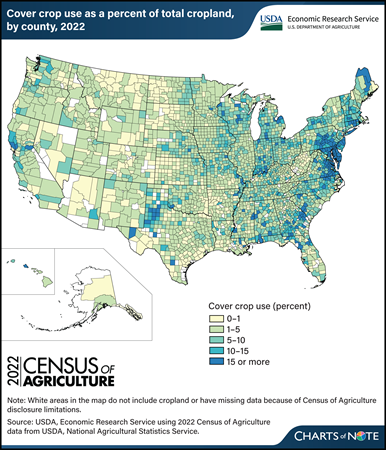
U.S. cropland area planted to cover crops increased 17 percent between 2017 and 2022, from 15,390,674 acres to 17,985,831 acres, data from the recently released Census of Agriculture show. That means cover crops were planted on 4.7 percent of total cropland in 2022. Producers often use cover crops to provide living, seasonal soil cover between the planting of two cash (commodity) or forage crops. Including cover crops in a rotation can provide benefits such as improved soil health and water quality, weed suppression, and reduced soil erosion. Regional differences in the use of cover crops are related to factors such as climate, soils, cropping systems, and State incentive programs. For example, Maryland, which has the highest rate of cover crop use, has programs that encourage farmers to grow cover crops to help improve water quality in the Chesapeake Bay. Cover cropping is more common in the southern and eastern parts of the U.S. because of soil and climate conditions, among other factors. It is more difficult to establish and grow cover crops in regions that are colder, receive less precipitation, and have a shorter growing season, so the western and northern parts of the United States have lower rates of cover crop use. One of the States with the greatest increase in cover crop acres as a proportion of total cropland from 2017 to 2022 was Texas, which also had the largest absolute increase in cover crop acreage. Cover crop acreage in Texas increased more than 50 percent (from 1,014,145 acres in 2017 to 1,550,789 acres in 2022). Cover crop use decreased in 2022 in some eastern States (Maryland, Georgia, North Carolina, New Jersey, Tennessee, and Kentucky). For more information about factors affecting U.S. cover crop adoption, see the USDA, Economic Research Service (ERS) report Cover Crop Trends, Programs, and Practices in the United States, published in February 2021. See also these ERS Charts of Note: Cover crop mixes account for 18 to 25 percent of major commodity acreage with cover crops, published in December 2022, and More farmers are adding fall cover crops to their corn-for-grain, cotton, and soybean fields, published in May 2022. For more Census of Agriculture data, see the USDA, National Agricultural Statistics Service’s 2022 Census of Agriculture.
Monday, April 15, 2024
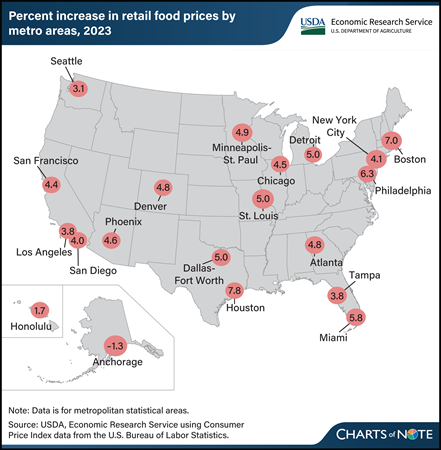
Retail food price inflation varies by locality. In 2023, food-at-home (grocery) prices rose the fastest in Houston, TX, by 7.8 percent, followed by Boston, MA, at 7.0 percent. In contrast, food-at-home prices declined by 1.3 percent in 2023 in Anchorage, AK, and rose by the lowest amount (1.7 percent) in Honolulu, HI. Across the United States, food-at-home prices increased by 5.0 percent on average in 2023. Differences in retail overhead expenses, such as labor and rent, can explain some of the variation among cities, because retailers often pass local cost increases to consumers in the form of higher prices. Furthermore, differences in consumer purchasing patterns for specific foods may help explain variation in inflation rates among cities. Products that consumers purchase vary regionally, and each metro area’s inflation rate is calculated based on a representative set of foods unique to the area. For example, an area whose residents purchase more foods with slower price inflation (such as fresh fruits and vegetables at 0.7 and 0.9 percent average growth in 2023, respectively) might experience lower food-at-home price inflation than an area whose residents buy more cereals and bakery products or nonalcoholic beverages, which increased by 8.4 percent and 7.0 percent, respectively, in 2023. This chart is drawn from the USDA, Economic Research Service Food Price Environment: Interactive Visualization, last updated in February 2024, which presents the 10-year average change in prices by metro area and provides context for the Food Price Outlook data product.
Thursday, April 11, 2024
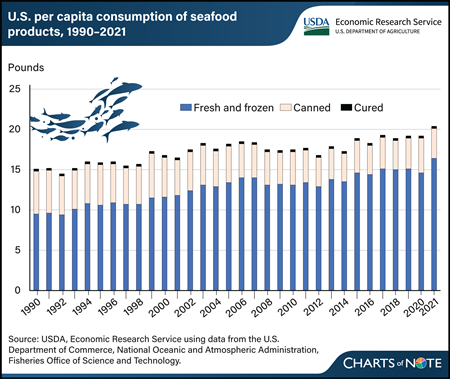
U.S. residents consumed an average of 20.5 pounds of seafood— finfish and shellfish—per capita in 2021. The U.S. Department of Commerce, National Oceanic Atmospheric Administration (NOAA) Fisheries Office of Science and Technology publishes annual consumption estimates for seafood produced through aquaculture and captive fisheries, domestically as well as those imported from other countries. Over the last three decades, demand for farm-raised and wild-caught seafood has expanded as consumers’ tastes and preference for finfish and shellfish have increased. Per capita seafood consumption grew 30 percent in this period, led by fresh and frozen seafood. Growth in fresh and frozen seafood consumption per capita climbed from about 63 percent in 1990 to almost 80 percent in 2021. In contrast, per capita consumption of canned seafood has declined from a 35-percent share in 1990 to an 18-percent share of the total seafood consumed nationwide in 2021. Cured seafood consumption remained constant throughout the period of observation. According to NOAA, about 80 percent of all seafood consumed in the United States is estimated to come from imported products. This chart is drawn from the USDA, Economic Research Service Aquaculture topic page.
Wednesday, April 10, 2024
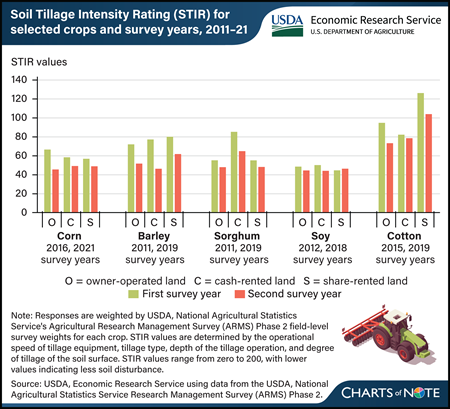
USDA, Economic Research Service (ERS) researchers investigated whether tillage practices were different between farmers who were renters or farmers who owned the land. Farming systems that decrease soil disturbance and preserve more crop residue than conventional tillage may improve the soil, but these practices have upfront costs (in new machinery, for instance), and any soil health benefits captured by the operator may be delayed into the future, perhaps until after a new renter has taken over the land. For this reason, renters may be less inclined to adopt tillage practices that decrease soil disturbance. Researchers examined tillage practices as measured by the Soil Tillage Intensity Rating (STIR) values for five major crops (corn, soybeans, cotton, barley, and sorghum). STIR values are determined by the operational speed of tillage equipment, tillage type, depth of the tillage operation, and degree of disturbance of the soil surface. STIR values range from zero to 200, with lower values indicating less soil disturbance. Over the two survey years specific for each, both crop owner-operators and renters generally showed reductions in STIR values. For instance, on sorghum acres, the estimated average STIR value of owner-operators was 55 in 2011 and 48 in 2019. Both cash and share renters also reported engaging in practices that led STIR values to fall, with values by cash renters falling the most. Researchers found that all three groups exhibited similar rates of tillage intensity, indicating that they are responding to economic incentives presented by reduced tillage systems similarly. This can be attributed to the fact that although soil health benefits may only be seen in the medium-to-long term, reducing soil disturbance can result in time and energy savings immediately. This chart can be found in the ERS report Farmland Rental and Conservation Practice Adoption, published in March 2024.
Tuesday, April 9, 2024
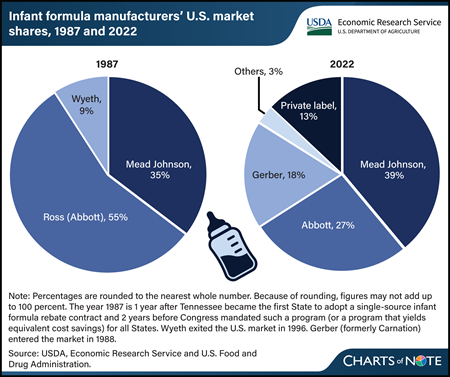
State agencies that administer USDA’s Special Supplemental Nutrition Program for Women, Infants, and Children (WIC) use competitive, single-source contracts to reduce the cost of infant formula. These contracts provide significant discounts in the form of manufacturer rebates for each can of formula purchased through WIC. Infants who receive formula through WIC consume more than half of all infant formula in the United States. The manufacturer holding the WIC contract in a State sells the most infant formula in that State, including to consumers not participating in WIC. The infant formula market is highly concentrated. However, comparing market shares over time indicates that the market has become less concentrated. In 1987, the year of the first rebate contract and 2 years before Federal law required that WIC State agencies use cost containment systems, three manufacturers accounted for 99 percent of sales of infant formula in the United States. In 2022, three manufacturers accounted for 83 percent of sales of infant formula. In addition to WIC contracts with manufacturers, other factors influence infant formula market concentration, such as regulation of formula manufactured inside the United States and import restrictions on formula manufactured outside the United States. Entrances and exits of manufacturers and changes in their market shares over time suggest these factors impact firms differently. This chart appears in the USDA, Economic Research Service report The Special Supplemental Nutrition Program for Women, Infants, and Children (WIC): Background, Trends, and Economic Issues, 2024 Edition, published in February 2024.
Monday, April 8, 2024
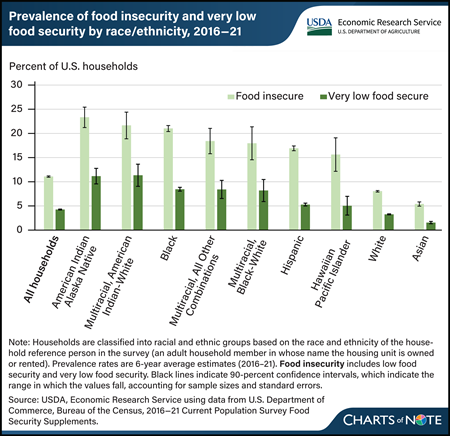
From 2016 to 2021, 11.1 percent of U.S. households experienced food insecurity, meaning they had difficulty providing enough food for all their members because of a lack of resources. Over the same period, 4.3 percent of U.S. households experienced very low food security, a more severe form of food insecurity in which food intake is reduced and eating patterns are disrupted. The prevalence of food insecurity during 2016–21 varied by race and ethnicity. Households headed by a reference person who identified as American Indian and Alaska Native (23.3 percent); Multiracial, American Indian-White (21.7 percent); Black (21.0 percent); Multiracial, All Other Combinations (18.4 percent); Multiracial, Black-White (18.0 percent); Hispanic (16.9 percent); and Hawaiian and Pacific Islander (15.6 percent) had significantly higher rates of food insecurity than the all-household average. The prevalence of food insecurity for households headed by a White (8.0 percent) or an Asian (5.4 percent) reference person was significantly lower than the all-household average. The prevalence of very low food security followed a similar pattern and was statistically significantly different from the all-household prevalence for most race and ethnicity categories. It was not significantly different for Hawaiian and Pacific Islander households. Very low food security ranged from 1.6 percent for Asian households to 11.3 percent for Multiracial, American Indian-White households. Meaningful differences in food insecurity exist across and within racial ethnic groups. Related data are available in the USDA, Economic Research Service report Household Food Insecurity Across Race and Ethnicity in the United States, 2016–21, published in April 2024.
Thursday, April 4, 2024
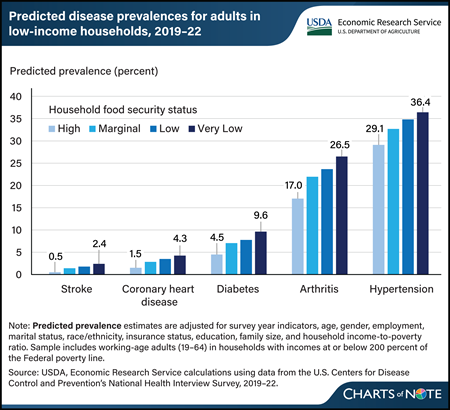
From 2019–22, the predicted prevalence of five selected chronic diseases was 1.9 to 9.5 percentage points higher for adults in very low food-secure households than those in high food-secure households. Researchers at USDA, Economic Research Service (ERS) recently updated estimates of the relationship between food security status and chronic disease among working-age adults in U.S. households with incomes at or below 200 percent of the Federal poverty level. They looked at the prevalence of stroke, coronary heart disease, diabetes, arthritis, and hypertension across four levels of household food security, ranging from high food security (households that reported no problems with or anxiety about being able to consistently obtain adequate amounts of food) to very low food security (in which eating patterns of one or more household members were disrupted and food intake was reduced). Adults in households that were less food secure were more likely to have one or more chronic disease, and the likelihood increased as food insecurity worsened. The prior data from 2011–15 and the more recent data from 2019–22 demonstrate a close link between food security status and health. This chart updates information in the ERS report Food Insecurity, Chronic Disease, and Health Among Working Age Adults, published in July 2017.
Wednesday, April 3, 2024
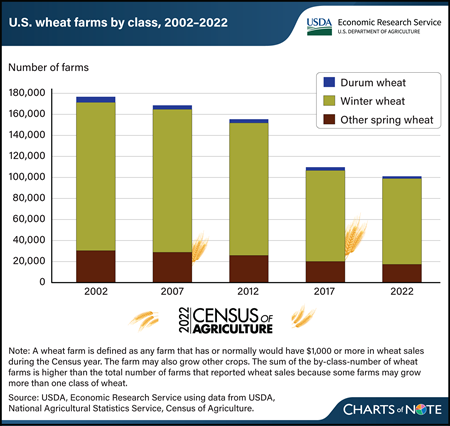
The number of farms producing wheat for grain declined substantially from 2002 to 2022, according to new data from USDA, National Agricultural Statistics Service (NASS) 2022 Census of Agriculture. In 2022, the number of U.S. farms reporting wheat production was 97,014, a 43-percent decrease compared with the 2002 census, when 169,528 farms reported wheat production. The reduction in the number of farms producing wheat was spread across all classes of wheat. The number of farms producing winter wheat—84 percent of U.S. wheat farms in 2022—dropped by nearly 60,000, or 42 percent, between the 2002 and 2022 censuses. Farms producing durum wheat decreased by the largest percentage, down 59 percent from 2002. The number of farms growing spring wheat (other than durum) declined 43 percent from 2002 to 2022. During the same time period, total volume of U.S. wheat produced trended down slightly, largely because of less acreage being harvested. As the profitability of other crops rises, wheat is increasingly planted in rotation with more profitable corn or soybean crops. Among major wheat-producing States, Kansas, which accounts for 15 percent of all U.S. wheat farms, saw a reduction of 9,716 farms—a 40-percent decrease from 2002 to 2022. Texas and Oklahoma reported decreases of 54 and 47 percent, respectively, between 2002 and 2022. Together, these 3 States harvested nearly 32 of percent of the volume of winter wheat produced in 2022, according to data reported by NASS in the Small Grains Annual report. For more details on the 2022 Census of Agriculture, see the NASS Census of Agriculture website. Information on trends in the wheat production sector can be found in the special article, “U.S. Census of Agriculture: Highlighting Changing Trends in Wheat Farming” in USDA, Economic Research Service’s March 2024 Wheat Outlook.
Tuesday, April 2, 2024
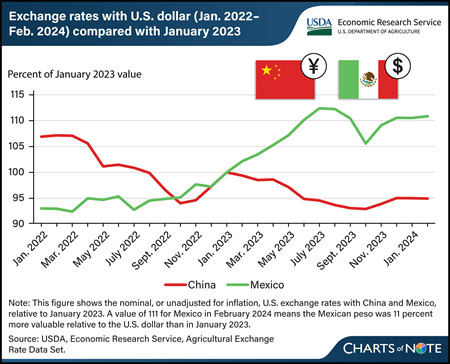
China and Mexico are the top two markets for U.S. agricultural exports by dollar value. Exchange rates are one of several factors that can influence U.S. agricultural trade. All else being equal, a stronger foreign currency favors U.S. exports to that country, and vice versa. For the past 2 years, China’s yuan has depreciated (has become less valuable) relative to the U.S. dollar, implying a weaker value of U.S. exports to China. The opposite has been true for the Mexican peso. The U.S. dollar appreciated in value relative to the currencies of many countries, including China, because of U.S. Federal Reserve interest rate increases during this period. The Mexican peso was an exception to this, as the Bank of Mexico increased interest rates more aggressively and earlier than the Federal Reserve did for U.S. interest rates. In addition, the Mexican government’s comparatively smaller stimulus response to the Coronavirus (COVID-19) pandemic in 2020 and 2021 and optimism regarding nearshoring—in which U.S. companies relocate operations to neighboring Mexico from China—has helped strengthen the peso, according to the Federal Reserve Bank of Dallas. From the perspective of U.S. farmers and agribusinesses, the decrease in the value of the yuan and increase in the value of the peso is generally associated with a decrease in export opportunities to China and an increase in export opportunities to Mexico. Not adjusting for inflation, U.S. agricultural exports to China decreased in value to $33.7 billion in fiscal year (FY) 2023 from $36.2 billion the previous year and are forecast to fall further to $28.7 billion in FY 2024. U.S. agricultural exports to Mexico increased in value from $28.0 billion to $28.2 billion from FY 2022 to 2023 and are forecast at a record high of $28.4 billion for FY 2024. This chart is drawn from USDA, Economic Research Service’s Agricultural Exchange Rate Data Set, February 2024.
Monday, April 1, 2024
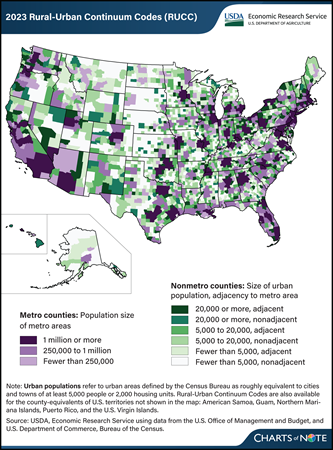
The USDA, Economic Research Service (ERS) has updated its Rural-Urban Continuum Codes (RUCC), which classify all U.S. counties into nine categories from most urban to most rural. The RUCC distinguish U.S. metropolitan (metro) counties by the population size of their metro area and nonmetropolitan (nonmetro) counties by their degree of urbanization and adjacency to a metro area. The RUCC allow researchers and policymakers to add nuance to their county-level analyses by incorporating the population of the Census Bureau’s urban areas with the OMB’s definition of metropolitan counties. The most urban counties belong to metro areas (shown in purple on the map). These are divided into three categories based on the total population of the metro area. Counties that are commonly considered rural are those that do not belong to metro areas (shown in green on the map). The RUCC classify these nonmetro counties into six categories based on the number of people who live in urban areas (small cities or towns) and whether the county is adjacent to a metro area. The most urban of the nonmetro counties are those that had urban area populations of at least 20,000 and are most prevalent in regions such as the Northeast, Great Lakes, and along the coasts. The most rural of the nonmetro counties had urban area populations of fewer than 5,000 and are the most prevalent in the Great Plains and Corn Belt. Counties classified as adjacent to metro areas are considered more urban than their nonadjacent counterparts because their residents have greater access to the diverse employment opportunities, goods, and services available in metro areas. For more information on the RUCC, please see the ERS data product Rural-Urban Continuum Codes.
Thursday, March 28, 2024
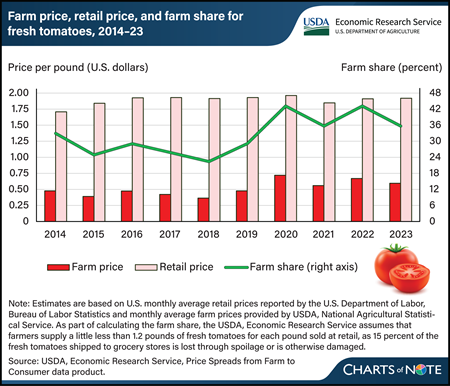
For the fourth straight year, the U.S. farm share of retail prices for fresh, field-grown tomatoes remained above 35 percent in 2023. The farm share is the ratio of what farmers receive to what consumers pay per pound in grocery stores. Retail prices have been mostly stable near $1.92 per pound since 2016. This stability has occurred despite generally higher farm prices since 2020. Farm prices, the amount growers received per pound of fresh tomatoes, fell 7 cents in 2023 from 2022, based on a simple average of monthly prices. USDA, Economic Research Service (ERS) estimates farm-to-retail price spreads for field-grown, fresh-market tomatoes using a simple average of monthly retail prices reported by the U.S. Department of Labor, Bureau of Labor Statistics and monthly farm-level prices reported by the USDA, National Agricultural Statistical Service (NASS). This approach gives equal weight to all months of the year. Same-month farm prices were lower during much of 2023 compared with 2022. However, production is seasonal. In 2023, farm prices were higher during peak domestic production periods than they were during the same periods in 2022. NASS season average price data show farm prices were up about 3.5 cents per pound on an annual basis that gives more weight to months with greater domestic production. The farm share of retail prices would have been even higher in 2023 if viewed on this basis. More information on ERS farm share data can be found in the Price Spreads from Farm to Consumer data product, updated February 27, 2024.
Wednesday, March 27, 2024
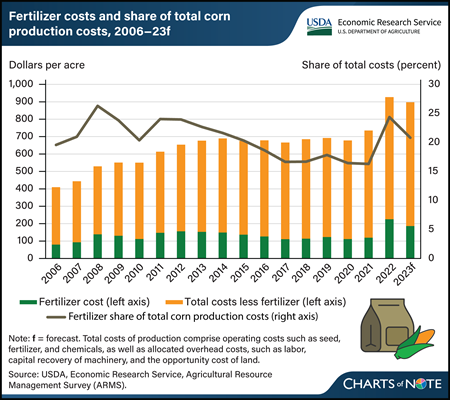
Fertilizer is one of several inputs corn growers buy in the months before April and May, when most U.S. corn acres are planted. Historically, fertilizer is typically the largest variable expense associated with corn production. Every May, USDA’s Economic Research Service (ERS) reports production costs, including fertilizer, for corn and other major commodities in the Commodity Costs and Returns data product. Although fertilizer costs have varied over time, the average cost of fertilizer per acre from 2006 to 2021 was around $125, not adjusting for inflation. Costs jumped to an average of $225.78 per acre in 2022, and then fell to an estimated $186.73 in 2023. This represents an 89-percent increase from 2021 to 2022 followed by a decrease of 17 percent from 2022 to 2023. In addition to fertilizer expenses, other costs of production reported in the data include operating costs, such as seed, fuel, and chemicals, as well as allocated overhead costs, such as labor, capital recovery of machinery, and the opportunity cost of land—a category that reflects rent or income that might have been earned from renting out the land when the land is owned. Fertilizer costs accounted for about 22 percent of total corn production costs per acre from 2006 to 2016, then fell to historical lows averaging around 17 percent from 2017 to 2021. In 2022, price spikes resulted in fertilizer costs jumping to about 24 percent of total costs. While elevated, fertilizer expenses as a share of total costs remained lower in 2022 compared with 2008, when they were 26 percent of total costs. From 2022 to 2023, total corn production costs remained elevated compared with 2021 and before, even as fertilizer costs declined. Iowa prices published by USDA’s Agricultural Marketing Service for the most commonly used fertilizers anhydrous ammonia, urea, and liquid nitrogen (32 percent) show decreases from 2023 to 2024, with slight upticks in the second reporting period of February. Cost of production data for 2023 is set to be released on May 1, 2024. This chart is drawn from the ERS Commodity Costs and Returns data product.
Tuesday, March 26, 2024
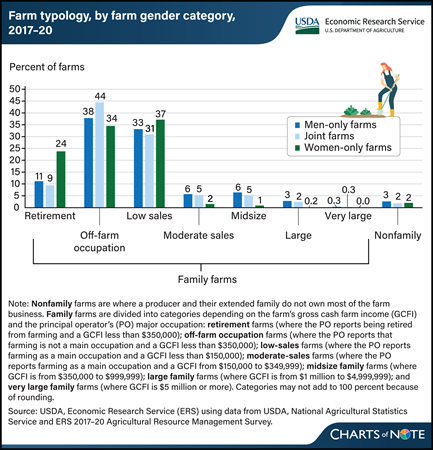
Most farms operated only by women are retirement, off-farm occupation, or low-sales farms, according to findings by researchers with USDA, Economic Research Service (ERS). After examining 2017–20 data from the Agricultural Resource Management Survey (ARMS), researchers found that a greater share of farms operated only by women were retirement farms compared with the shares operated only by men or by men and women jointly, 24 versus 11 and 9 percent, respectively. Retirement farms generate annual gross cash farm income (GCFI) of less than $350,000 with principal operators who report they are retired from farming. Three percent of men-only operations were large family farms (with GCFI of $1 million to $4,999,999), compared to 2 and 0.2 percent of farms operated jointly by men and women, or only women respectively. The ARMS data also show that 7 percent of all farms were operated entirely by women from 2017 to 2020, and 44 percent of all farms were operated jointly by men and women, so 51 percent of all farms had at least one woman operator. For more information, see the ERS report An Overview of Farms Operated by Socially Disadvantaged, Women, and Limited Resource Farmers and Ranchers in the United States, published February 2024.
Monday, March 25, 2024
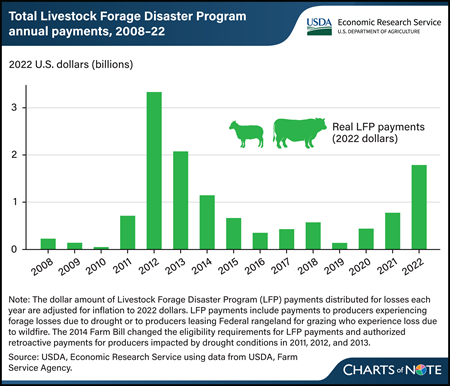
The USDA, Farm Service Agency administers the Livestock Forage Disaster Program (LFP), which provides payments to livestock producers affected by drought. From 2008 to 2022, the program distributed more than $12 billion (in 2022 dollars) in total to livestock producers throughout the United States. Annual LFP payments peaked in 2012 at more than $3 billion (in 2022 dollars) when severe, widespread drought conditions were prevalent throughout much of the central United States, where much of the Nation’s livestock production is concentrated. In general, years with widespread drought (such as in 2012, 2013, and 2022) are associated with larger total annual LFP payments. LFP eligibility is based on drought severity as reported by the U.S. Drought Monitor. If drought conditions become more severe and common in the future because of climate change, LFP payments may increase, with potential impact on the Federal Government’s budget. For more about the LFP and the potential impact of LFP payments on the Federal budget, see the USDA, Economic Research Service report The Stocking Impact and Financial-Climate Risk of the Livestock Forage Disaster Program, published in January 2024.


