
Farmers received a smaller share of U.S. households’ dairy expenditures in 2015
- by Hayden Stewart
- 10/5/2016
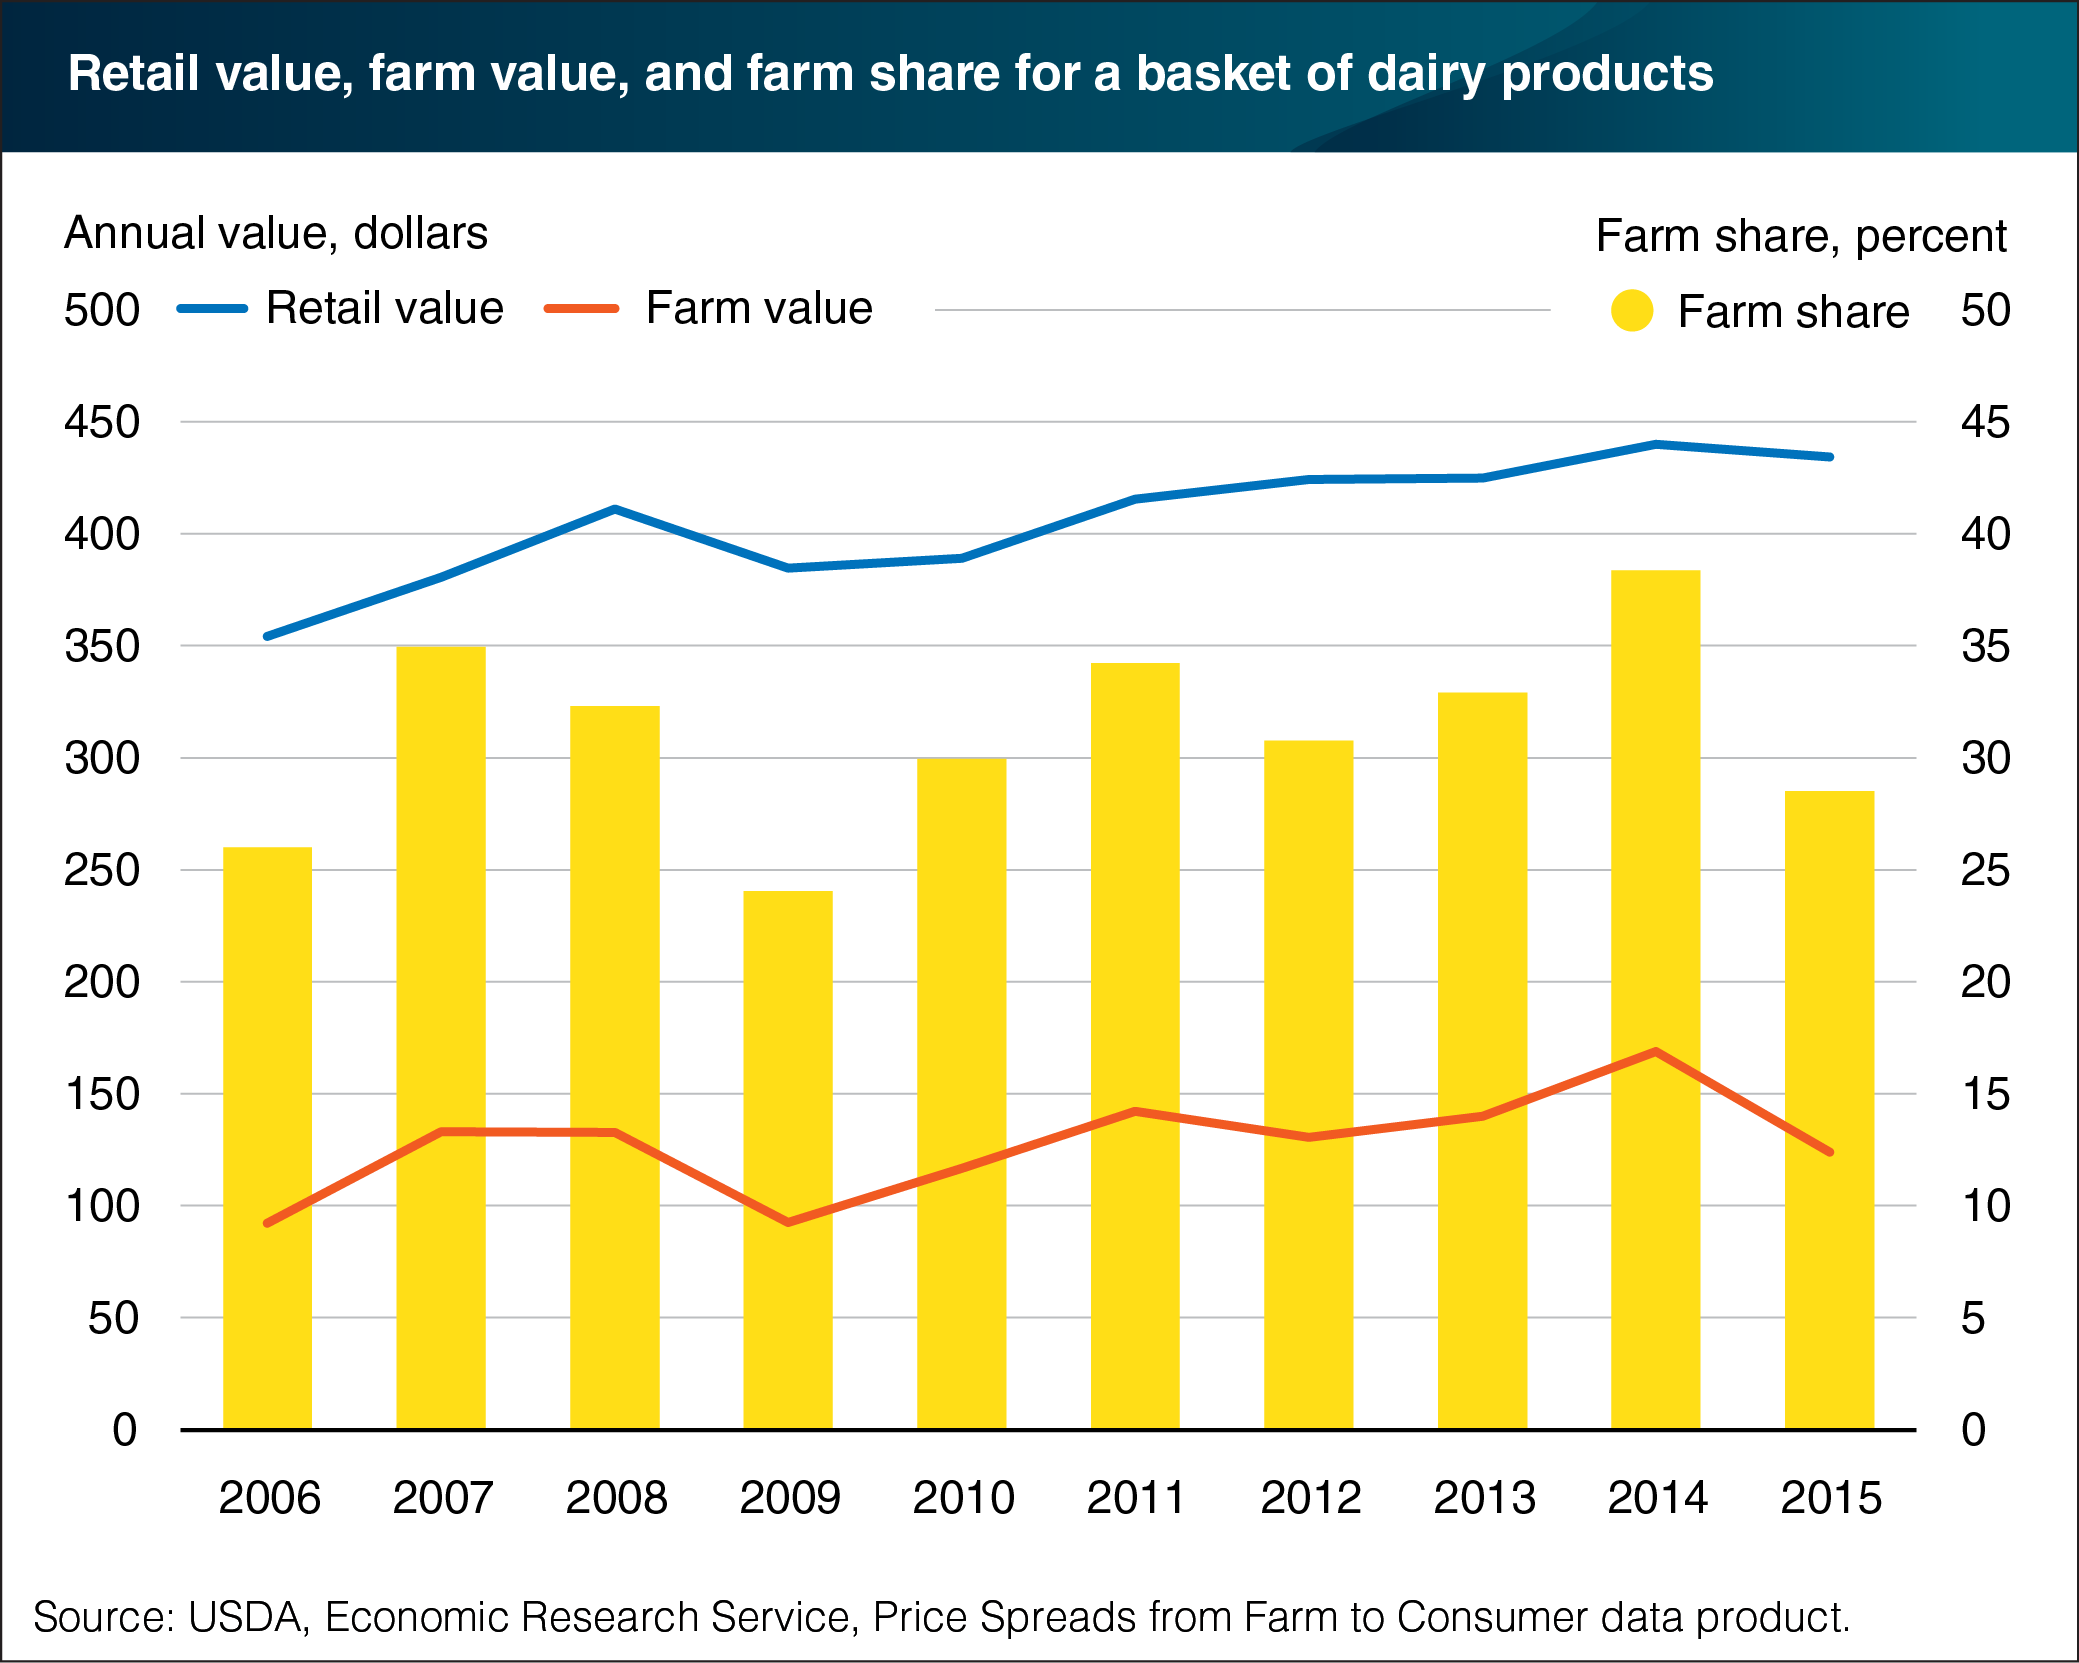
Over the past decade, the farm share for a basket of 14 dairy products—the ratio of grocery store prices (retail value) to prices received by dairy farmers (farm value)—has fluctuated between 24 and 38 percent. In 2015, the annual retail value of the basket fell by 1.2 percent to $435 while the farm value of the same products fell by 26.6 percent to $124. A decrease in the all-milk price received by farmers was responsible for the basket’s lower farm value. In 2014, the all-milk price peaked at $23.98 per 100 pounds on a monthly-average basis. The following year, however, the all-milk price fell to $17.08 per 100 pounds as a result of rising domestic milk production, falling U.S. cheese and dry whey exports, and growing imports of butter and cheese. The basket’s lower 2015 farm value, in turn, caused the farm share to fall from 38 to 29 percent that year. This chart is based on the Price Spreads from Farm to Consumer data product on the ERS website, updated July 2016.