
U.S. milk production continues to grow
- by Jerry Cessna
- 6/16/2016
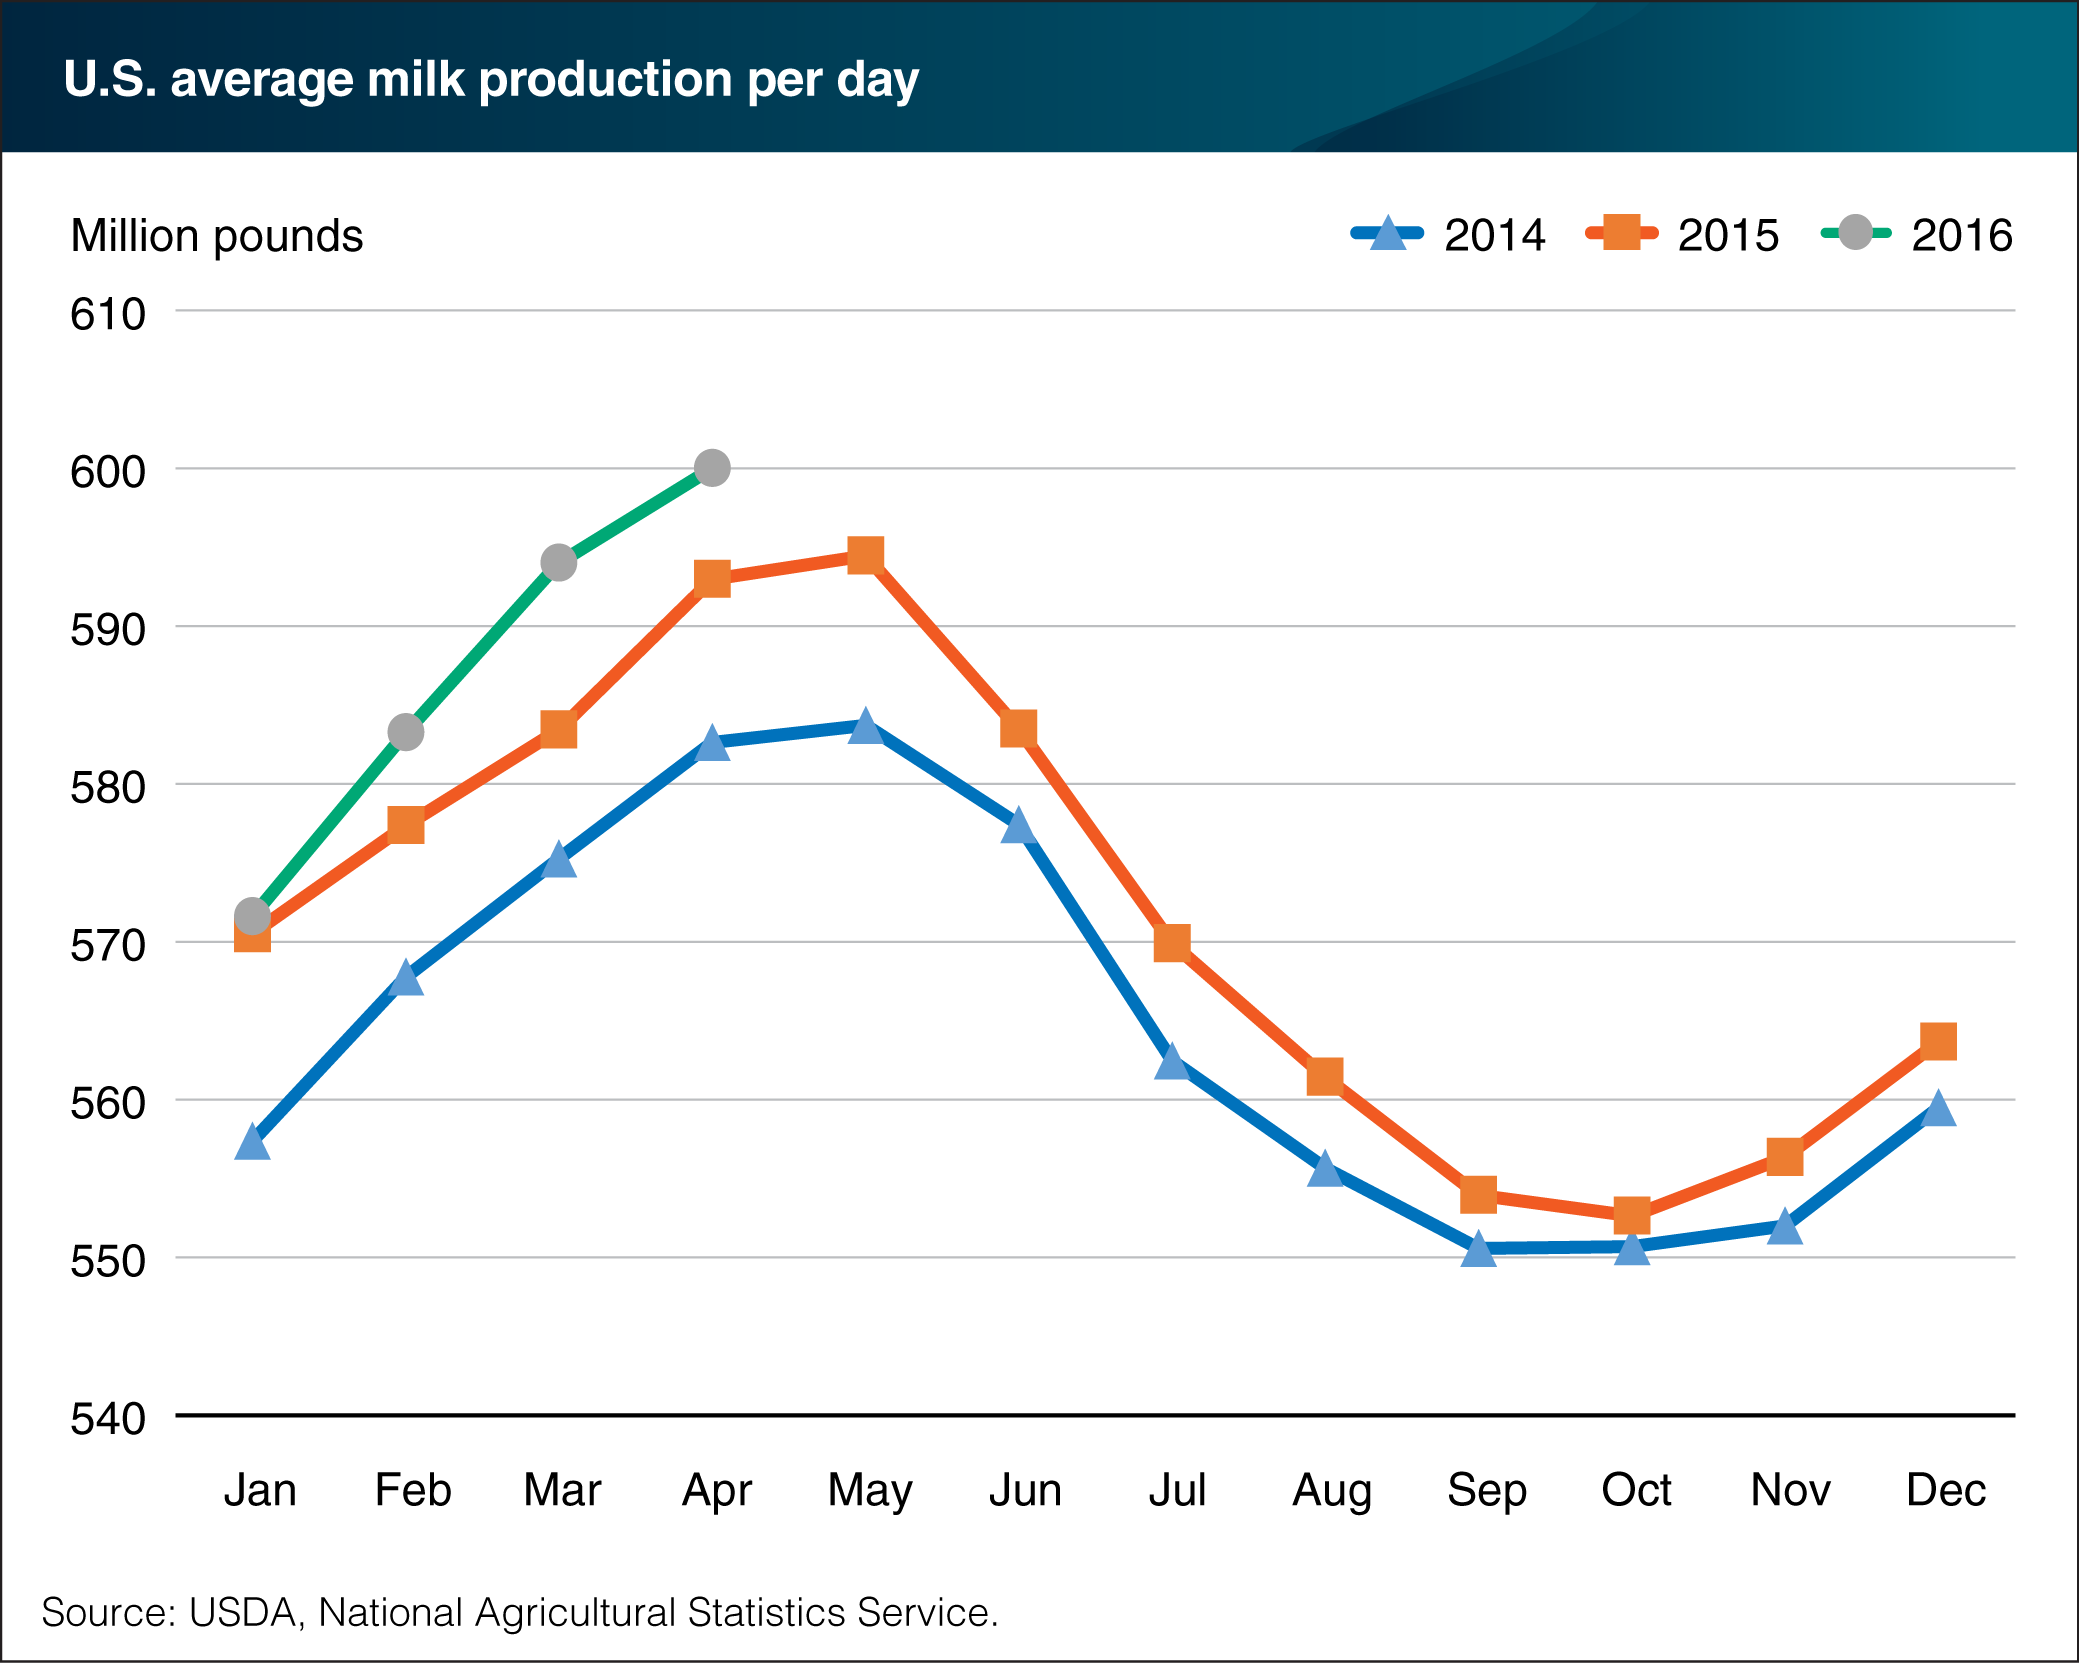
Milk production in the United States continues to grow, with year-over-year output increasing each month over the past few years. U.S. average daily milk production in April was 1.2 percent higher than the same period last year, following year-over-year gains of 1.8 percent in March, 1.0 percent in February and 0.2 percent in January. The increases reflect a combination of herd expansion and increasing production per cow. Despite relatively low farm milk prices in recent months, low feed prices and favorable weather conditions have contributed to growth in milk production. At the same time, as dairy farms have grown larger, many have developed economies of scale that enable them to maintain profitability and in some cases even expand production in the face of lower margins. This chart is from the Livestock, Dairy, and Poultry Outlook: May 2016.