
Milk-cow numbers turn higher and output per cow continues to grow
- by Jerry Cessna
- 4/15/2016
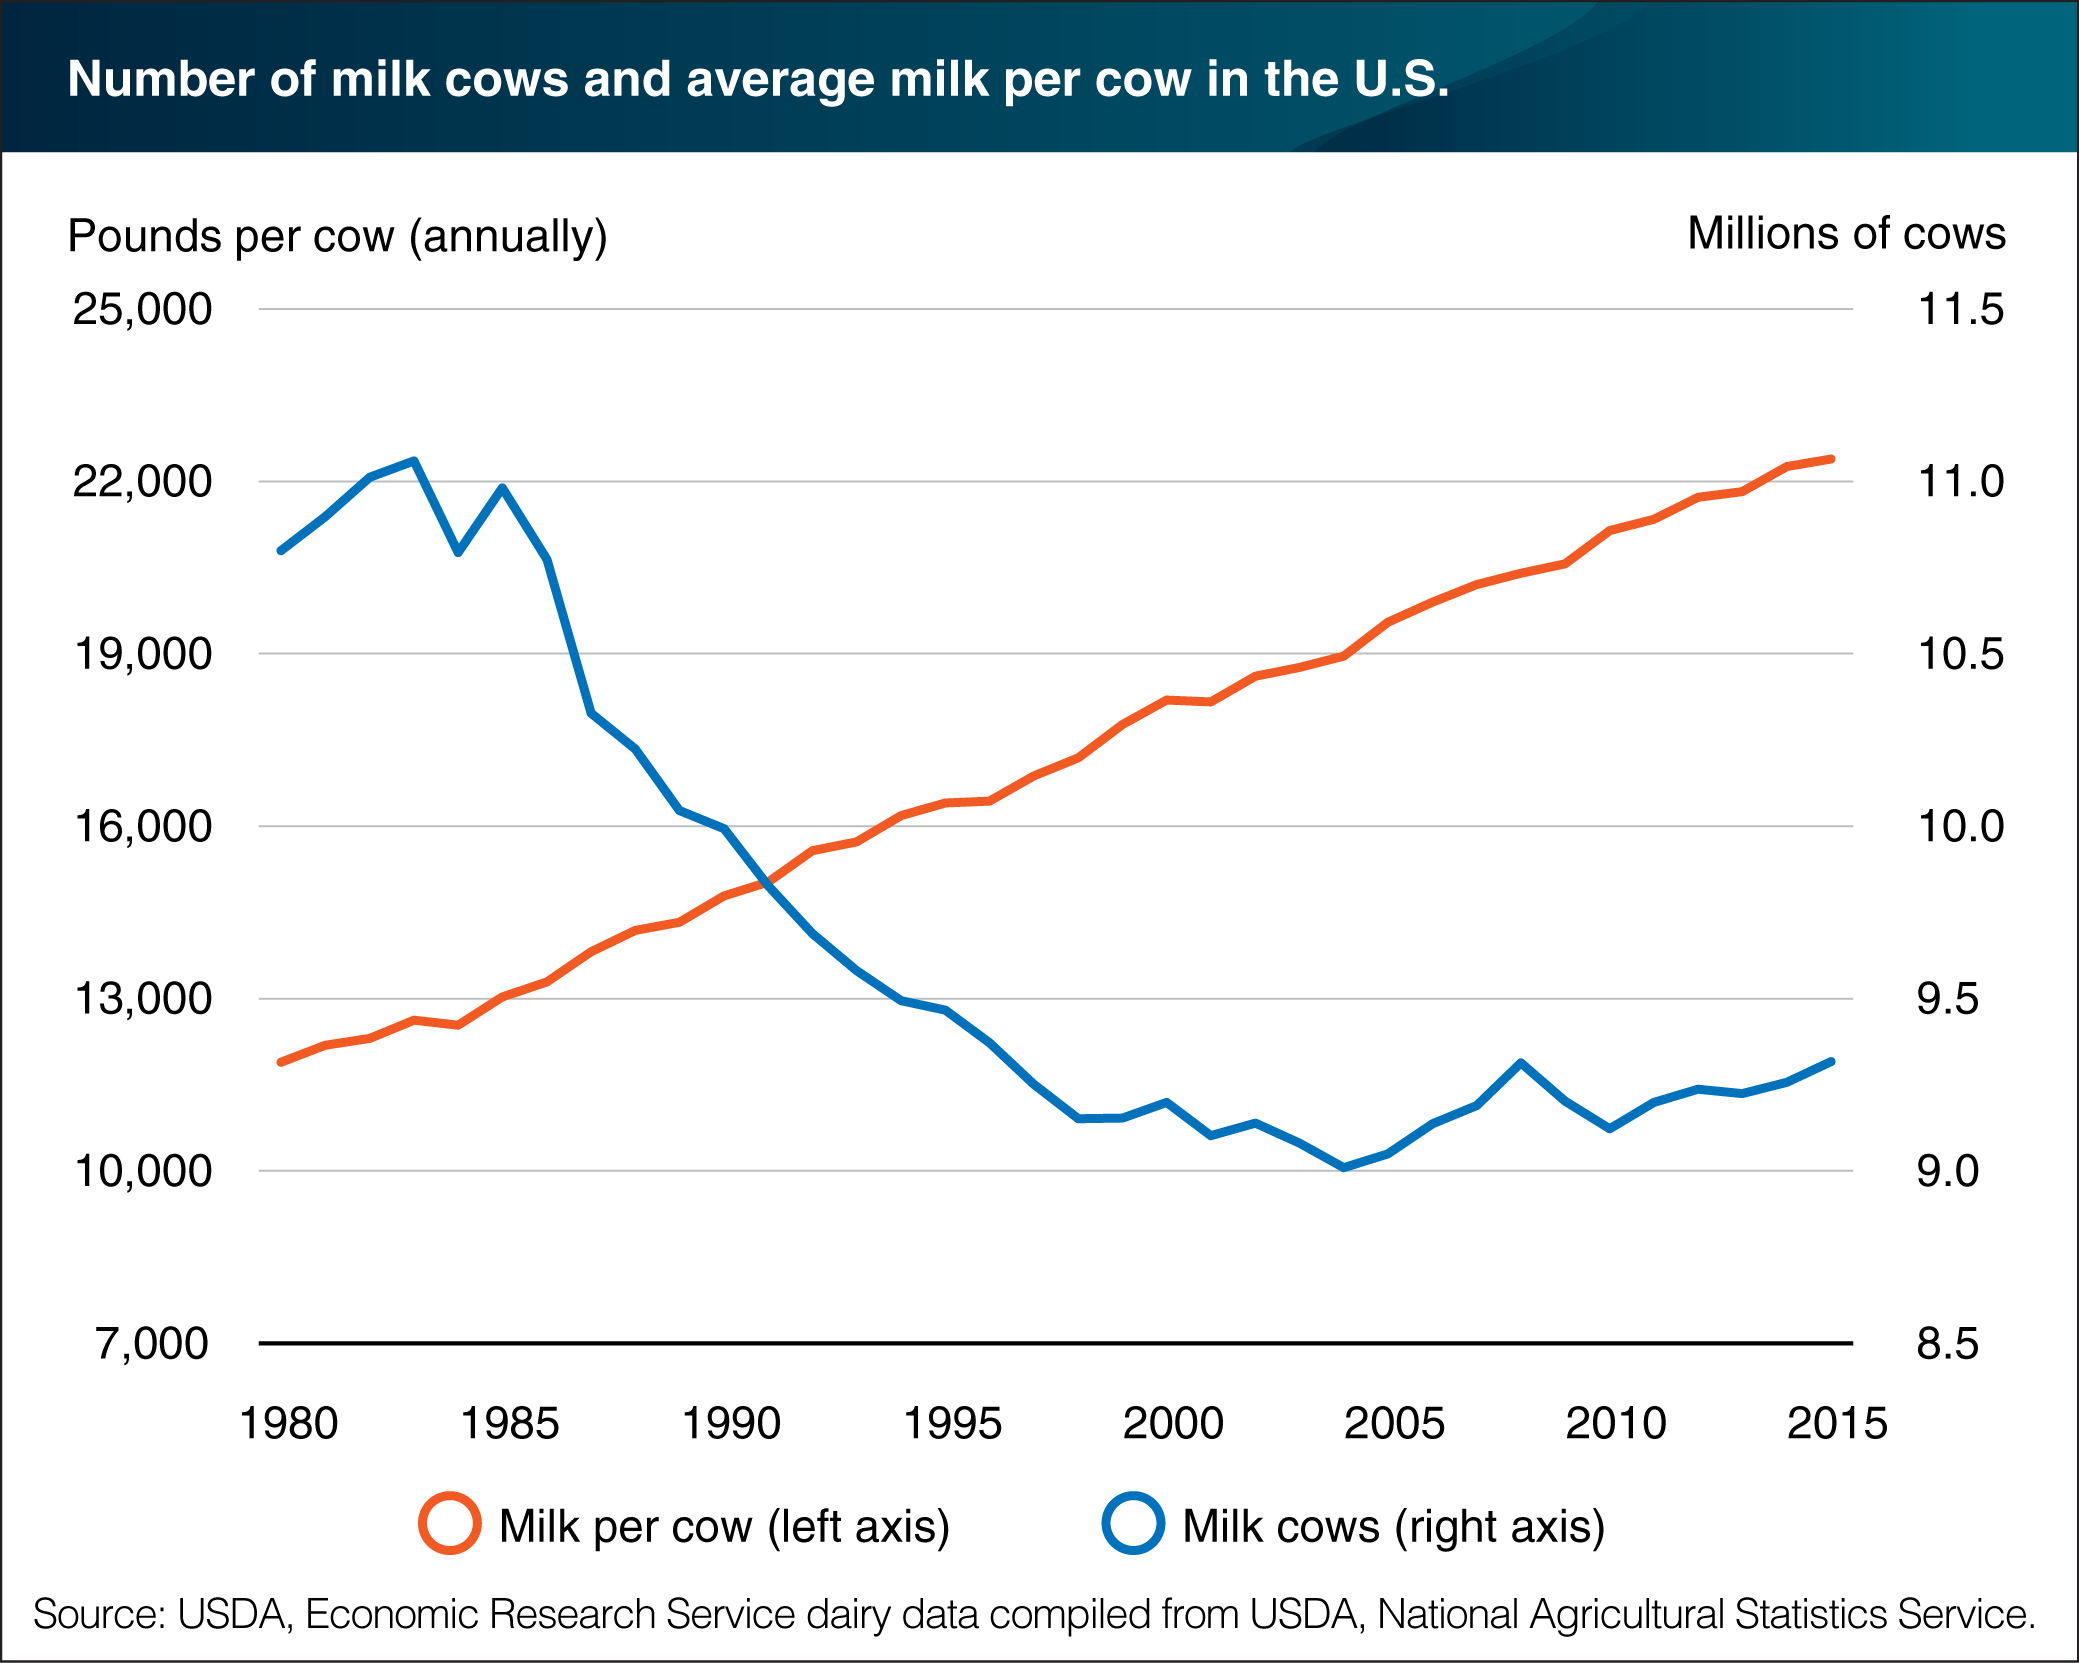
The number of milk cows in the United States was up slightly in 2015, reaching 9.3 million, about equal to the number in 2008. The size of the U.S. dairy herd reached an historic low of just over 9 million cows in 2004, following a long-term decline of more than 2 million head since 1983. Over the past decade, the herd size has grown slightly, by an average of 0.3 percent per year. Improving technology and genetics have allowed milk output per cow to rise steadily, increasing by 88 percent since 1980 and reaching a record-high annual average of 22,393 pounds of milk per cow in 2015. The result has been strong growth in U.S. milk production over the period, which corresponds to growing domestic and international markets for dairy products—particularly for cheese and various dairy-based food ingredients. This chart is based on the ERS Dairy Data product.
We’d welcome your feedback!
Would you be willing to answer a few quick questions about your experience?