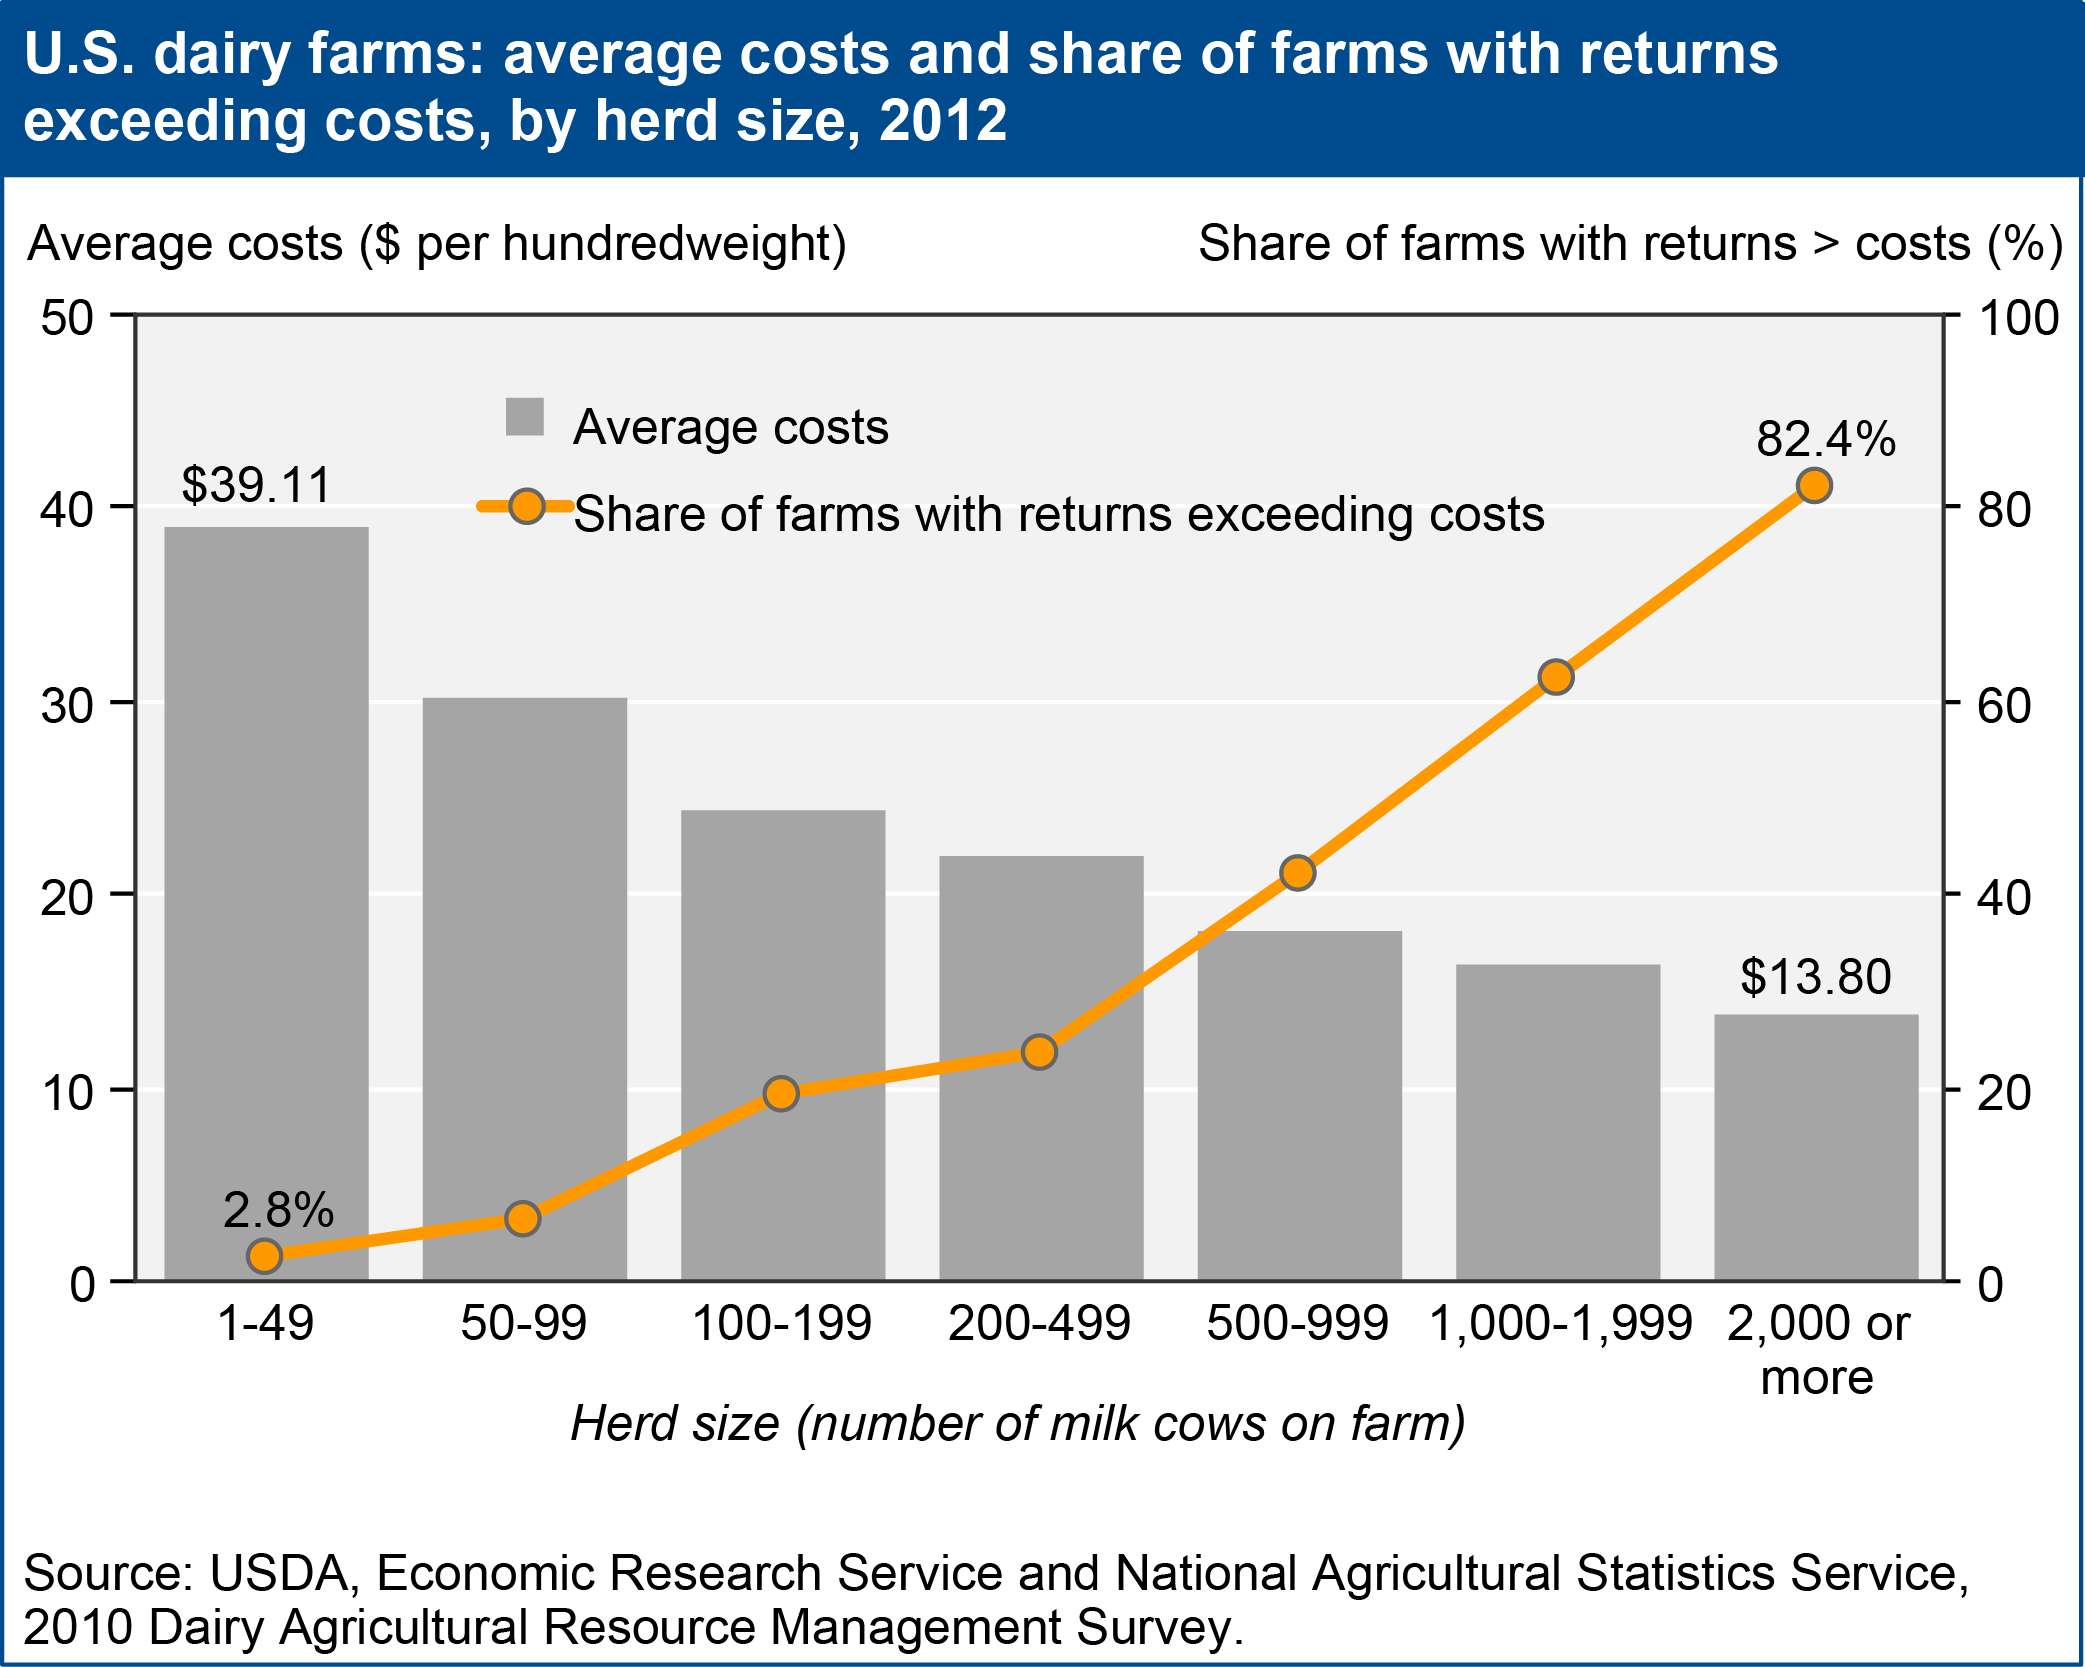
On average, larger dairy farms realize lower costs and higher profits
- by James M. MacDonald
- 1/6/2015

Over the last two decades, a major transformation of the dairy sector reduced the number of dairy farms by nearly 60 percent, even as total milk production increased by one-third. The accompanying shift to larger dairy farms is driven largely by farm profitability. Average costs of production per hundredweight of milk produced fall as herd size increases even among the largest farms (e.g., average costs are lower for farms with 2000+ cows compared to 1000-1999 cows). Production costs include the estimated cost of the farm family’s labor as well as capital costs and cash expenses. While some small farms earn profits and some large farms incur losses, most of the largest dairy farms generate gross returns that exceed full costs, while most small and mid-size dairy farms do not earn enough to cover full costs. The cost differences reflect differences in input use; on average, larger farms use less labor, capital, and feed per hundredweight of milk produced. These financial returns provide an impetus for the shift to larger dairy farms. This chart is drawn from the December 2014 Amber Waves data feature, "Milk Production Continues Shifting to Large-Scale Farms."
We’d welcome your feedback!
Would you be willing to answer a few quick questions about your experience?

