

For Supplemental Nutrition Assistance Program (SNAP) Households, Fruit and Vegetable Affordability Is Partly a Question of Budgeting
When it comes to eating fruits and vegetables, the average U.S. diet falls short of Federal recommendations. According to the 2020–2025 Dietary Guidelines for Americans, about 90 percent of the U.S. population does not meet the recommendation for vegetables and 80 percent consumes too little fruit. There are many factors that could influence food choices, including taste, convenience, and the link between diet and health. For lower income households, affordability can also be a factor.
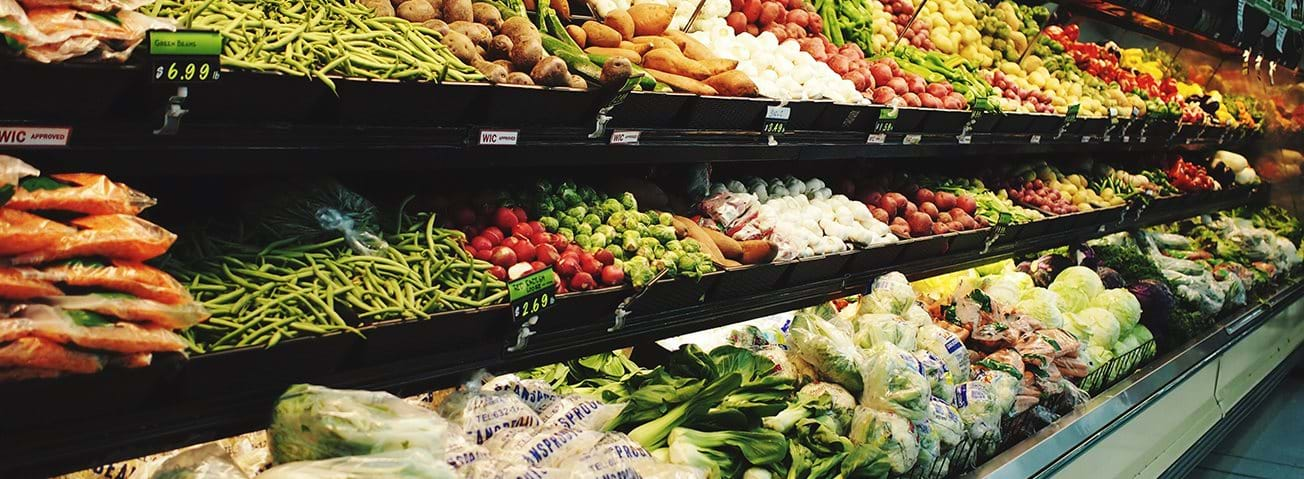
Using USDA, Economic Research Service’s (ERS) 2016 Fruit and Vegetable Prices data product and simulation techniques, ERS researchers examined the variety of these foods that a four-person family could buy with maximum Supplemental Nutrition Assistance Program (SNAP) benefits. For the study, 3,000 market baskets of fruits and vegetables were created at different cost levels. Each basket’s retail value was evaluated with the family’s ability to afford it in mind. All baskets contained enough fruits and vegetables for the family to meet recommendations in the Dietary Guidelines for Americans for both food groups over 1 week.
Results suggest that lower income households can afford to satisfy fruit and vegetable recommendations with about 40 percent of maximum SNAP benefits. Baskets available at this spending level contain a variety of fresh and processed products, including many items costing between 40 and 80 cents per cup equivalent. By choosing some lower cost items, such as potatoes bought fresh and baked in their skins (20 cents per cup equivalent), the representative household in the study could also buy a number of higher cost items such as frozen broccoli (71 cents), red bell peppers (75 cents), and fresh kale (79 cents) while staying within budget.
A fruit and vegetable budget share of 40 percent is consistent with USDA’s Thrifty Food Plan (TFP). This food plan is the national standard for how households with limited resources can consume a nutritious diet. The TFP also serves as the basis for determining a household’s maximum level of SNAP benefits. However, SNAP households may allocate less than 40 percent of their food budgets to fruits and vegetables for many reasons. Some may not prioritize healthy eating, and even if they do, factors such as higher-than-anticipated prices for other foods may still prevent them from doing so.
Simulation results revealed that the variety of fruits and vegetables a four-person family can afford drops off quickly as the family allocates less and less than the TFP’s allocation of 40 percent of maximum SNAP benefits to fruits and vegetables. Baskets available for less money contain a more limited variety of products, primarily the least expensive items in the ERS Fruit and Vegetable Prices data product. Households that can only afford one of these baskets with limited variety could not likely satisfy members’ tastes and preferences or prepare meals using recipes that call for different types of fruits and vegetables.
| Cup Equivalents*
|
Retail Cost | ||||
|---|---|---|---|---|---|
| Fruit | |||||
| Apples | 7 | $3.05 | |||
| Oranges | 7 | $4.61 | |||
| Grapes | 6 | $4.62 | |||
| Fruit cocktail, canned, packed in juice | 6 | $4.57 | |||
| Orange juice, bought frozen and reconstituted | 26 | $8.57 | |||
| Dark Green Vegetables | |||||
| Romaine heads | 2 | $0.66 | |||
| Broccoli, bought frozen and boiled or steamed | 2 | $1.41 | |||
| Kale | 3 | $2.36 | |||
| Red and Orange Vegetables | |||||
| Whole carrots | 5 | $1.20 | |||
| Whole carrots, bought fresh and boiled
|
5 | $1.52 | |||
| Red bell pepper | 4 | $2.99 | |||
| Sweet potato, bought fresh and baked | 2 | $1.15 | |||
| Tomatoes, canned | 3 | $1.48 | |||
| Roma tomatoes
|
4 | $2.13 | |||
| Starchy Vegetables | |||||
| Corn, canned | 4 | $1.91 | |||
| Green peas, bought frozen and cooked | 4 | $2.62 | |||
| Potatoes, bought fresh and baked | 10 | $1.97 | |||
| Succotash, bought frozen and cooked | 4 | $2.68 | |||
| Other Vegetables | |||||
| Green cabbage | 3 | $0.79 | |||
| Radish | 1 | $0.45 | |||
| Cucumber | 5 | $1.71 | |||
| Green beans, canned | 5 | $1.89 | |||
| Onions | 1 | $0.41 | |||
| Green bell pepper | 3 | $1.45 | |||
| Beans and Peas | |||||
| Lentils, bought dry and cooked | 2 | $0.44 | |||
| Red kidney beans, canned | 5 | $2.56 | |||
| Total Cost and cup equivalents
|
129 | $59.20 | |||
| Average Cost Per Cup Equivalent | $0.46 | ||||
|
Notes: Family of four includes a male and a female aged 31 to 45, 1 child age 10, and 1 child age 8. In June 2016, the household’s weekly food budget is assumed to have been $147.76, of which about 40 percent was earmarked for fruits and vegetables. Prices are 2016 average retail prices. Products are bought and consumed fresh unless otherwise noted. Source: USDA, Economic Research Service Fruit and Vegetable Prices Data Product. |
|||||
The more that households prioritize healthy eating, the better they can afford to consume a sufficient quantity and variety of fruits and vegetables, by Hayden Stewart, Jeffrey Hyman, Diansheng Dong, and Andrea Carlson, Public Health Nutrition, 24(7): 1841-1850
The Cost of Satisfying Fruit and Vegetable Recommendations in the Dietary Guidelines, by Hayden Stewart, Jeffrey Hyman, Andrea Carlson, and Elizabeth Frazão, USDA, Economic Research Service, February 2016
Fruit and Vegetable Prices, by Hayden Stewart and Jeffrey Hyman, USDA, Economic Research Service, May 2024