

World Agricultural Trade Experiences Sizable Growth but Still Faces Barriers
Highlights:
-
The volume of world agricultural trade has grown fairly steadily since 1995, driven by substantial growth in world population and income, among other factors. Developing countries now account for a much larger share of the marketplace, both as exporters and importers.
-
Applied tariffs on agricultural imports average about 15 percent. Multilateral trade negotiations launched in 2001 at the World Trade Organization (WTO) have not yielded a new agreement to further reduce agricultural tariffs, but they have generated two new accords—one on the elimination of export subsidies and the other on trade facilitation.
-
Increased spending by some developing countries on domestic agricultural support programs and the use of some sanitary and phytosanitary (SPS) regulations (regulations that apply to animal and plant health, respectively) to favor domestic producers or to discriminate against certain importers present fresh challenges to world agricultural trade.
In a world of over 7.4 billion people, nearly 200 countries, and more than 500 million farms, the global landscape of agricultural trade is sometimes hard to discern. But when one looks closely, two features stand out: (1) world agricultural trade has expanded over the past several decades, and (2) many aspects of this trade are still encumbered by restrictive policies, even though progress has been made in reducing or eliminating many barriers.
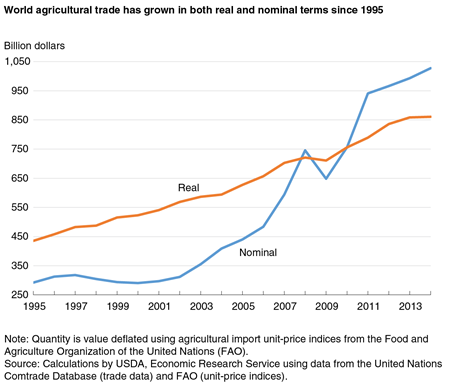
World Agricultural Trade Has Roughly Doubled in Real Terms Since 1995
Between 1995 and 2014, world agricultural trade more than tripled in nominal terms (not adjusted for inflation) and nearly doubled in real terms (adjusted for inflation). Key factors driving this expansion include a more than 25-percent increase in the world’s population and about a 75-percent increase in the real size of the world’s economy. Other factors have also stimulated agricultural trade, including falling trade barriers and technological advances in agricultural production, transportation, information, and communications.
Developing countries are playing bigger roles in global agricultural trade, both as buyers and as sellers. Over the past two decades, the regional composition of agricultural trade has shifted toward five regions of the world where middle- and low-income countries predominate. These regions’ share of world agricultural imports increased from 28 percent in 1995-99 to 42 percent in 2010-14, while their share of world agricultural exports rose from 37 to 46 percent.
Rising incomes and increasing agricultural productivity are key drivers of the heightened participation of middle- and low-income countries in global agricultural trade. This is particularly true for the BRIIC countries—Brazil, Russia, India, Indonesia, and China. With the exception of Brazil, all the BRIIC countries experienced historically high levels of real per capita income growth over the past two decades—a factor that fueled the growth of agricultural imports. At the same time, growth in agricultural total factor productivity (TFP) exceeded the global average in each BRIIC country—a development that spurred the expansion of agricultural exports. In Brazil, TFP growth was roughly double the global average. Finally, each BRIIC country is large in terms of land area and population. Collectively, the BRIIC countries account for 44 percent of the world’s population and 30 percent of its arable land. Their impact on global agricultural markets is thus considerable.
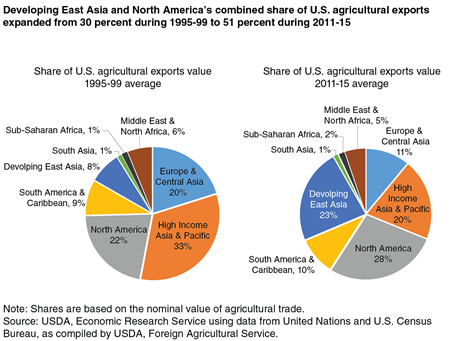
A marked shift in the destinations for U.S. agricultural exports has accompanied the increased participation of developing economies in global agricultural trade. Elimination of agricultural trade barriers within North America boosted exports to Canada and Mexico—partners with the United States in the North American Free Trade Agreement (NAFTA). Rising household incomes and changing trade policies in developing East Asia (China and Southeast Asia, less Singapore) led to a near tripling in that region’s share of U.S. agricultural exports. China’s share of U.S. agricultural exports swelled from 3 percent on average during 1995-99 to 16 percent during 2011-15. A single product—soybeans—accounts for half of this increase. However, the strong growth in demand for U.S. agricultural exports in East Asia and North America has been offset by a sharp decline in the share going to Europe and high-income economies in East Asia, particularly Japan. In the European Union (EU), a number of barriers—including concerns over genetically modified products—continue to hamper U.S. agricultural trade.
Trade Liberalization Has Partially Cleared a Path for More Agricultural Trade
One factor that has helped to facilitate global agricultural trade over the past several decades is trade liberalization (the reduction or removal of tariffs, quotas, and other barriers to international trade) at the multilateral, regional, and bilateral levels. As part of multilateral trade liberalization through the Uruguay Round Agreement on Agriculture (URAA), implemented in 1995, each member country of the World Trade Organization (WTO) reduced the average value of its “bound” tariffs on agricultural imports over a 10-year period (5 years for developed countries) and implemented a minimum reduction in each product category known as a “tariff line.” Each member country’s legally binding commitments on import tariff by product were published in a list customarily referred to as a schedule. Member countries agreed not to raise tariffs above these “bound” levels but are free to offer lower “applied” tariffs on imports from all countries with most-favored-nation (MFN) status, which is automatically extended to all WTO members.
Countries participating in bilateral and regional trade agreements have gone even further by providing each other with preferential market access featuring even lower tariffs and, for many products, duty-free access. For instance, the North American Free Trade Agreement (NAFTA), implemented in 1994, eliminated almost all tariffs—agricultural and nonagricultural—among its member countries Canada, Mexico, and the United States. A year earlier (1993), the EU transformed its existing customs union (a free-trade area in which member countries apply a common set of import tariffs toward nonmembers) into a common market featuring the free internal movement of not only goods but also people, services, and capital. As of June 2017, 279 separate bilateral or regional trade agreements covering trade in goods and services had been notified (officially reported) to the WTO and were in force.
A major reason for the large number of bilateral and regional trade agreements is that negotiations at the WTO have been slow to produce new multilateral trade agreements. The Doha Round of negotiations, launched in 2001, has not yet yielded an agreement that makes further tariff reductions for agricultural products. However, there has been progress in other areas. Export subsidies for agricultural products are scheduled to be eliminated as part of a package of six Ministerial Decisions adopted at the WTO’s 10th Ministerial Conference, held in Nairobi, Kenya, in December 2015. Export subsidies are formally defined by the WTO as “subsides contingent on export performance.” Examples include the export of noncommercial stocks—inventories of agricultural commodities that are held for purposes other than commercial sales, such as international food aid—at below-market prices, internal transportation subsidies that only apply to goods destined for the export market, and subsidies paid on commodities used as inputs to produce goods that are then exported.
Moreover, in an effort to lessen the bureaucratic delays and administrative requirements that increase trade costs, the WTO is implementing a new Trade Facilitation Agreement. This accord focuses on simplifying required paperwork, modernizing procedures, and harmonizing customs requirements. Negotiations on the Trade Facilitation Agreement were completed at the WTO’s Ninth Ministerial Conference, held in Bali, Indonesia, in December 2013, and the agreement took effect in February 2017 following its ratification by two-thirds of the WTO membership.
Applied Tariffs on Agricultural Imports Remain as Important Trade Barriers
For the 32 WTO member countries with the largest total value of agricultural trade (exports plus imports), the average applied tariff on agricultural imports is about 20 percent, compared with an average bound rate of about 46 percent. For about half of these countries, the difference between their average applied and bound tariffs on agricultural imports is greater than or equal to 20 percentage points. Most tariffs are ad valorem, or a percentage of the import value, with some important exceptions. Many countries subject certain products to tariff-rate quotas (TRQs), a type of trade barrier that applies two levels of tariffs—one level on quantities below the quota and another, higher level on quantities above and beyond the quota.
The freedom of governments to vary applied tariffs introduces a degree of uncertainty into trade, as countries are allowed to modify their tariffs for specific products temporarily or for a predetermined quantity. Some countries do so on a regularly scheduled basis, while others approach this task in a more ad hoc fashion. For instance, South Korea announces its TRQs every 6 months, a schedule that provides the country with a formal structure for adjusting tariff rates for agricultural imports on a routine basis. By contrast, India reduced its soybean tariff to zero in 2012 (compared with a bound rate of 100 percent) and then raised the tariff rate in 2013 and 2014. Such tariff adjustments often have a specific policy objective. For example, Turkey amends its Inward Processing Regime to allow tariff-free imports that are used as inputs in Turkish industries.
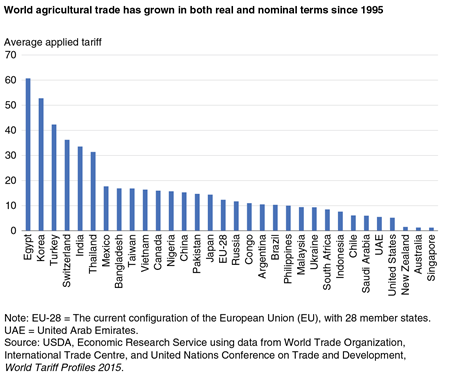
The simple applied (MFN) tariff rate for agricultural products averaged about 15 percent in 2014, according to the World Tariff Profiles 2015. However, this average often overstates the actual average tariff. Countries often apply lower tariffs on a bilateral basis as part of unilateral concessions to developing countries or as part of free-trade agreements; in many instances, the lower tariff rate is zero. Among the countries with the largest levels of agricultural trade, Korea, Egypt, Turkey, Switzerland, India, and Thailand maintain the highest MFN agricultural tariffs, with simple averages exceeding 30 percent. The EU, Mexico, Canada, Japan, Russia, and China follow, each recording an average tariff of around 20 percent. A group of major participants in world agricultural trade—the United States, Australia, New Zealand, Ukraine, and Chile (major exporters), and Saudi Arabia and the United Arab Emirates (major importers)—have average applied tariffs below 10 percent.
Spending on Domestic Agricultural Supports Has Increased in Some Developing Countries
Domestic agricultural support programs—especially policies that explicitly subsidize or tax agricultural production or food consumption—are another type of government program that has the potential to restrict international trade. One measure of these support programs is the Producer Support Estimate (PSE), as calculated by the Organisation for Economic Co-operation and Development (OECD). This measure is defined as the value of transfers from domestic consumers and taxpayers to agricultural producers. The OECD has calculated PSEs for its member countries and a handful of countries outside the organization.
The table below shows how the PSE as a share of Gross Farm Revenue (GFR)—often called the “percentage PSE”—changed in selected countries between 2001-05 and 2012-16. A country’s percentage PSE can fluctuate greatly from one year to the next, so while the comparison of two period averages generally simplifies the examination of trends, it also can mask the true movements in the underlying annual data. In the discussion below, we are careful not to draw conclusions that are not borne out by the more detailed data.
| Country | Income category | PSE as a share of GFR (percent) 2001-05 |
PSE as a share of GFR (percent) 2012-16 |
|---|---|---|---|
| Norway* | High income | 68 | 60 |
| Switzerland* | High income | 66 | 54 |
| Iceland* | High income | 66 | 51 |
| Korea* | High income | 59 | 50 |
| Japan* | High income | 56 | 50 |
| Turkey* | Upper middle income | 27 | 24 |
| Philippines | Lower middle income | 15 | 24 |
| Indonesia | Lower middle income | 8 | 23 |
| European Union - 28* | High income | 33 | 20 |
| Colombia | Upper middle income | 20 | 19 |
| China | Upper middle income | 7 | 15 |
| Russia | Upper middle income | 14 | 14 |
| Israel* | High income | 14 | 13 |
| Canada* | High income | 20 | 10 |
| Mexico* | Upper middle income | 19 | 10 |
| Costa Rica | Upper middle income | 8 | 10 |
| Kazakhstan | Upper middle income | 6 | 9 |
| United States* | High income | 17 | 9 |
| Brazil | Upper middle income | 6 | 4 |
| South Africa | Upper middle income | 7 | 3 |
| Chile* | High income | 6 | 3 |
| Australia* | High income | 4 | 2 |
| New Zealand* | High income | 1 | 1 |
| Vietnam | Lower middle income | 8 | 1 |
| Ukraine | Lower middle income | 4 | -6 |
| PSE = Producer Support Estimate GFR = Gross Farm Revenue OECD = Organisation for Economic Co-operation and Development * = OECD member High-income economies had a gross national income (GNI) per capita of $12,236 or more in 2016; upper middle-income economies had a GNI per capita between $3,956 and $12,235, and lower middle-income economies had a GNI per capita between $1,006 and $3,955. Source: USDA, Economic Research Service using data from OECD (percentage PSEs) and World Bank (income categories). |
|||
For the United States, the percentage PSE decreased from an annual average of 17 percent during 2001-05 to 9 percent during 2012-16. This decline occurred in large part because crop prices in the more recent period were often below the marketing loan rates and reference prices that trigger certain farm payments. Quite a few countries—some with developed economies featuring high per capita incomes and others with developing, middle-income economies—had average annual percentage PSEs during 2012-16 that were higher than that of the United States.
A number of countries with high-income economies still have high percentage PSEs. Among the OECD countries, Norway, Switzerland, Iceland, Korea, and Japan each averaged more than 50 percent during 2012-16. Still, the average annual percentage PSE of each of these countries declined by 7-15 percentage points between 2001-05 and 2012-16. The OECD countries with an average percentage PSE of 10 percent or less during 2012-16 are Canada, Mexico, the United States, Chile, Australia, and New Zealand—all high-income economies except for Mexico.
Some middle-income countries are spending more on domestic agricultural support programs than they did in the past. For instance, Indonesia’s percentage PSE climbed from an annual average of 8 percent during 2001-05 to 23 percent during 2012-16—the second highest percentage PSE during 2012-16 (after the Philippines) among the non-OECD countries studied. Fertilizer subsidies are one of Indonesia’s main domestic supports for agricultural producers.
China also stands out for its increases in domestic agricultural supports. To support the country’s grain producers, the Chinese Government provides a “protective agricultural subsidy” to guard the productivity of farmland and facilitate food production on an appropriate scale, direct payments linked to area planted, and transfer payments to grain-producing counties. Several years ago, the Chinese Government also purchased large quantities of grains, oilseeds, and cotton at prices above market levels, but the government had to liquidate large stocks of these commodities when firms declined to purchase them at the higher supported prices. As a result of these expanded efforts, China’s percentage PSE increased from an annual average of 7 percent during 2001-05 to 15 percent during 2012-16.
India’s domestic agricultural supports also have increased. Support prices for corn, rice, and wheat have all more than doubled over the past decade, and the Government maintains minimum support prices for these commodities by purchasing them at a set price. During 2012-14, such purchases accounted for 33 percent of India’s wheat production and 32 percent of rice production. At the same time, the country’s public distribution system provides lower income consumers with reduced-price supplies of staple foods.
The OECD has not assessed the level of domestic agricultural support provided by India due to a lack of certain production data. However, it is still possible to use the OECD’s PSE framework to estimate the amount of support that India provides in the form of output and input subsidies. Since 2009, payments have tended to remain around $30 billion per year, compared with less than $15 billion per year during 2001-07. In this context, India’s percentage PSE increased from 3 percent in 1995 to 8 percent in 2015. By comparison, the U.S. percentage PSE in 2015 was about 9 percent.
SPS Regulations: Guardians of Animal and Plant Health or Trade Barriers in Disguise?
By protecting plant and animal health, sanitary and phytosanitary (SPS) regulations play a key role in ensuring food safety and protecting agricultural resources. But such regulations also can be used as nontariff measures (NTMs) to favor domestic producers or to discriminate against certain importers.
Under the WTO Agreement on the Application of Sanitary and Phytosanitary Measures (SPS Agreement) and the WTO Agreement on Technical Barriers to Trade (TBT Agreement), WTO members agreed to establish regulations and standards that achieve domestic goals in the least trade-distorting manner. However, differences in the interpretation of WTO rules and domestic pressures in some countries have generated areas of conflict among trading partners, including:
- The appropriate level of tolerance for risks to health and safety;
- The use of the precautionary principle, in which temporary regulations are issued to prohibit a new product or technique because the available scientific evidence on its possible risks is viewed as uncertain or incomplete; and
- The appropriate response to consumer demands for information beyond that necessary to ensure health and safety.
One setting where WTO members try to resolve contentious issues regarding SPS regulations is the WTO Committee on Sanitary and Phytosanitary Measures (WTO SPS Committee). In that committee, trade issues that are formally raised are known as Specific Trade Concerns (STCs). If a country believes that a policy violates the SPS Agreement (or the TBT Agreement), it may initiate a dispute settlement case at the WTO. Most STCs are resolved before they escalate to the level of a formal dispute.
A cooperative study by researchers at ERS and Virginia Tech University examined the STCs raised in the WTO SPS Committee during the period 1995-2015 and classified them by the type of regulation that was at the heart of the concern. Regulations intended to counter the spread of animal disease represented almost one-third (32 percent) of the STCs lodged during this period. This large share reflects both the intersection between international meat trade and outbreaks of animal diseases such as foot-and-mouth disease (FMD) and bovine spongiform encephalopathy (BSE) during the first part of the 21st century and the concern that some regulations used to address these outbreaks functioned as NTMs. Many concerns in this general area have since been resolved by engagement on technical and political levels. Regulations intended to prevent plant contamination through the spread of disease, pests, and noxious weeds are also an important category of STCs but represented a smaller share of the total (11 percent).
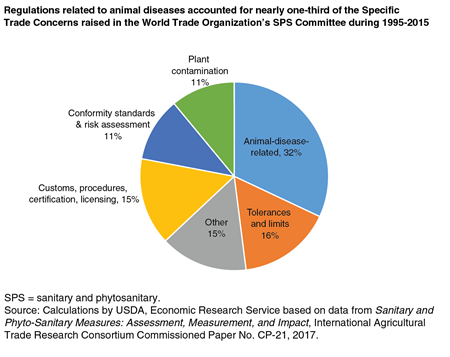
Maximum residue limits (MRLs) regarding the maximum acceptable levels of pesticides and veterinary drugs that may be present in food and agricultural products, along with similar tolerances and international standards, make up the second most common type of STC, with a 16-percent share of the total. Such regulations can be significant barriers to trade when they are not publicized fully and transparently or are excessively costly. Customs procedures, certification, and licensing represented 15 percent of the STCs raised during 1995-2015. Such measures can raise trade costs directly and indirectly by increasing the time that it takes for goods to cross the border—attributes that help to explain why the WTO Members also have forged the recent Trade Facilitation Agreement. Requirements for demonstrating that shipments conform to SPS regulations can impose substantial costs themselves. These procedures and some mandatory risk assessments have been the subject of 11 percent of STCs during this period.
The Global Landscape of Agricultural Trade, 1995-2014, by Jayson Beckman, John Dyck, and Kari E.R. Heerman, ERS, November 2017
Sanitary and Phytosanitary Measures and Tariff-Rate Quotas for U.S. Meat Exports to the European Union, by Shawn Arita, Jayson Beckman, Lindsay Kuberka, and Alex Melton, ERS, December 2014