


Resource and Environment
(Selected research findings from FY21)
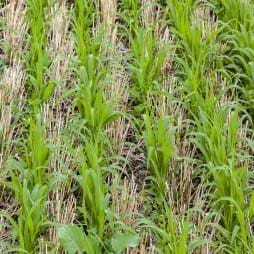 On U.S. cropland, the use of cover crops increased by 50 percent between 2012 and 2017
During 2012 to 2017, Federal and State conservation programs increased efforts to promote cover crops through financial and technical assistance. When farmers introduce cover crops into a crop rotation, there can be important on farm benefits for the farmers as well as benefits to society. These benefits depend upon how the farmers manage the cover crop, such as the type of cover crop, the method used to terminate its growth, and other soil health and residue-management practices employed. Based on a series of farm- and field-level surveys, this report details how cover crops are managed on corn, cotton, soybean, and wheat fields. These surveys reveal that there are many different approaches to using cover crops. This includes considerable variation in the other soil-health-related practices farmers use with cover cropping, such as no-till farming, conservation cropping, and soil testing.
ERS researchers studied water use in the U.S. food system in 1997, 2002, 2007, and 2012 using the most recent benchmark economic datasets and an environmental input-output model. The U.S. food system uses freshwater from both surface water and groundwater sources (both blue water) throughout the domestic food supply chain, from on-farm irrigation to water used in the home kitchen. The report showed that blue water use increased and decreased over the 4 time periods, but surface water is consistently the primary source of food-related water use. The report found that the majority of water use was in the crop and livestock production stages, although supply chain stages downstream from agriculture (processing and packaging, distribution and marketing, energy, and households) used 32 percent of the U.S. food system’s blue water in 2012. This research also considers specific food categories. In 2012, the fresh vegetable category required the most blue water at 5.14 trillion gallons.
The 2019 SIO was the first Federal, nationally representative data collection effort focused on irrigation organizations since the 1978 Census of Irrigation Organizations. The 2019 U.S. survey collected data on irrigation organizations (both irrigation water delivery organizations and groundwater management organizations) in 24 States where these organizations are most common. This collaboration between the USDA, ERS, and NASS, with support from the Office of the Chief Economist, was funded through a congressional budget initiative aiming to expand research and data on agricultural drought resilience.