Between July 2016 and July 2017, overall population in nonmetro counties increased for the first time this decade, according to estimates released in March 2018 by the U.S. Census Bureau. This upward trend in nonmetro population change coincides with improving nonmetro employment trends. However, the overall nonmetro population change since 2010 remains negative, in contrast with an overall growth rate of 6.3 percent in metro areas during that same period.
- Population loss of 223,000 people represents a -0.5 percentage loss for nonmetro areas as a whole over the 2010-17 period. However, population loss is not evenly distributed across all nonmetro counties. Larger rates of population loss in some regions are offset by gains in other regions.
- 1,333 nonmetro counties lost population during 2010-17. Taken together, these counties declined in population by 907,000 people (-3.2 percent), while the 643 nonmetro counties that gained population grew by 3.8 percent and added 684,000 people.
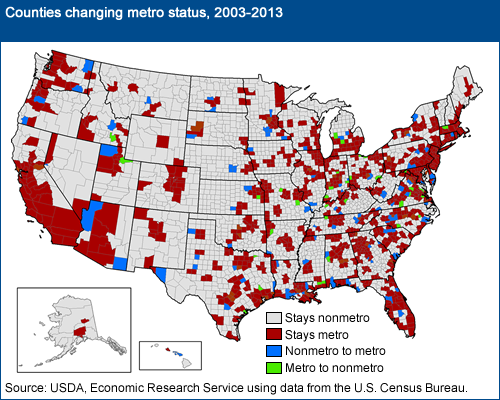
Nonmetro America also "loses" population every 10 years when nonmetro counties that have grown large enough become reclassified as metro. In the latest decennial update announced by the Office of Management and Budget in March 2013, 113 formerly nonmetro counties (with 5.9 million people) switched to metro status, while 36 counties (with 1 million people) no longer qualified as metro, resulting in a net nonmetro population "loss" of 4.9 million from reclassification. In the long run, removal of fast-growing counties means nonmetro America is less likely to sustain overall population growth.

Population change includes two major components: natural change (births minus deaths) and net migration (in-migrants minus out-migrants).
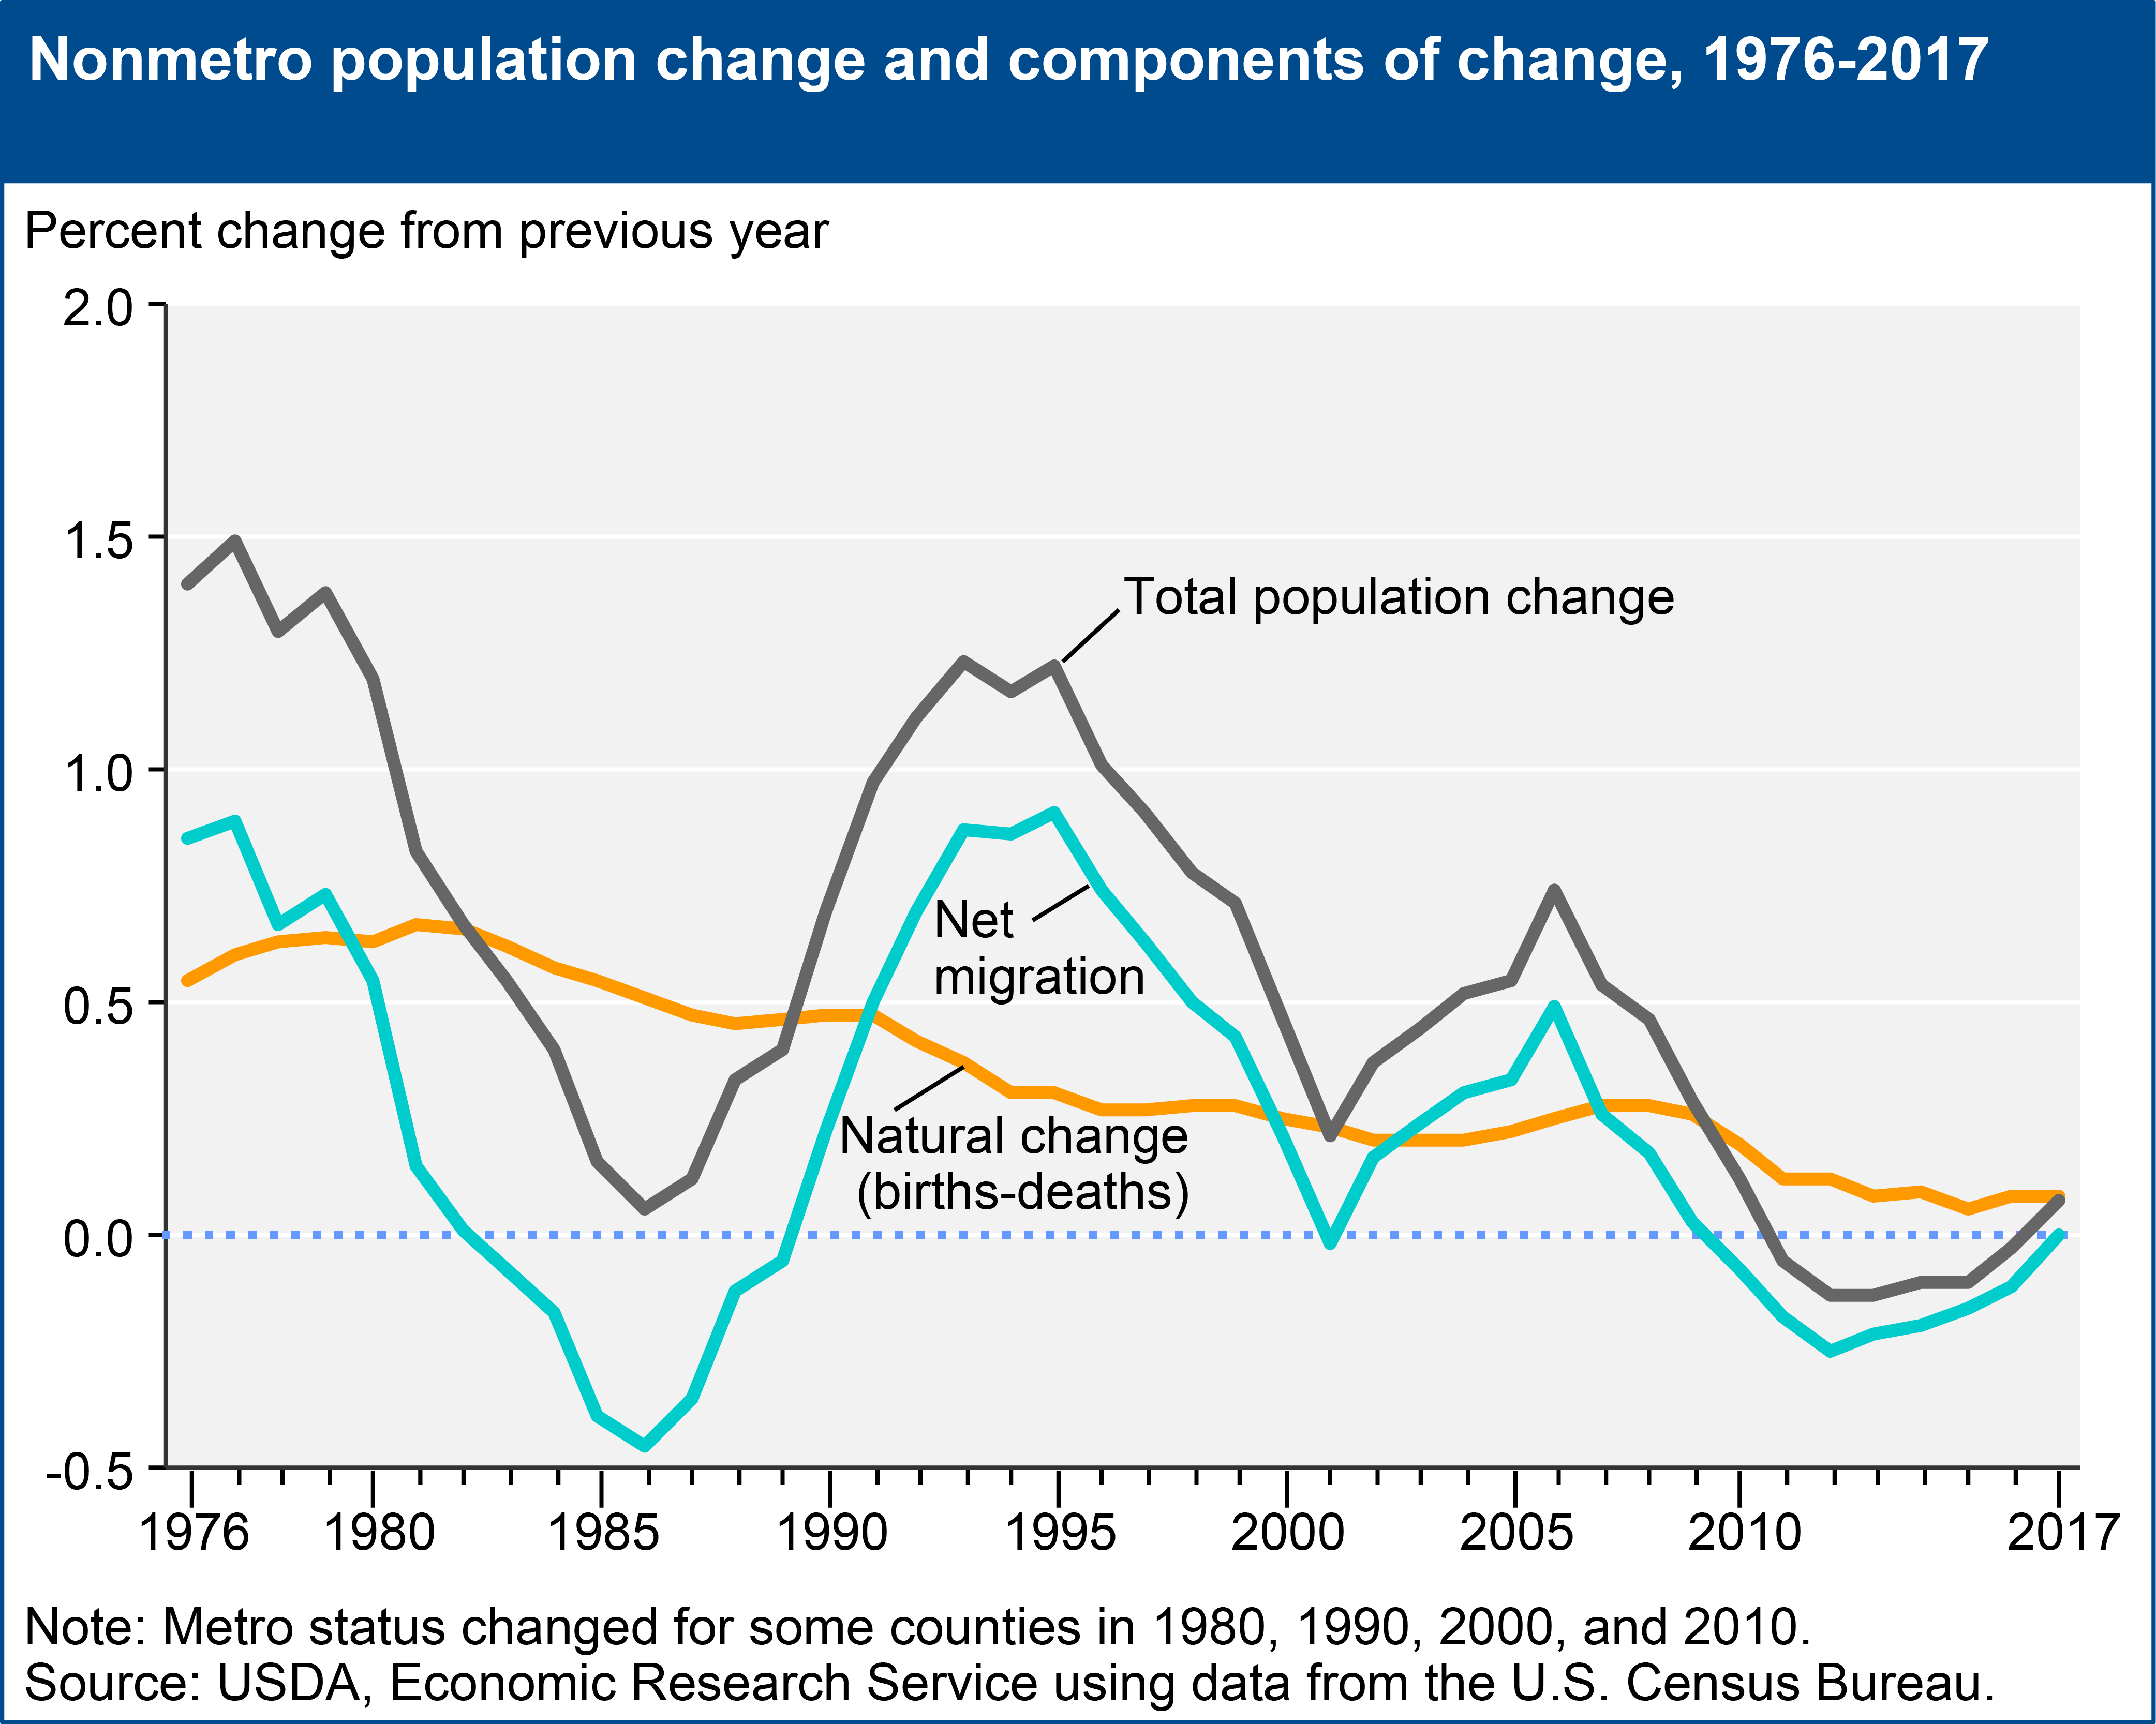
- Since 2010, the increase in nonmetro population from natural change (290,000 more births than deaths) has not matched the decrease in population from net migration (512,000 more people moved out than moved in).
- While natural change has gradually trended downward over time, net migration rates tend to fluctuate in response to economic conditions.

Download chart image | Chart data
- Net migration rates were often much lower in the past, but were always offset by higher rates of natural increase. Rural out-migration peaked in the 1950s and 1960s (not shown on graph), but was offset by high "baby boom" birthrates.
- Net out-migration from nonmetro areas was more severe during the 1980s compared with 2010-17, but overall population change remained positive during the 1980s because natural increase contributed roughly 0.5 percent growth annually (compared with less than 0.1 percent recently).
- Nonmetro net migration rates peaked during the 'rural rebound' in the mid-1990s and again in 2004-06, just prior to the housing mortgage crisis and economic recession. Net migration remained positive for much of the past two decades, increasing nonmetro population every year but one from 1990 to 2009, but net out-migration has since contributed to population loss.
- The Great Recession contributed to a downturn in natural increase, as fewer births occur during times of economic uncertainty. But falling birthrates and an aging population have steadily reduced population growth from natural increase in rural counties over time, in line with global trends.
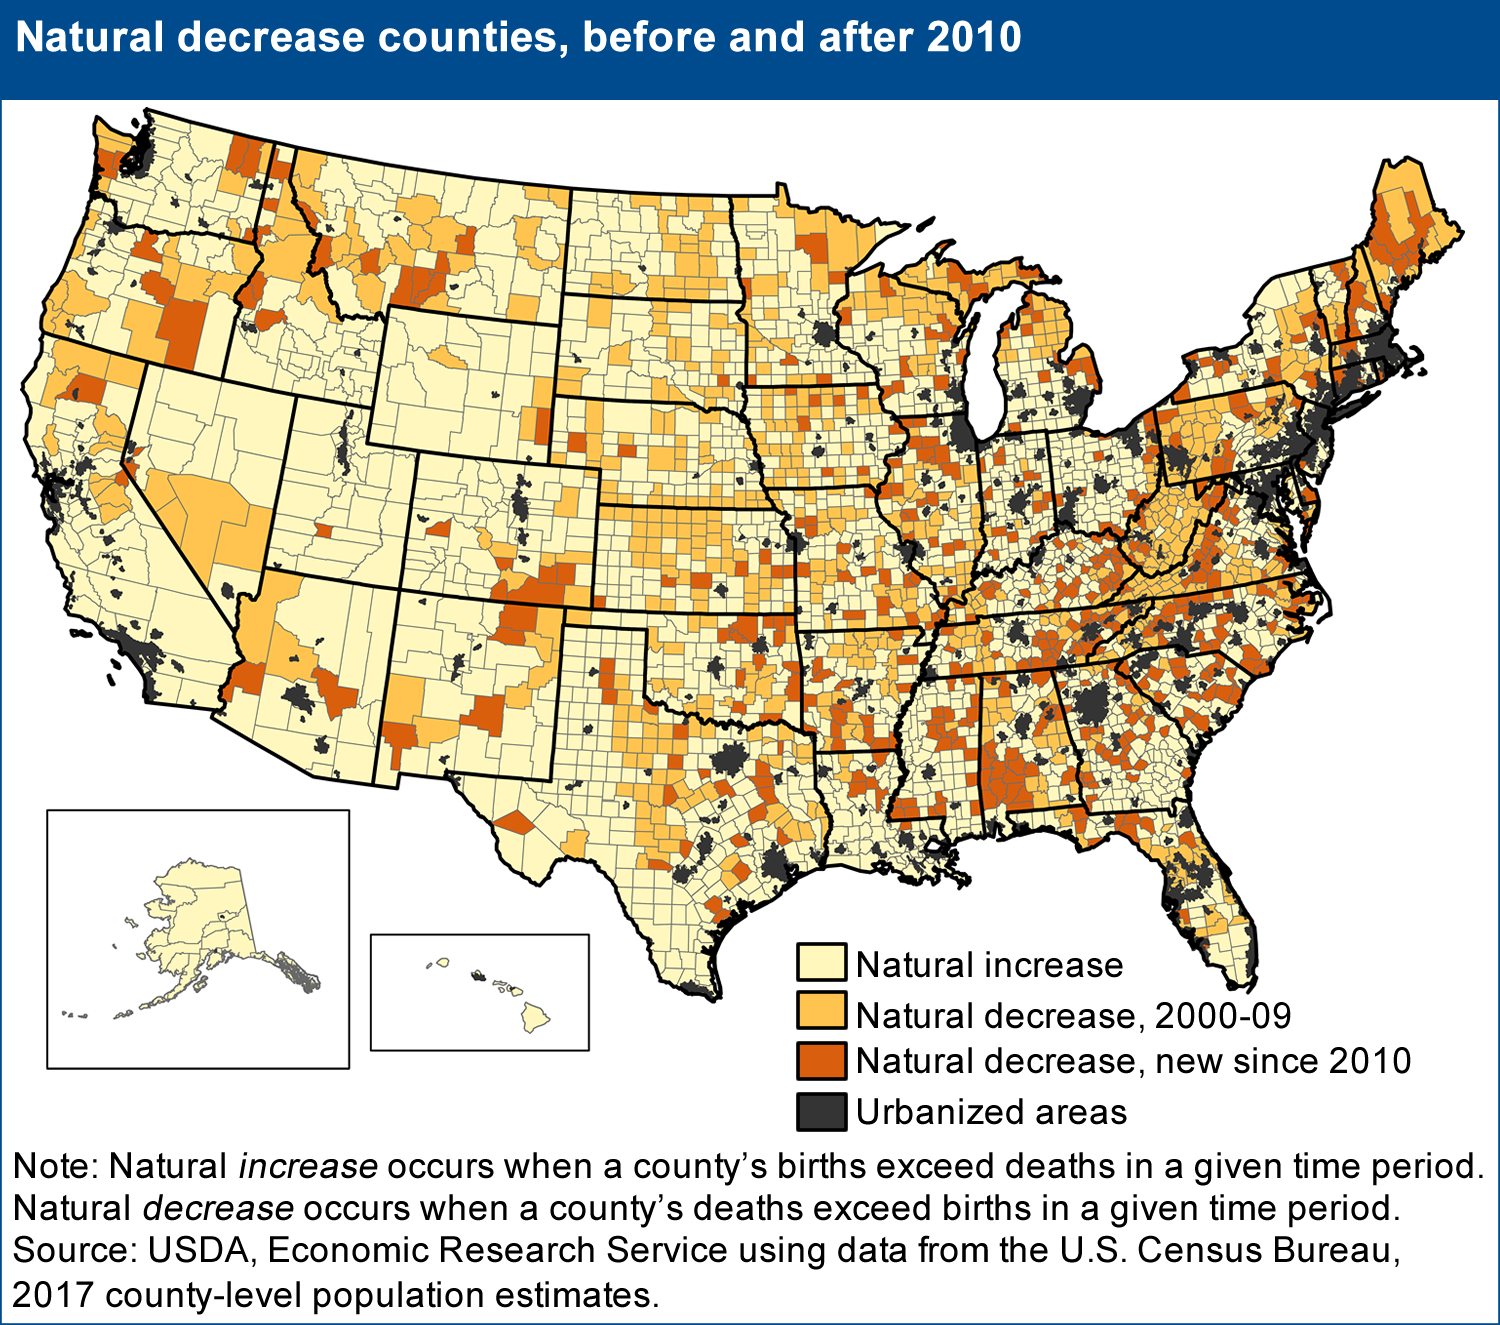
Lowering rates of natural change contributed to greater population decline in nonmetro areas and resulted in 349 counties experiencing sustained natural decrease during 2010-17 for the first time. The map shows natural change for all counties, metro and nonmetro. Urbanized areas (shown in dark gray) are at the center of metro areas, and nonmetro counties are those that are removed by some distance, depending on the size of the metro area.

- Areas that recently began experiencing natural decrease are found in the Northeast, South, and especially in and around the margins of Appalachia, expanding a large region of natural decrease that extends from Pennsylvania through northern Alabama.
- Counties end up as natural-decrease counties as a result of two separate demographic processes operating over several decades: retiree attraction and long-term out-migration of young adults (who take their future children with them, so to speak).
- Typically, these trends occur in different regions of the country: retiree in-migration in Florida, Arizona, and other Sunbelt locations, and young adult exodus in persistent out-migration areas such as in the Great Plains and Corn Belt. However, both trends are contributing to the emergence of natural decrease counties in many nonmetro regions, such as those in Virginia, Kentucky, North Carolina, Tennessee, and Michigan.
The cyclical downturn in net migration that began in 2007 bottomed out in 2012, and improving population trends since 2012 coincide with a marked improvement in nonmetro employment growth. Although it appears to have ended for now, the period of overall population loss during 2010-17 highlights a growing demographic challenge facing many regions across rural and small-town America: Population growth from natural increase is no longer large enough to offset cyclical net migration losses.

