
This is a summary of information from the U.S. Bureau of the Census’ American Community Survey (and other Federal statistical sources) on the educational attainment of the rural (nonmetropolitan) population. The summary also examines the relationship between educational attainment and economic outcomes. In addition to the following material, the USDA, Economic Research Service publication Rural Education at a Glance, 2017 Edition summarizes conditions and trends in education in rural areas.
Education is tied to the economic prosperity of rural people and places. The educational attainment of people living in rural (nonmetropolitan) areas has increased markedly over time but has not kept pace with urban (metropolitan) gains, especially in college and postgraduate education. Median earnings rise with higher levels of educational attainment, but more so in metro than in nonmetro areas, compounding the rural earnings disadvantage stemming from lower educational attainment.
Educational Attainment
While the overall educational attainment of people living in nonmetropolitan areas has increased markedly over time, the share of adults with at least a bachelor's degree is still higher in metropolitan counties. From 2000 to 2023, the share of rural U.S. adults with an associate degree increased from 5.7 percent to 10.2 percent of the population age 25 and older, the share with a bachelor's degree increased from 9.7 percent to 14.7 percent, and the share with an advanced degree increased from 5.2 percent to 8.3 percent. Additionally, the percentage of nonmetro adults 25 and older who had less than a high school diploma or equivalent decreased by 12.6 percentage points from 23.7 percent in 2000 to 11.1 percent in 2023. However, the gap between metro and nonmetro residents with a bachelor's degree or higher widened during the same period. From 2000 to 2023, the number of nonmetro residents who held a bachelor’s degree or higher rose by 8.1 percentage points compared to a 12 percentage point increase for their metro counterparts. This widened the metro-nonmetro gap from 11.4 percentage points to 15.3 percentage points over this period. Overall, adults in nonmetro areas were less likely to have a bachelor’s or advanced degree and were more likely to have a high school diploma or equivalent as their highest educational attainment.

Download chart image | Chart data
Educational Attainment and Labor Market Outcomes
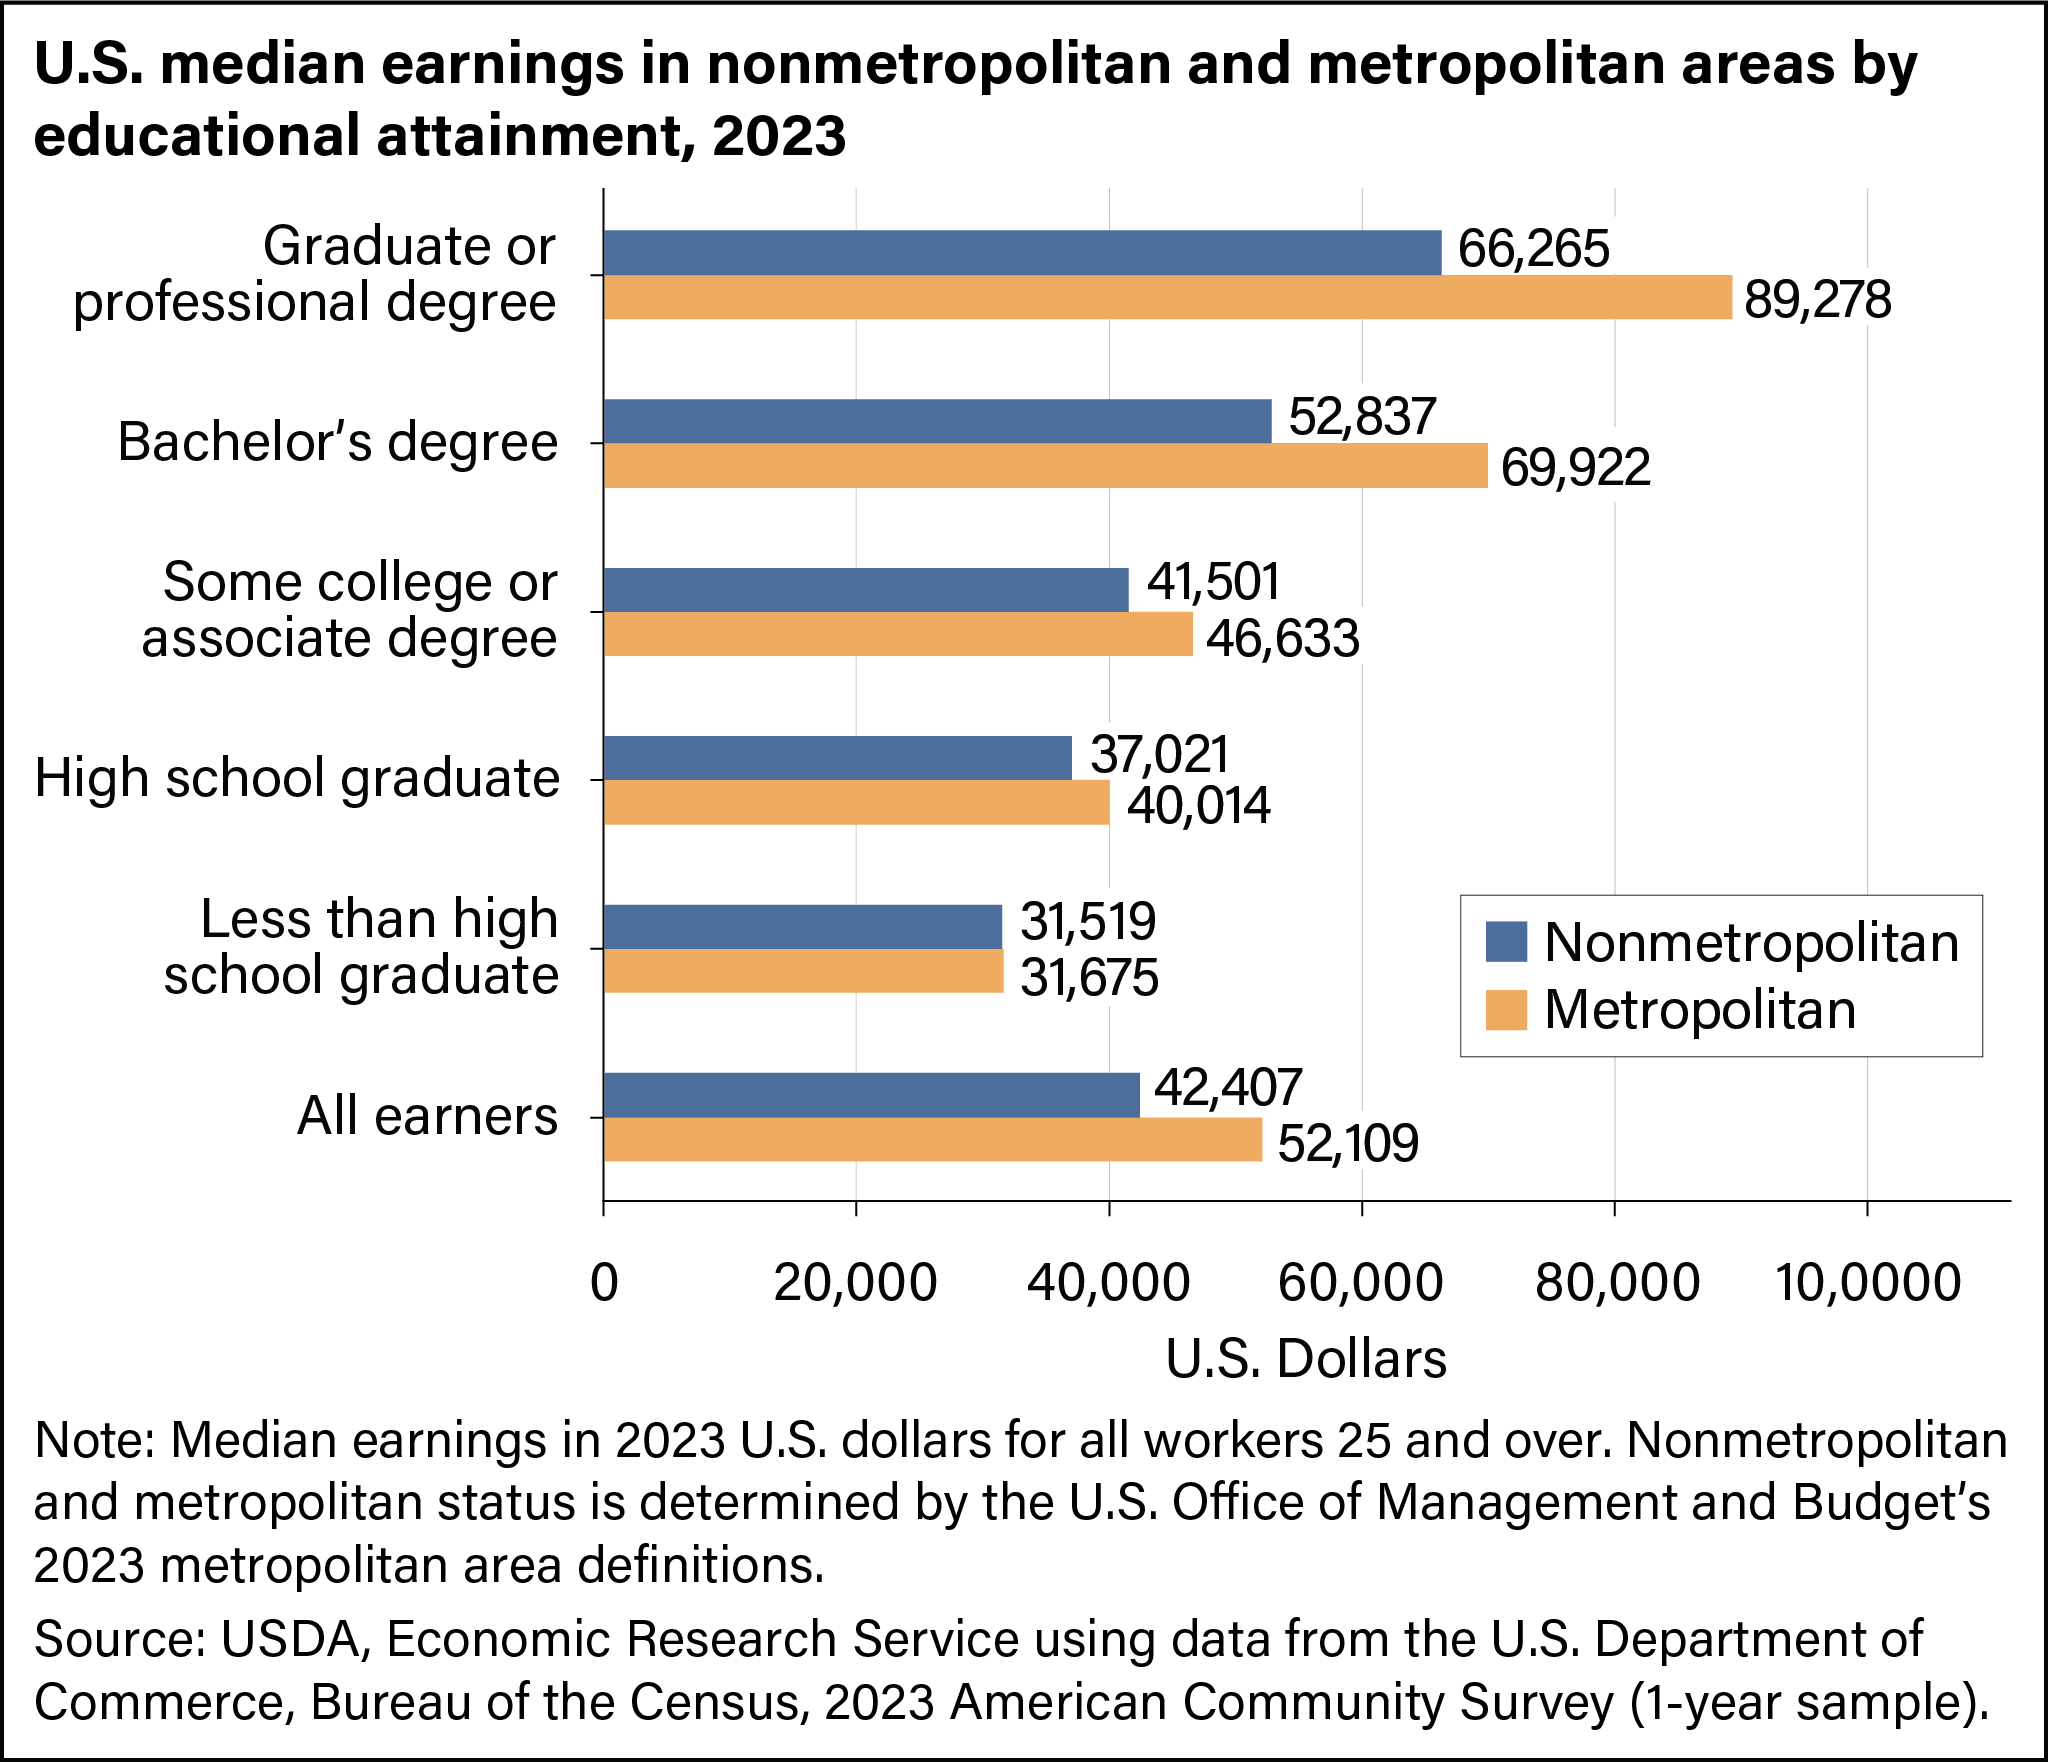
Education is associated with higher earnings in both nonmetropolitan and metropolitan areas. Median earnings for nonmetro working adults were $42,407 in 2023, almost $10,000 less than their metro peers ($52,109). Nonmetro workers with less than a high school diploma or equivalent made $31,519 in 2023, almost identical to metro workers with less than a high school diploma or equivalent ($31,675) but $21,318 less than nonmetro workers with a bachelor's degree ($52,837). Nonmetro workers increasingly earn more as their educational attainment increases, with the gap between workers with a graduate or professional degree and those with less than a high school diploma or equivalent being $34,746 per year, more than the median earnings for those with less than a high school diploma or equivalent ($31,519).
Download chart image | Chart data
The metro-nonmetro educational earnings gap for all earners is $9,702 annually and differs by educational level. As the level of educational attainment increases, so does the metro-nonmetro earnings gap. Those at lower levels of educational attainment tend to have a smaller earnings gap compared to higher levels of attainment. Median earnings for the nonmetro population 25 years and older lag their metro peers in all educational attainment categories, with the difference increasing for those who hold a college degree.
The Geography of Low Educational Attainment
Despite the gains made in educational attainment over time, there is still wide geographic variation in educational attainment within rural areas. The figure below shows areas with low levels of educational attainment, defined here as counties where 20 percent or more of the working-age population (adults age 25–64) lacked a high school diploma or equivalent during 2019–23. There are 172 such counties in the United States and the majority of these (137)—about 4 out of 5—are in rural areas. Rural counties with low levels of educational attainment differ regionally. These counties tend to be clustered in the South (as defined by the U.S. Census Bureau’s regions), with the area holding 75 percent of all nonmetro low-education counties (103 out of 137). This region is followed by the Midwest at 15 percent (21 out of 137 counties), the West at 9 percent (12 out of 137 counties) and the Northeast at less than 1 percent (1 out of 137 counties). Texas holds 27.8 percent of the nonmetropolitan low-education counties (38 out of 137), followed by Georgia with 10.2 percent (14 out of 137), and Kentucky with 8.0 (11 out of 137). Overall, 33 States had at least 1 county considered low education.

A note about the data source for county-level information. The American Community Survey (ACS) was developed by the Census Bureau to replace the long form of the decennial census. The ACS uses a rolling sample of U.S. housing units (295,000 monthly) to provide basic population characteristics annually. ACS accumulates samples over 5-year intervals to produce estimates for areas with smaller populations; only the 5-year-average ACS provides coverage for all counties in the United States.