According to a U.S. Geological Survey report, agriculture is a major user of ground and surface water in the United States, and irrigation accounted for 42 percent of the Nation’s total freshwater withdrawals in 2015. Water applied as irrigation allows for crop production in arid regions and supplements soil moisture in humid regions when growing season precipitation is insufficient. Irrigation has enhanced both the productivity and profitability of the agricultural sector. According to the 2017 Census of Agriculture, farms with some form of irrigation accounted for more than 54 percent of the total value of U.S. crop sales, while irrigated land accounted for less than 20 percent of harvested cropland. Irrigated crop production helps to support local rural economies in many areas of the U.S., and contributes to the Nation’s livestock, food processing, transportation, and energy sectors.
Where Does U.S. Crop Irrigation Occur?
The 2017 Census of Agriculture reported total U.S. irrigated cropland at 58 million acres. Much of the irrigated land is concentrated in the western U.S. where the production of many crops requires irrigation. Irrigation is also common in the southeastern U.S., particularly along the Mississippi River Valley in Arkansas, Louisiana, and Tennessee as well as southern Georgia and central Florida. Where irrigation occurs depends on regional cropping patterns, local climatic conditions as well as the availability of surface and groundwater resources.
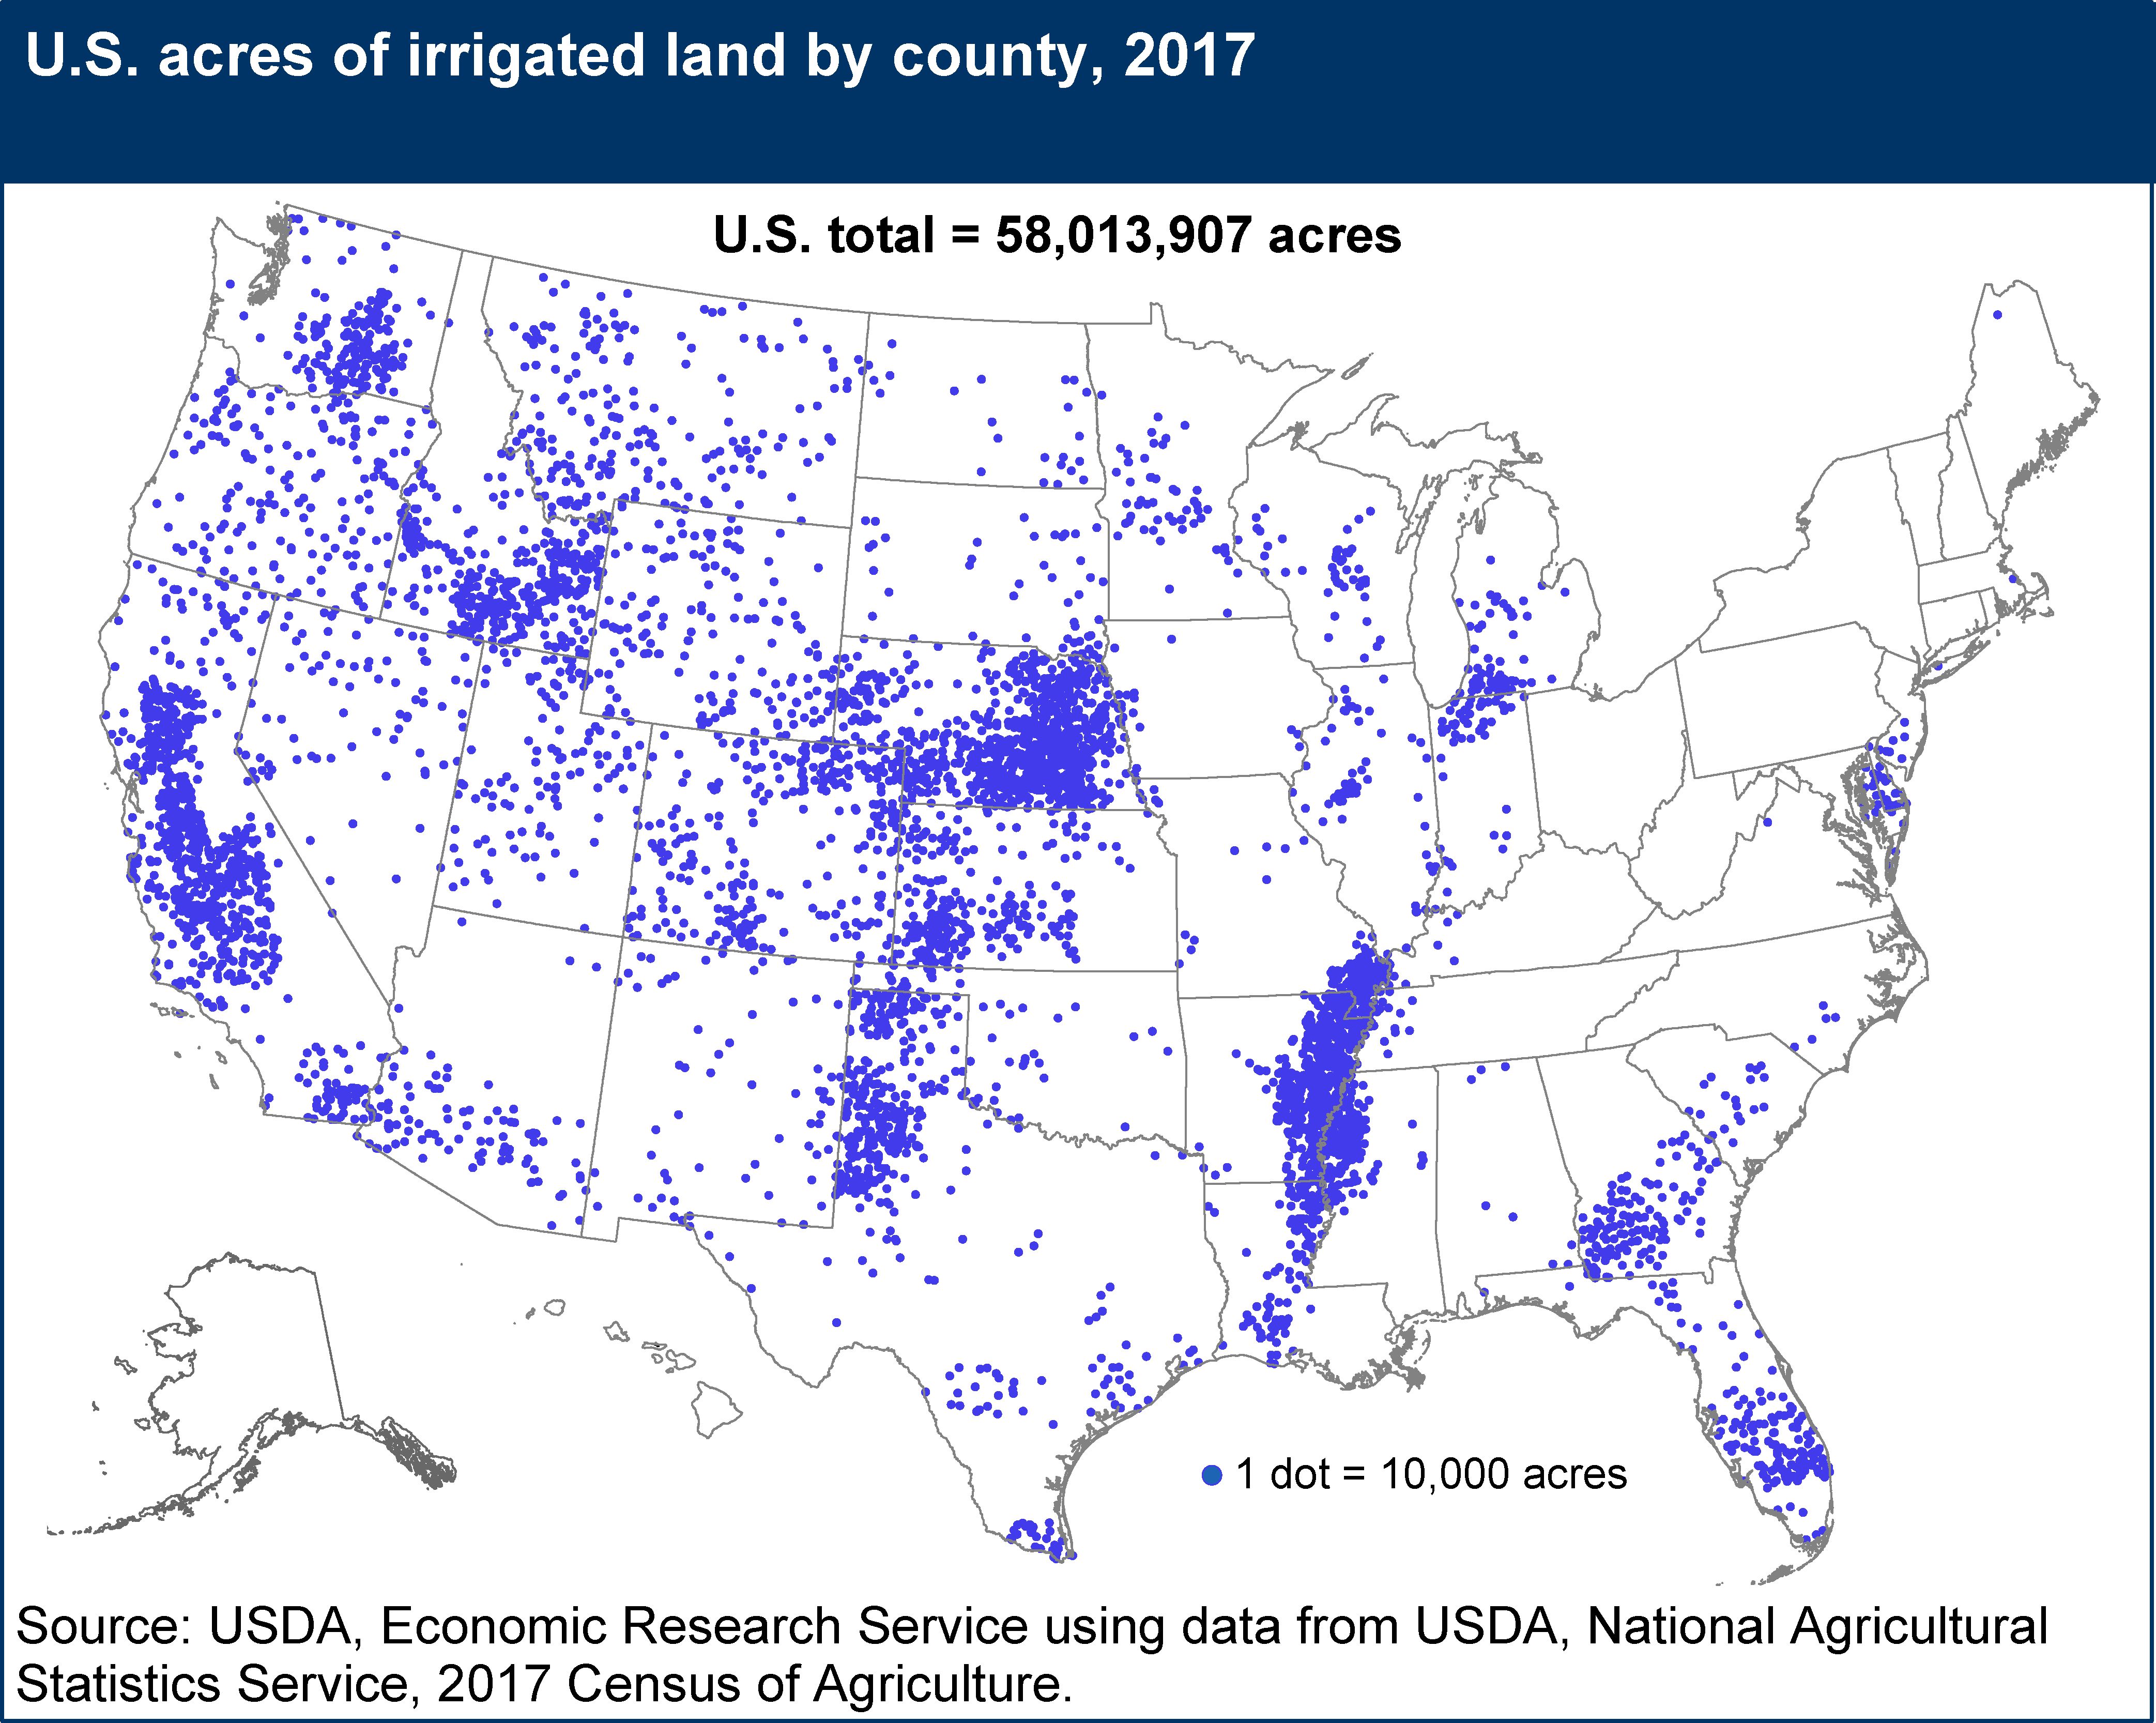
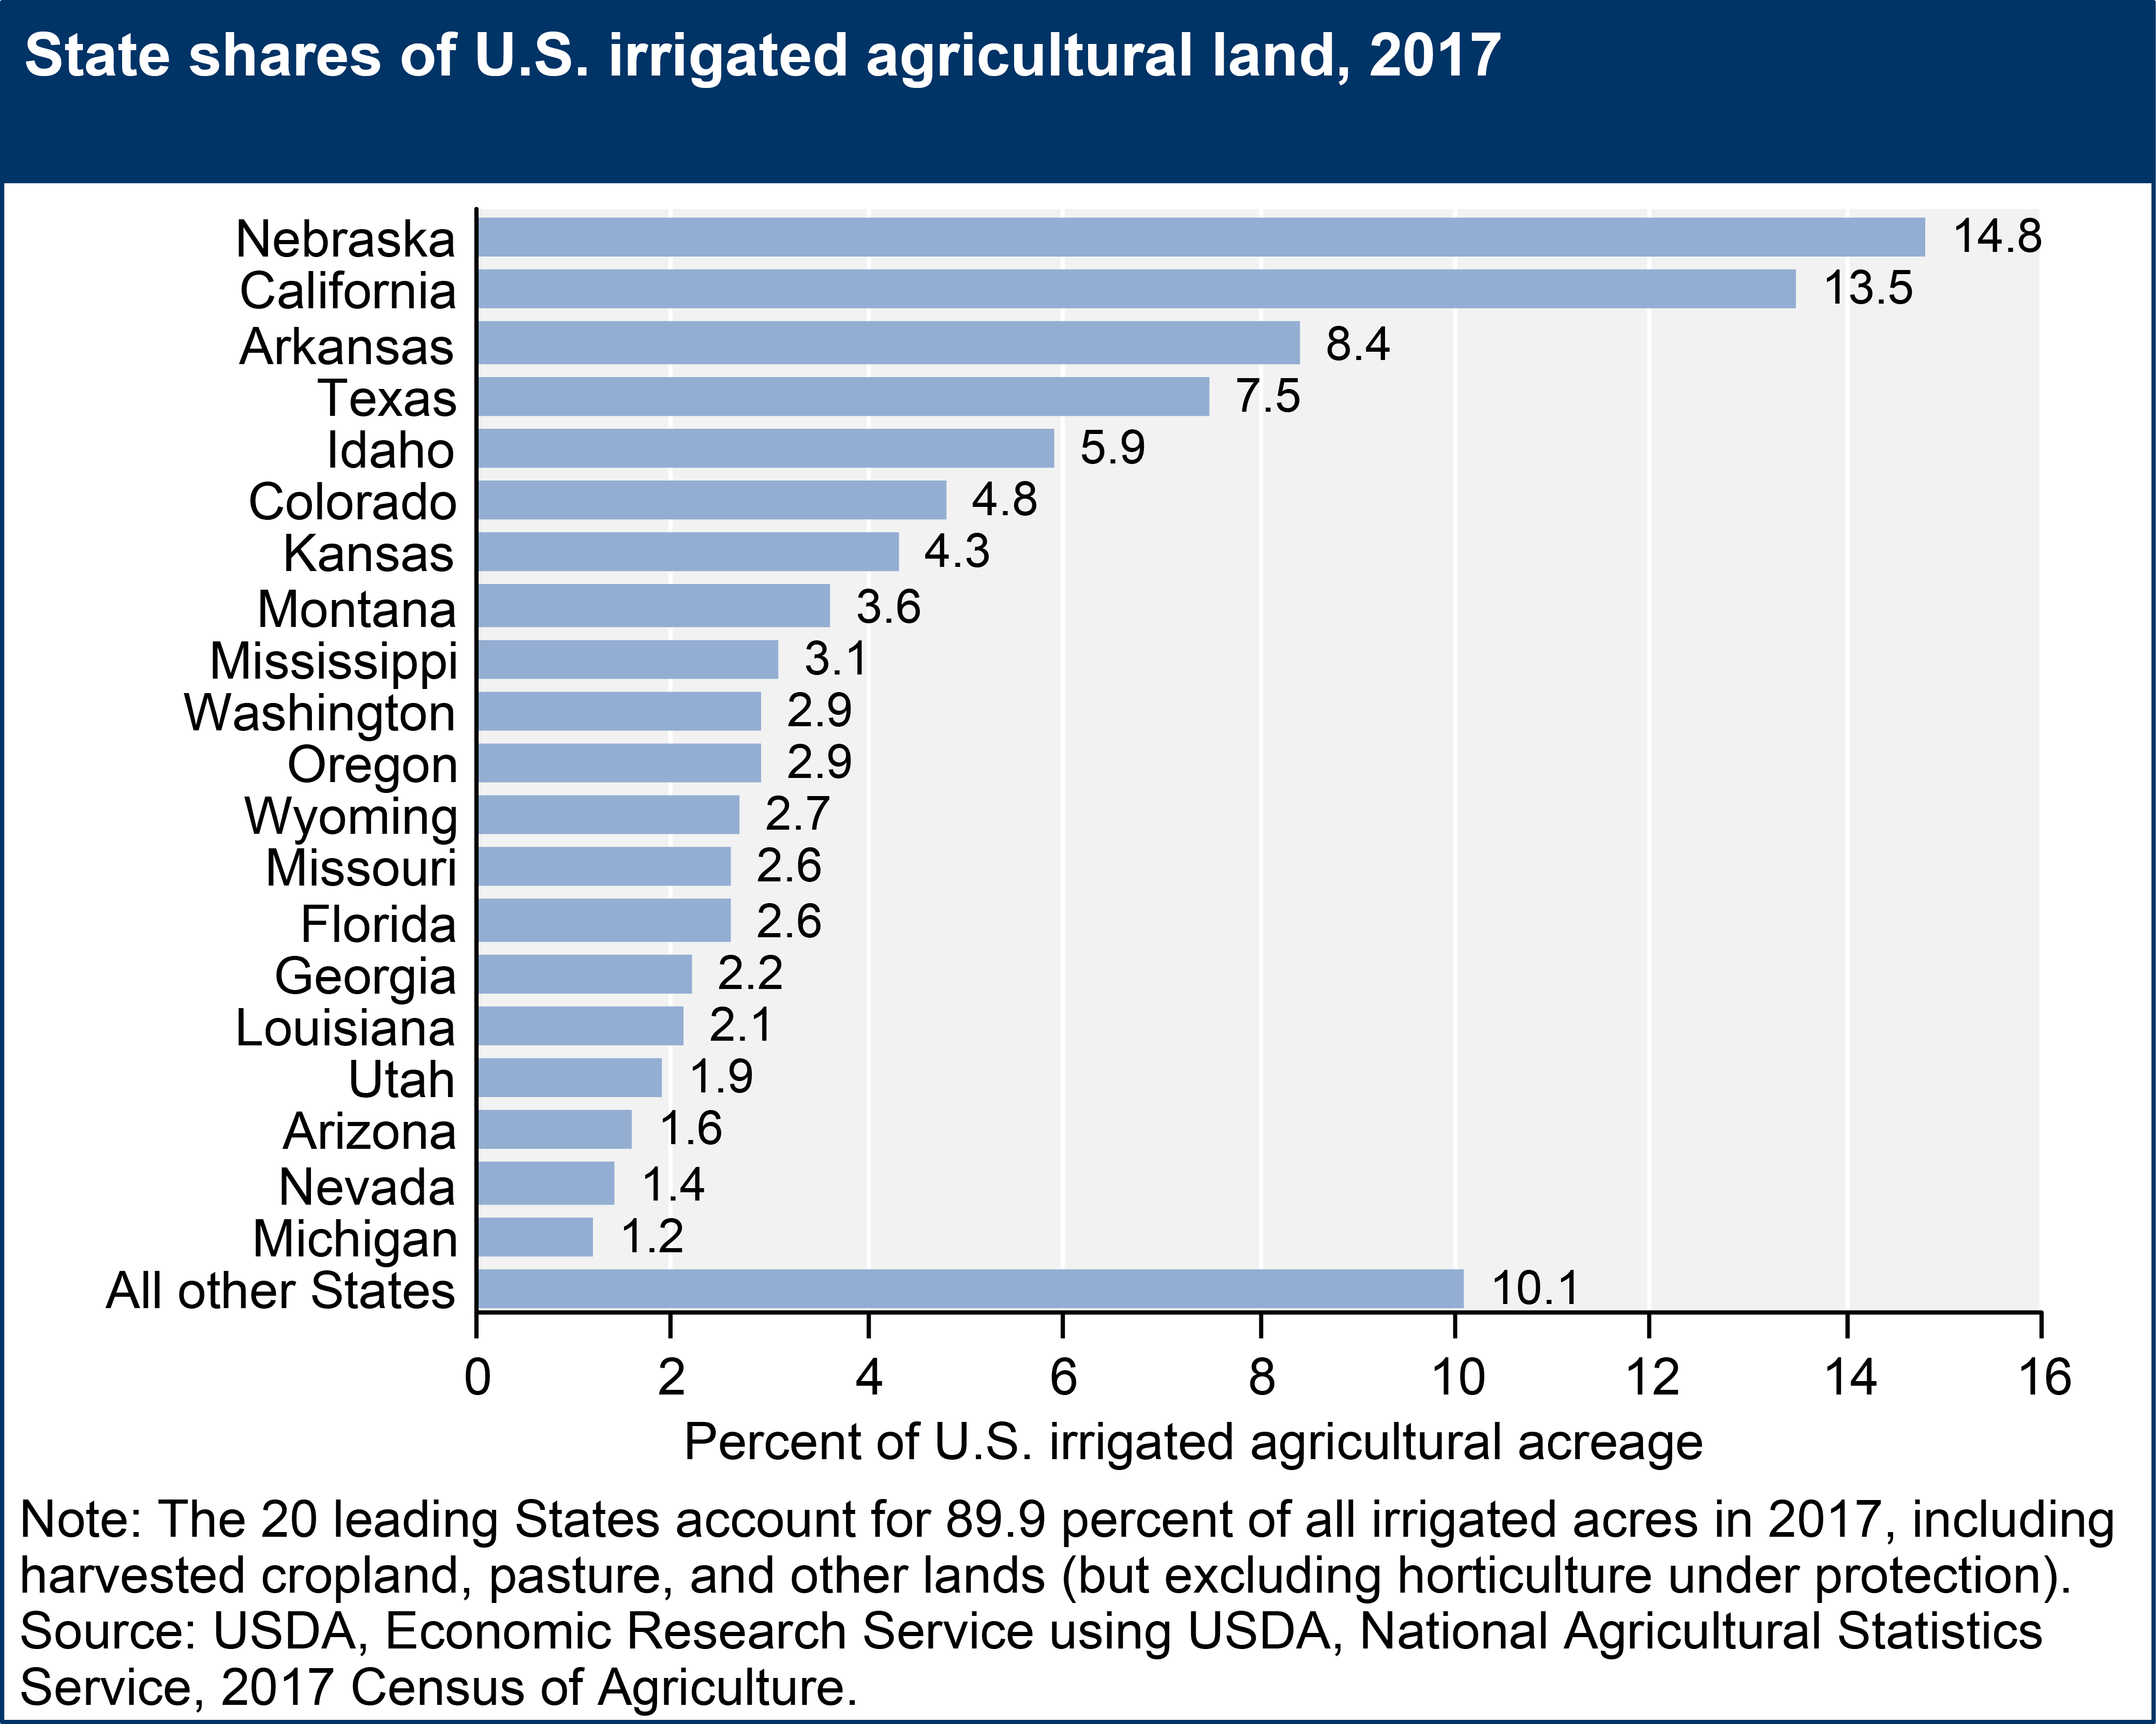
Nebraska had the most irrigated land among all U.S. States, with 8.6 million acres of irrigated cropland, accounting for 14.8 percent of all irrigated cropland in the United States. The prevalence of irrigated acreage in Nebraska relates to the abundance of groundwater resources as much of the state overlies the High Plains (Ogallala) aquifer. California ranked second, with 7.8 million acres, or 13.5 percent of all U.S. irrigated cropland; Arkansas, Texas, and Idaho rounded out the top 5 States in total irrigated cropland acreage in 2017. The twenty highest-ranked States in irrigated acreage accounted for about 90 percent of all irrigated land in 2017.
Download chart image | Chart data
How Has Irrigation Evolved Over Time?
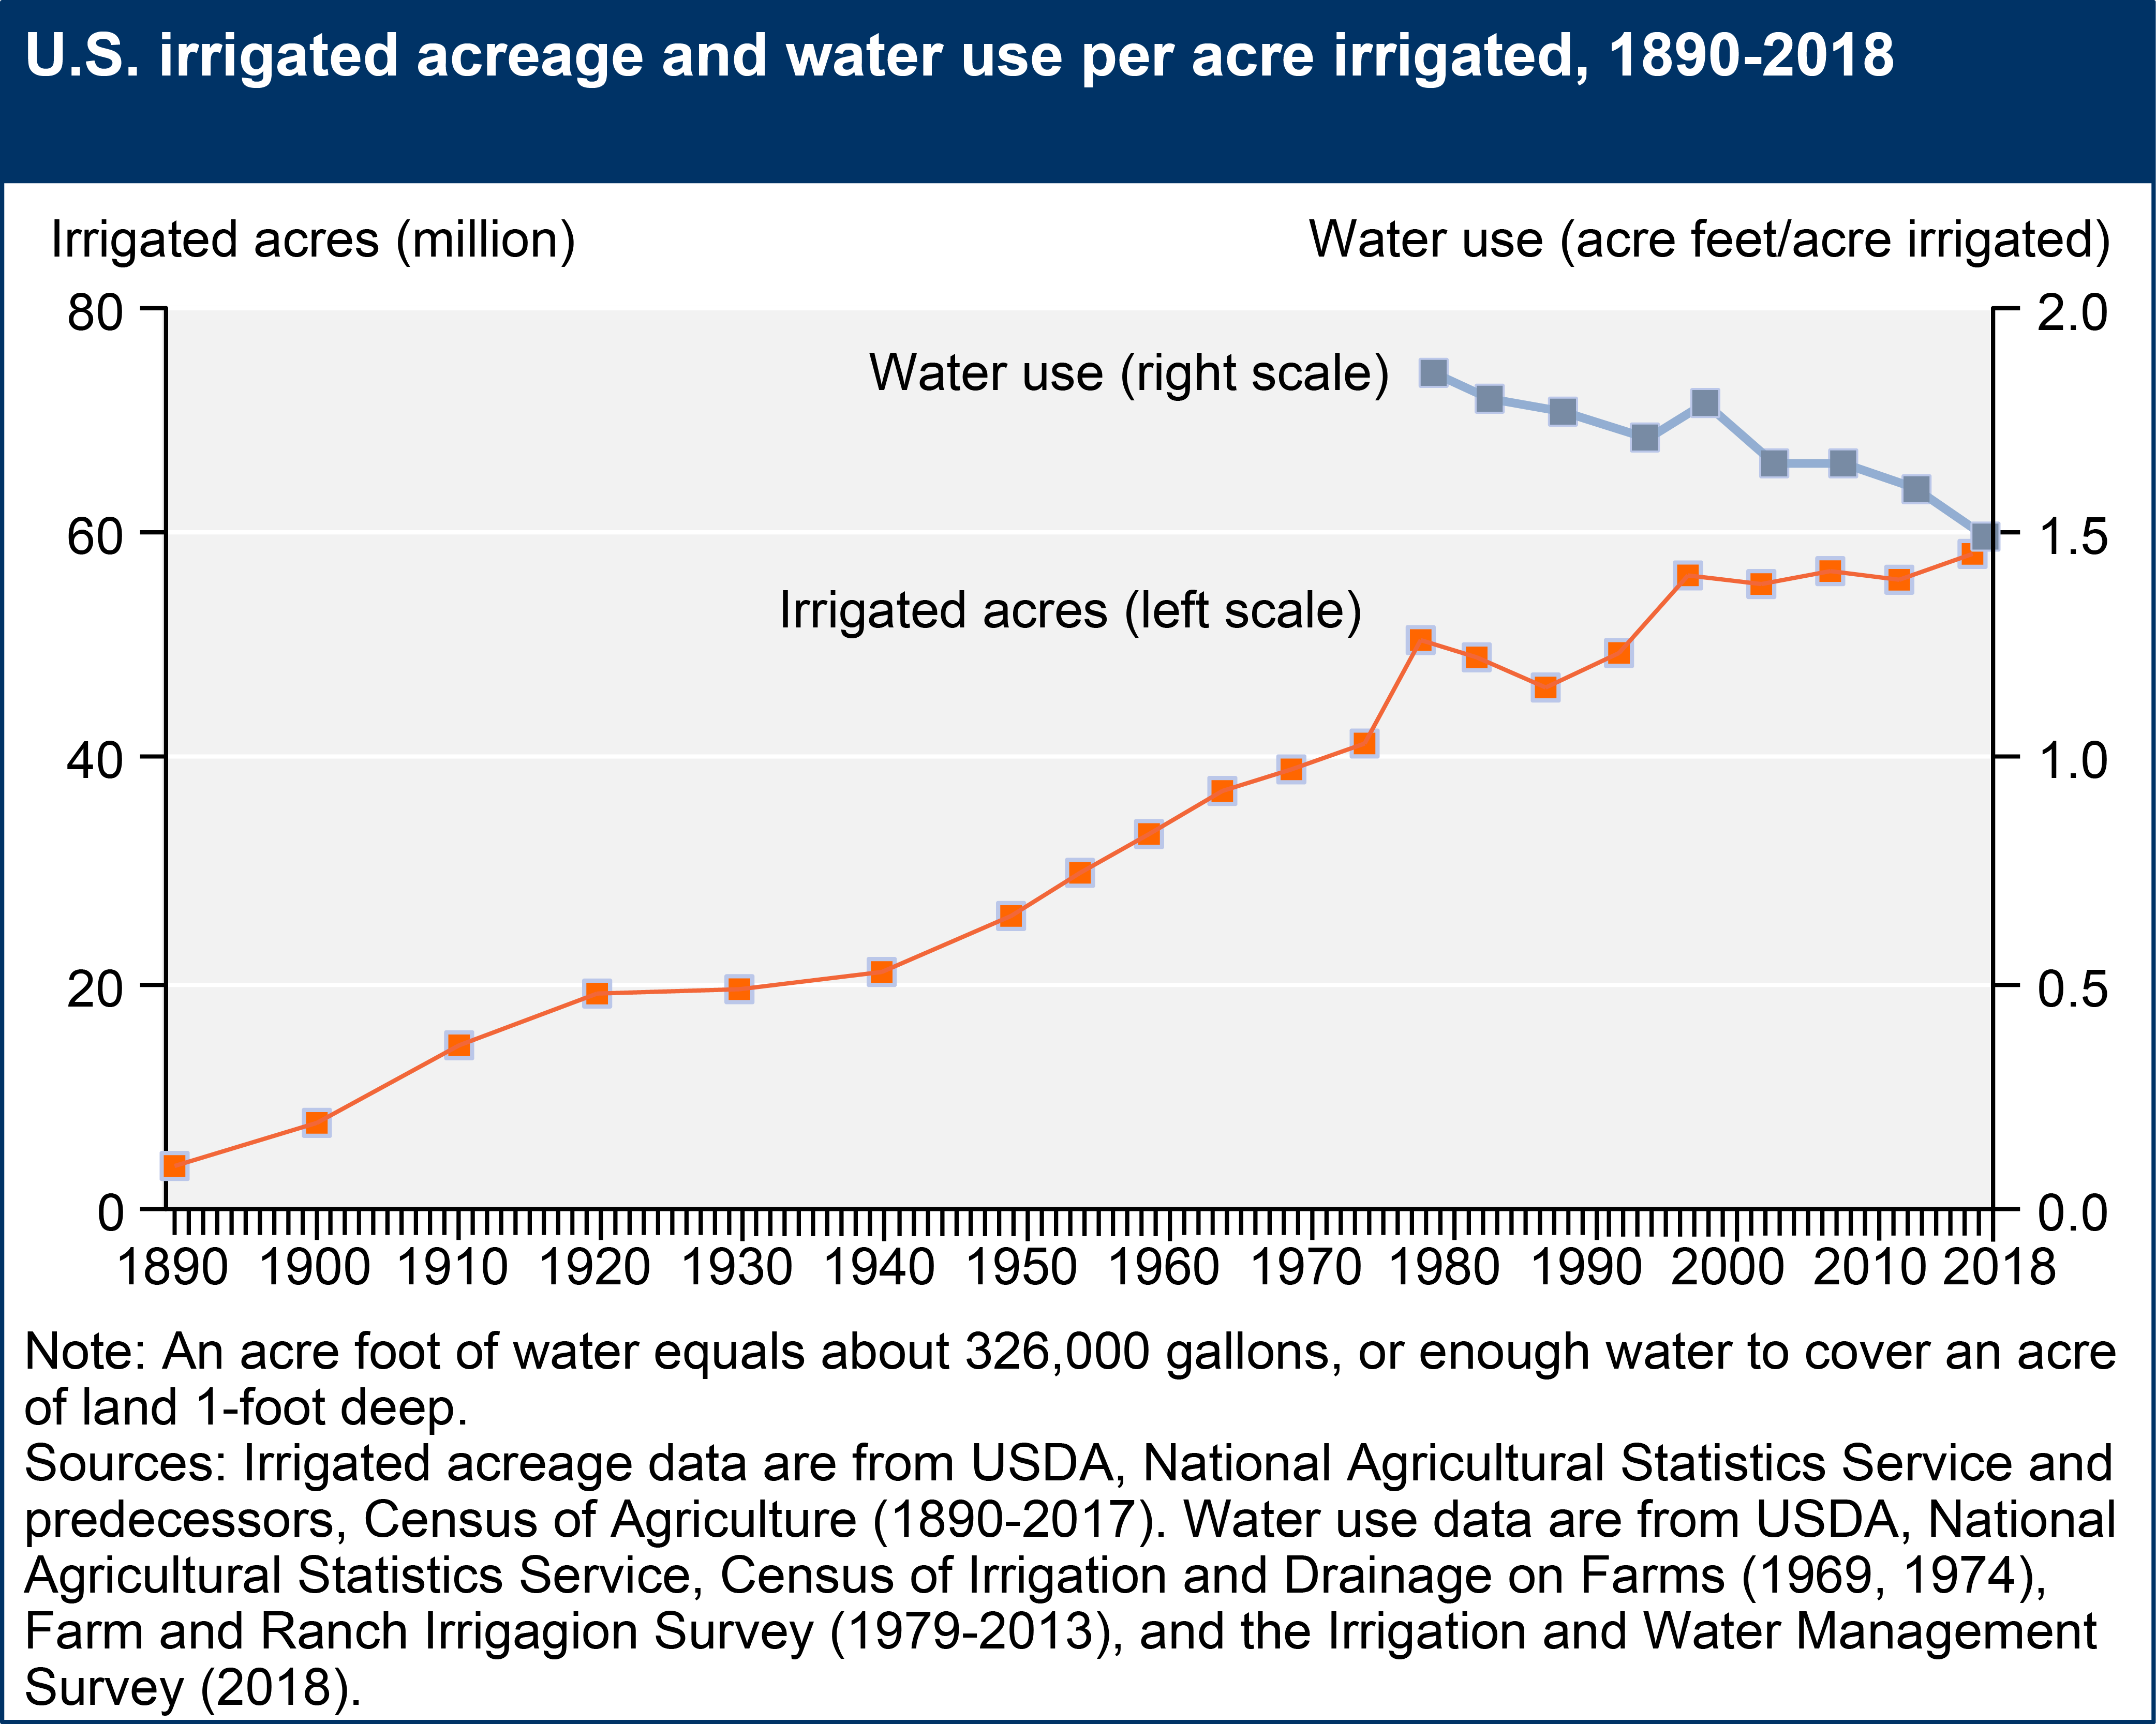
The importance of irrigation for U.S. agricultural production has evolved over the past century. Since 1890, irrigated acreage nationwide has grown from less than 3 million acres to over 58 million acres in 2017. Expansion in the nation’s irrigated land was attributable, in part, to federal, State and local water development projects as well as innovations in groundwater pumping technologies. More recently, the intensity of irrigation (measured as the nationwide average of water use per acre irrigated) has declined in response to regional shifts in area irrigated, changing cropping patterns, and improved efficiency in water application technologies. Between 1969 and 2017, the average irrigation application rate declined from more than 2 acre feet per acre irrigated to just under 1.5 acre feet per acre irrigated (1 acre-foot = 325,851 gallons).
Download chart image | Chart data
National trends in total irrigated acres belie important inter-regional variation in where irrigation occurs. Between 1997 and 2017 total irrigated agricultural land in California decreased from 8.8 to 7.8 million acres while irrigated land in Nebraska increased from 7 to 8.6 million acres. Over this same time period, irrigated cropland acreage in Arkansas increased by more than 1 million acres while Texas saw a decline of nearly 1.5 million acres. In 2012, Arkansas supplanted Texas as the State with the third most irrigated acres behind Nebraska and California. These observed regional trends reflect how changing water availability related to competing water demands, drought effects on surface water supplies and groundwater depletion has influenced the regional distribution of irrigated production.

Which Crops Are Irrigated?
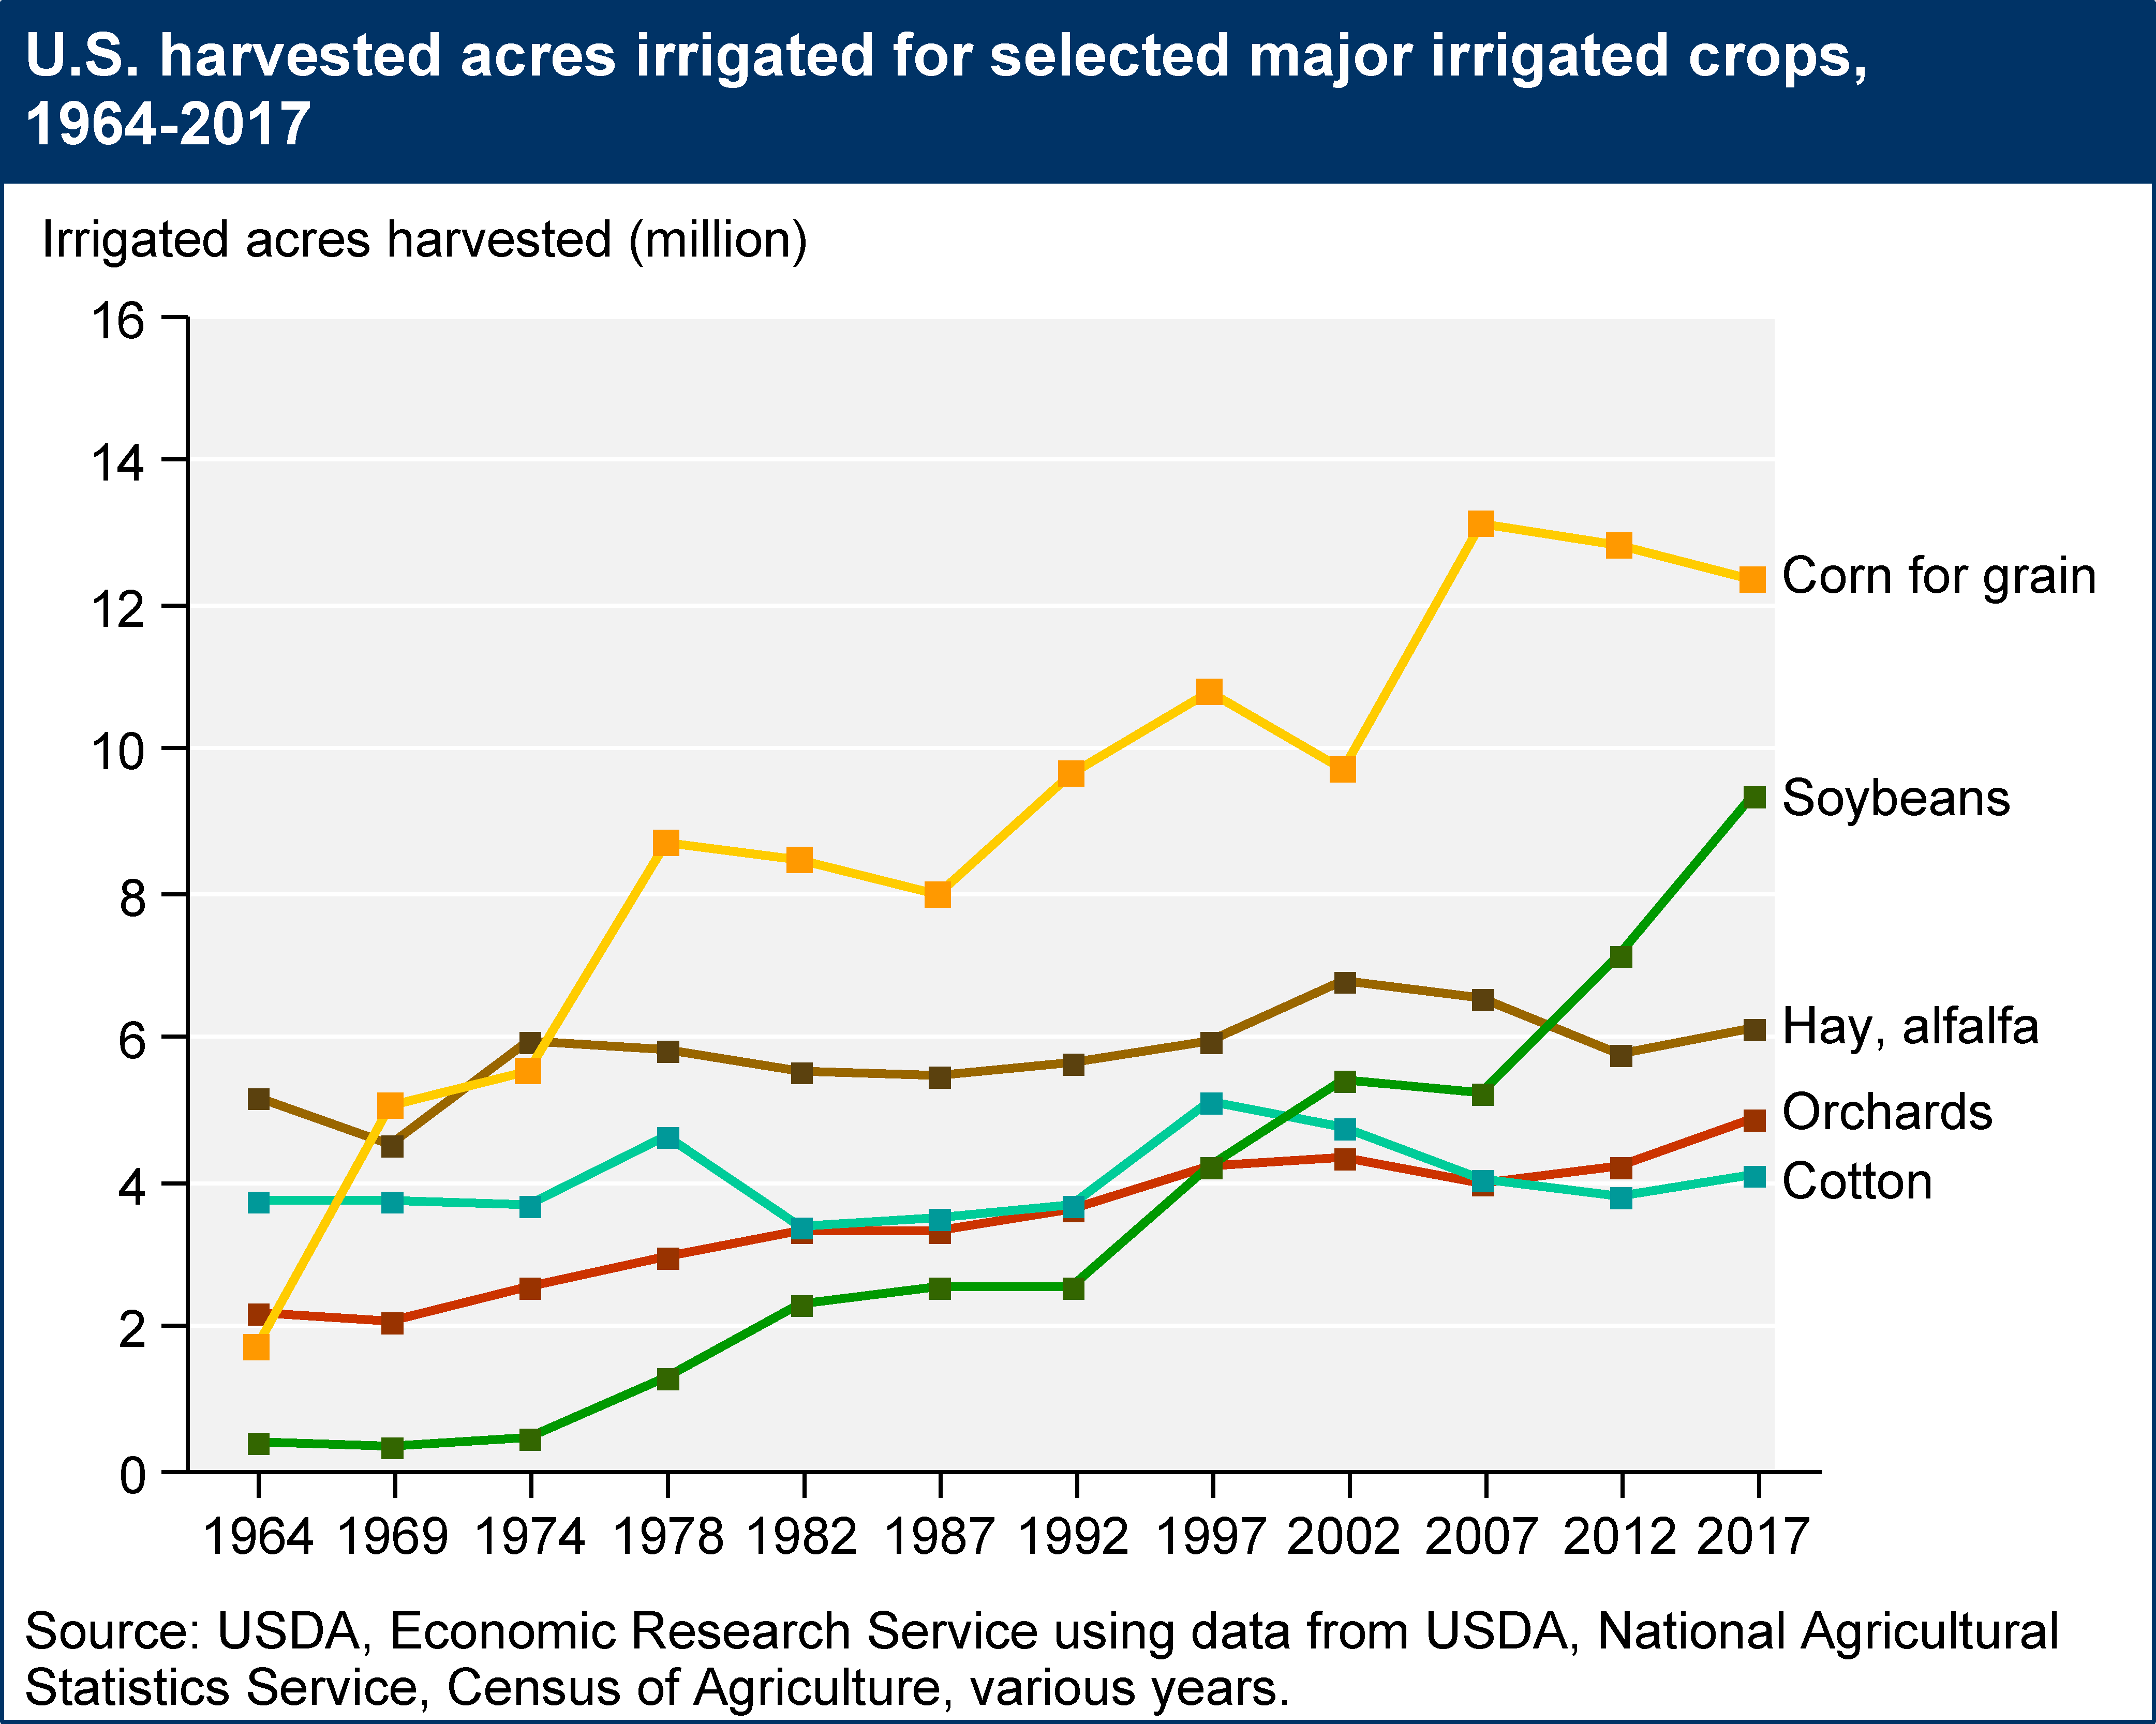
Irrigation water allocations by crop reflect climate and crop-water consumptive requirements as well as shifting market conditions. Irrigated acres planted in corn and soybeans have expanded in the past 50 years. In 1964, cotton and hay, alfalfa were the leading irrigated crops, with corn and soybeans together accounting for less than 2.5 million irrigated acres. In 2017, corn grown for grain accounted for the most irrigated acreage in the U.S. with more than 12 million irrigated acres harvested. Soybeans accounted for the second most irrigated acreage in 2017 with more than 9 million irrigated acres harvested. The shift reflects expanding market demand for corn and soybeans as livestock feed and source for biofuel, as well as the broader eastern shift of irrigated agriculture where variable growing season rainfall promotes irrigating corn and soybean crops.
Download chart image | Chart data
What Sources of Water Does Irrigated Agriculture Use?
Irrigated agriculture relies on both surface water and groundwater to support crop production. According to the 2018 Irrigation and Water Management Survey, more than half of all water applied as irrigation came from surface water with the remaining water obtained from groundwater sources. Surface water-fed irrigation is most common in the western U.S. where federal reclamation policy and State investments in irrigation infrastructure have harnessed the region’s surface water resources.
In many of the most prominent irrigated agricultural regions of the U.S, on-farm water withdrawals are generally supplied or managed by a local irrigation organization. Water delivery organizations operate water storage and conveyance systems used to supply water to irrigated farms. Groundwater organizations help to manage irrigation pumping from local groundwater resources. The USDA’s 2019 Survey of Irrigation Organizations provides a nationally representative look at these irrigation water supply organizations. The majority of irrigation organizations deliver water to farms as their primary function. More than one quarter of all organizations manage on-farm groundwater withdrawals for irrigation. Many organizations provide the dual functions of water supply delivery and groundwater management. Irrigation organizations may also provide important secondary functions such as electricity generation and water management for recreation purposes or wildlife habitat.

Download chart image | Chart data
How Are Crops Irrigated?
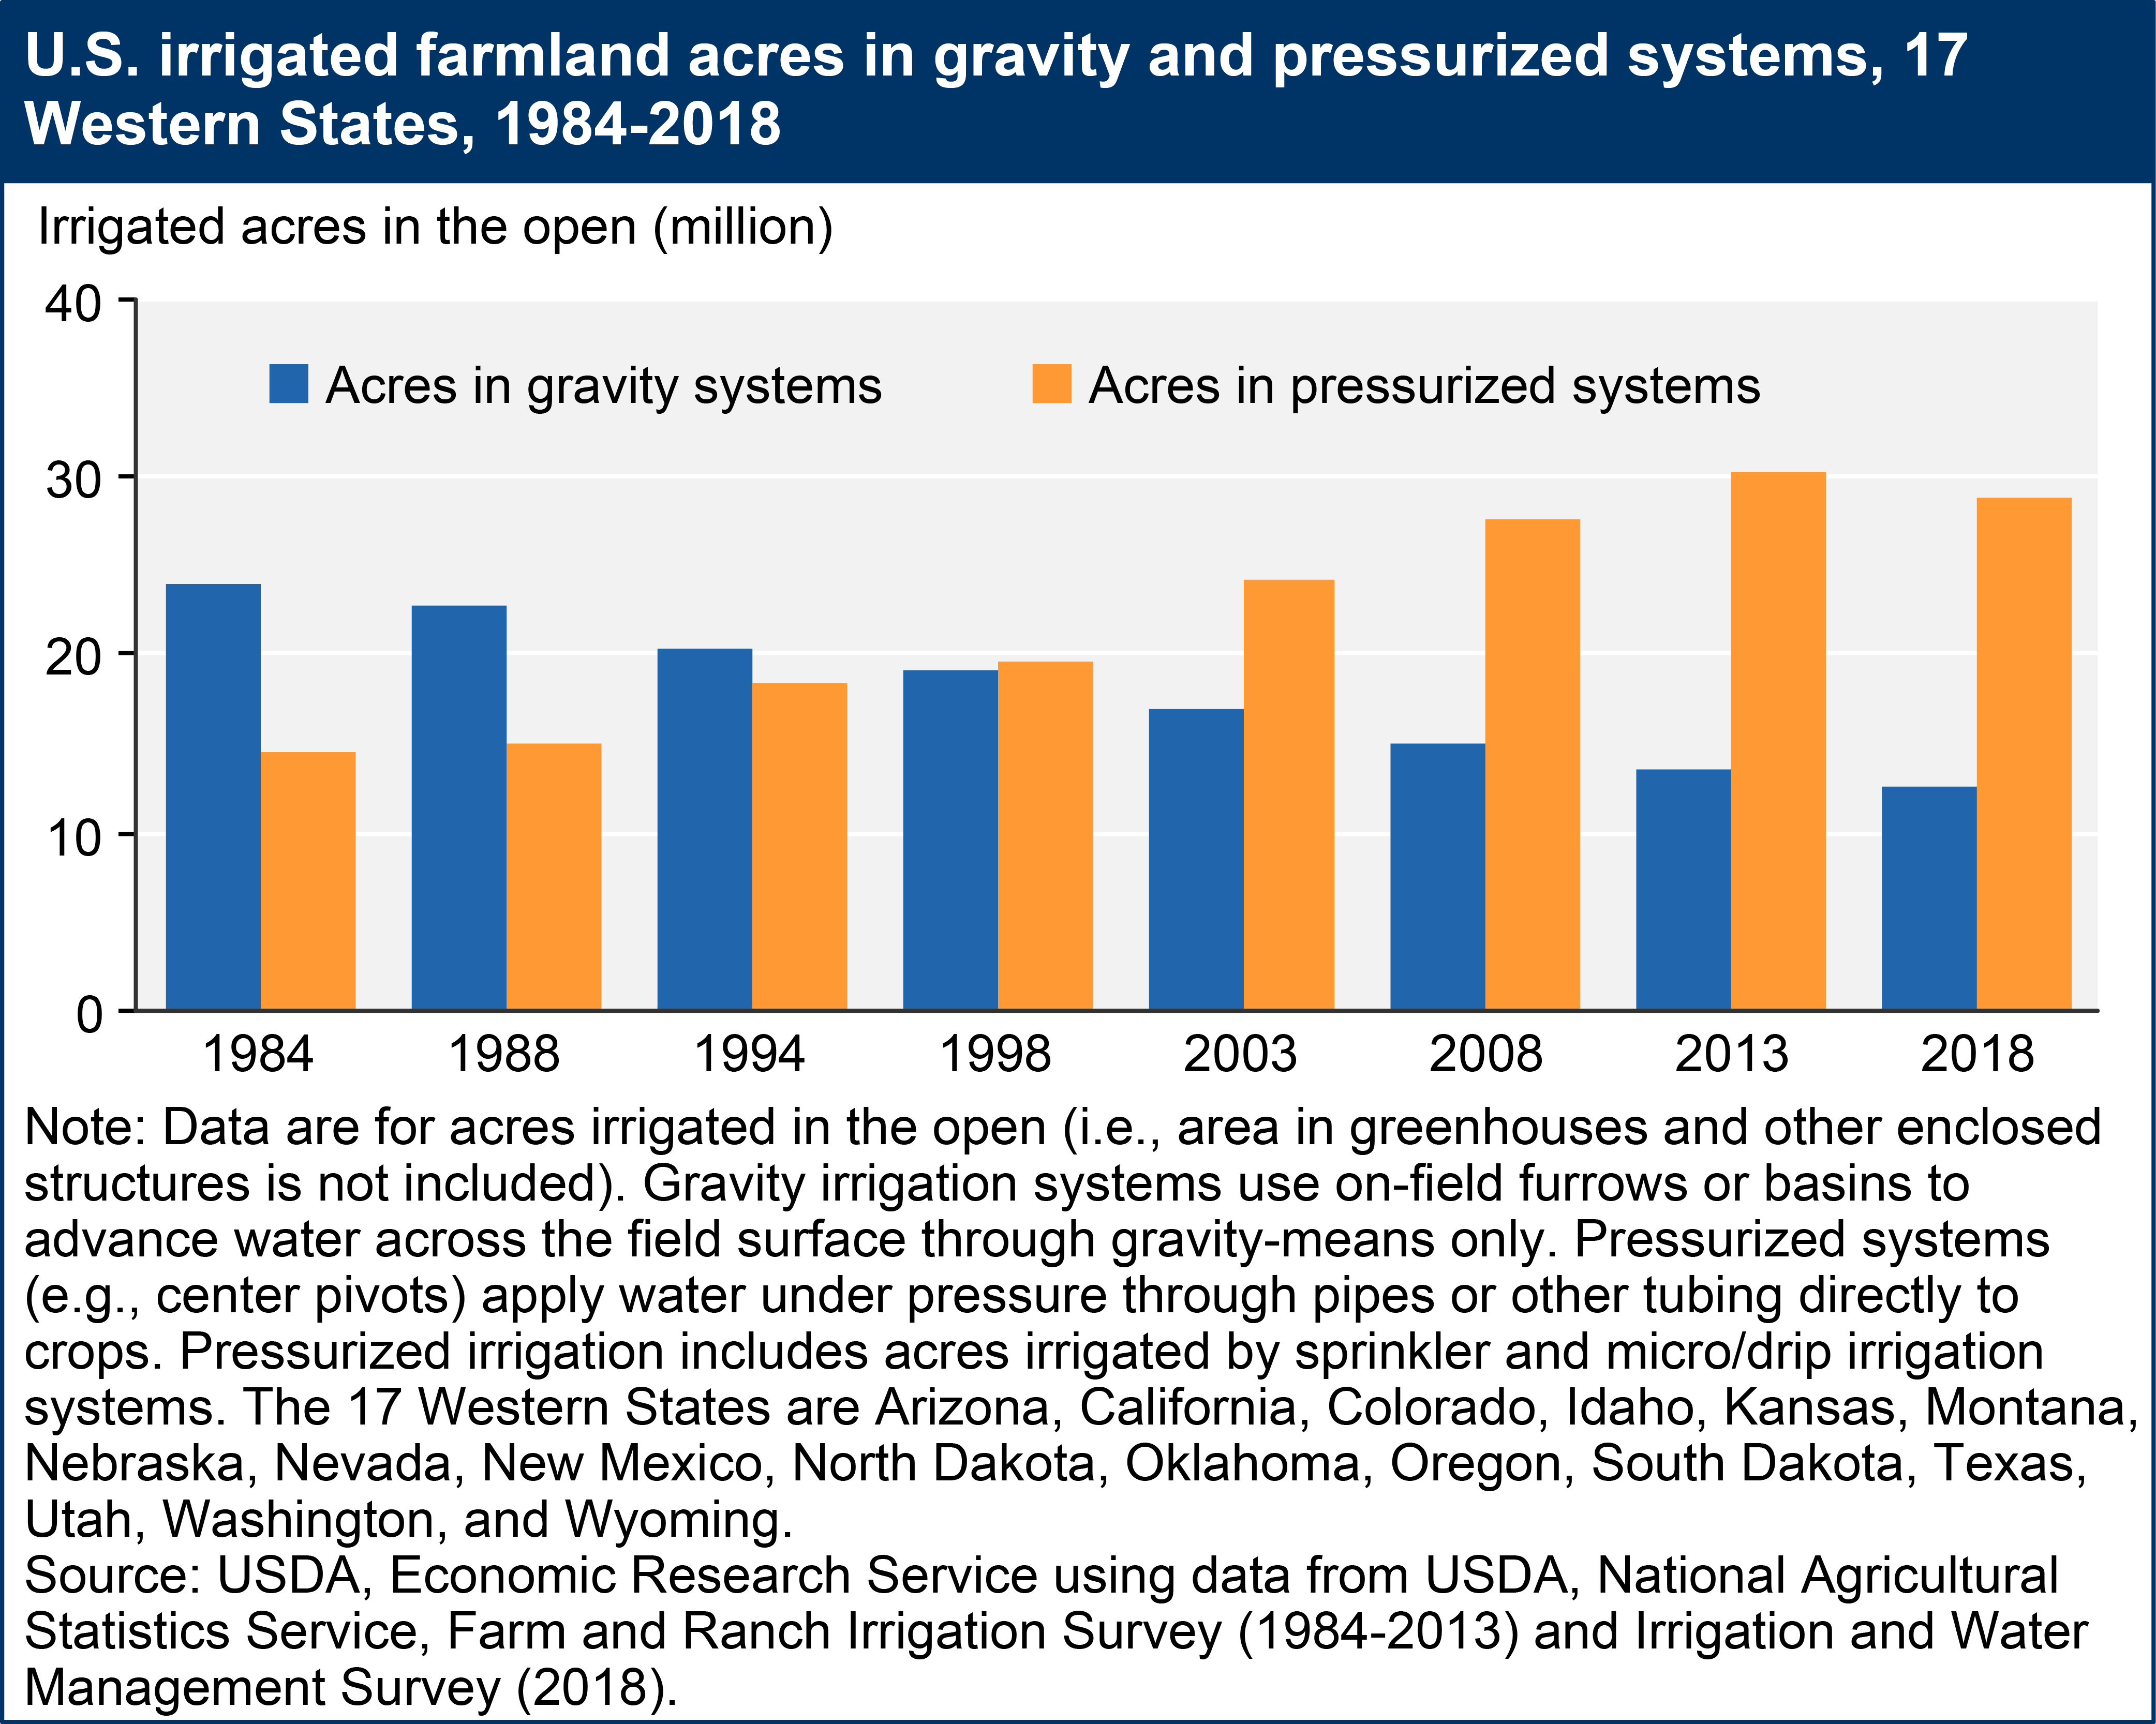
Various methods are used to apply irrigation water to crops, which can be broadly categorized as gravity or pressurized systems. Gravity irrigation systems use on-field furrows or basins to advance water across the field surface through gravity-means only. Pressurized systems apply water under pressure through pipes or other tubing directly to crops. Pressurized irrigation includes acres irrigated by sprinkler and micro/drip irrigation systems. Under many field conditions, pressurized irrigation systems are generally more water-use efficient than gravity systems as less water is lost to evaporation, deep percolation and field runoff. Over the last 30 years the conversion of gravity to pressurized irrigation systems has increased. In 1984, 37 percent of all irrigated cropland acres in the western U.S. used pressurized irrigation systems, as compared with 72 percent in 2018.
