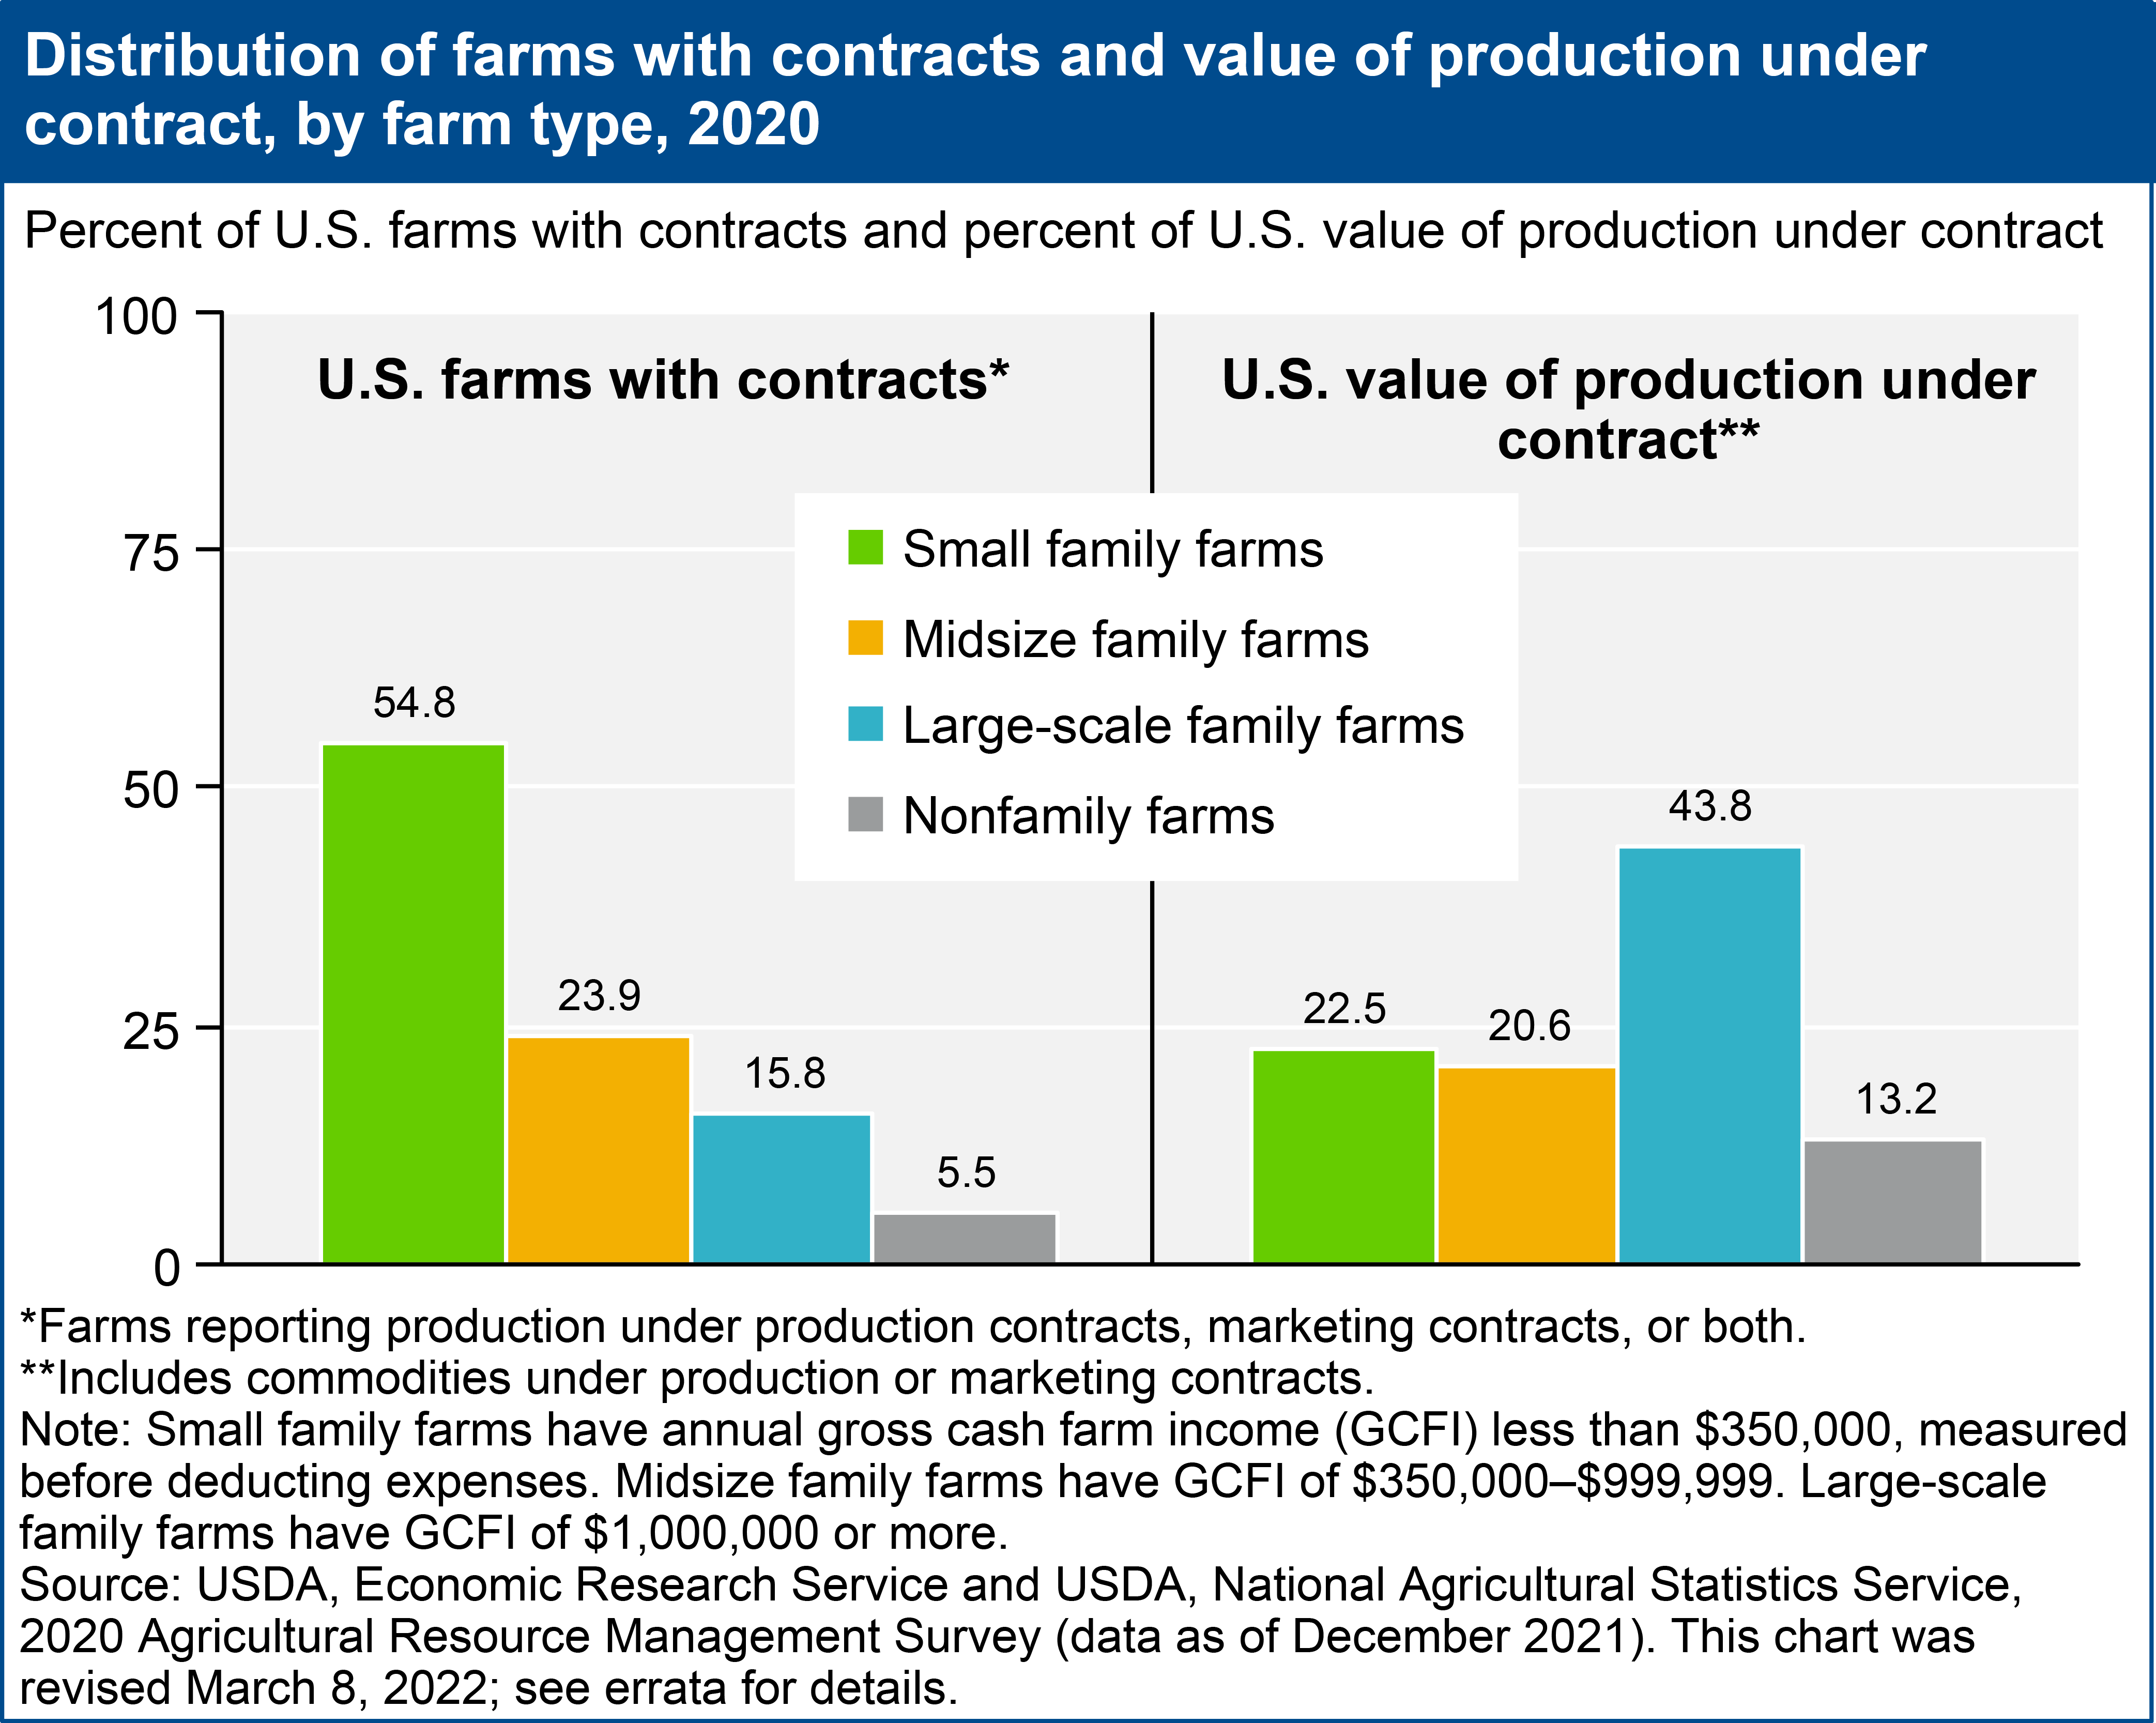
Errata: On March 8, 2022, a chart and text on the Farm Structure and Organization: Farm Structure and Contracting topic page was reposted to correct a programming error. The chart showing the share of farms with contracts and the value of production under contract and a paragraph discussing the chart were corrected. No other text or values on the topic page were affected.
Classifying Diverse Farms
Broad descriptions of farms based on U.S. averages can mask variation among different sizes and types of farms. A farm classification—or typology—developed by the Economic Research Service (ERS) categorizes farms into more homogeneous groupings for reporting and evaluation purposes. The classification is based largely on annual gross cash farm income of the farm business, the primary occupation of the operator, and ownership of the farm.
The ERS Farm Typology
Farm size is measured by annual gross cash farm income (GCFI)—a measure of the farm's revenue (before deducting expenses) that includes sales of crops and livestock, payments made under agricultural federal programs, and other farm-related cash income including fees from production contracts.
- Small family farms (GCFI less than $350,000)
- Retirement farms. Small farms whose principal operators report they are retired, although they continue to farm on a small scale.
- Off-farm occupation. Small farms whose principal operators report a primary occupation other than farming. The category also includes farms (about 18 percent of off-farm occupation farms) whose operators do not consider themselves to be in the labor force.
- Farming-occupation farms. Small farms whose principal operators report farming as their primary occupation.
- Low-sales farms. GCFI less than $150,000.
- Moderate-sales farms. GCFI between $150,000 and $349,999.
- Midsize family farms (GCFI between $350,000 and $999,999)
- Large-scale family farms (GCFI of $1,000,000 or more)
- Large farms. Farms with GCFI between $1,000,000 and $4,999,999.
- Very large farms. Farms with GCFI of $5,000,000 or more.
- Nonfamily farms. Farms where an operator and persons related to the operator do not own a majority of the business.
The farm typology focuses primarily on the "family farm," or any farm where the majority of the business is owned by an operator and individuals related to the operator, including relatives who do not live in the operator's household. USDA defines a farm as any place that produced and sold—or normally would have produced and sold—at least $1,000 of agricultural products during a given year. USDA uses acres of crops and head of livestock to determine if a place with sales less than $1,000 could normally produce and sell at least that amount. For more information, see the ERS report, Updating the ERS Farm Typology (EIB-110, April 2013).
Distribution of U.S. Farms, Value of Production, and Farm Assets
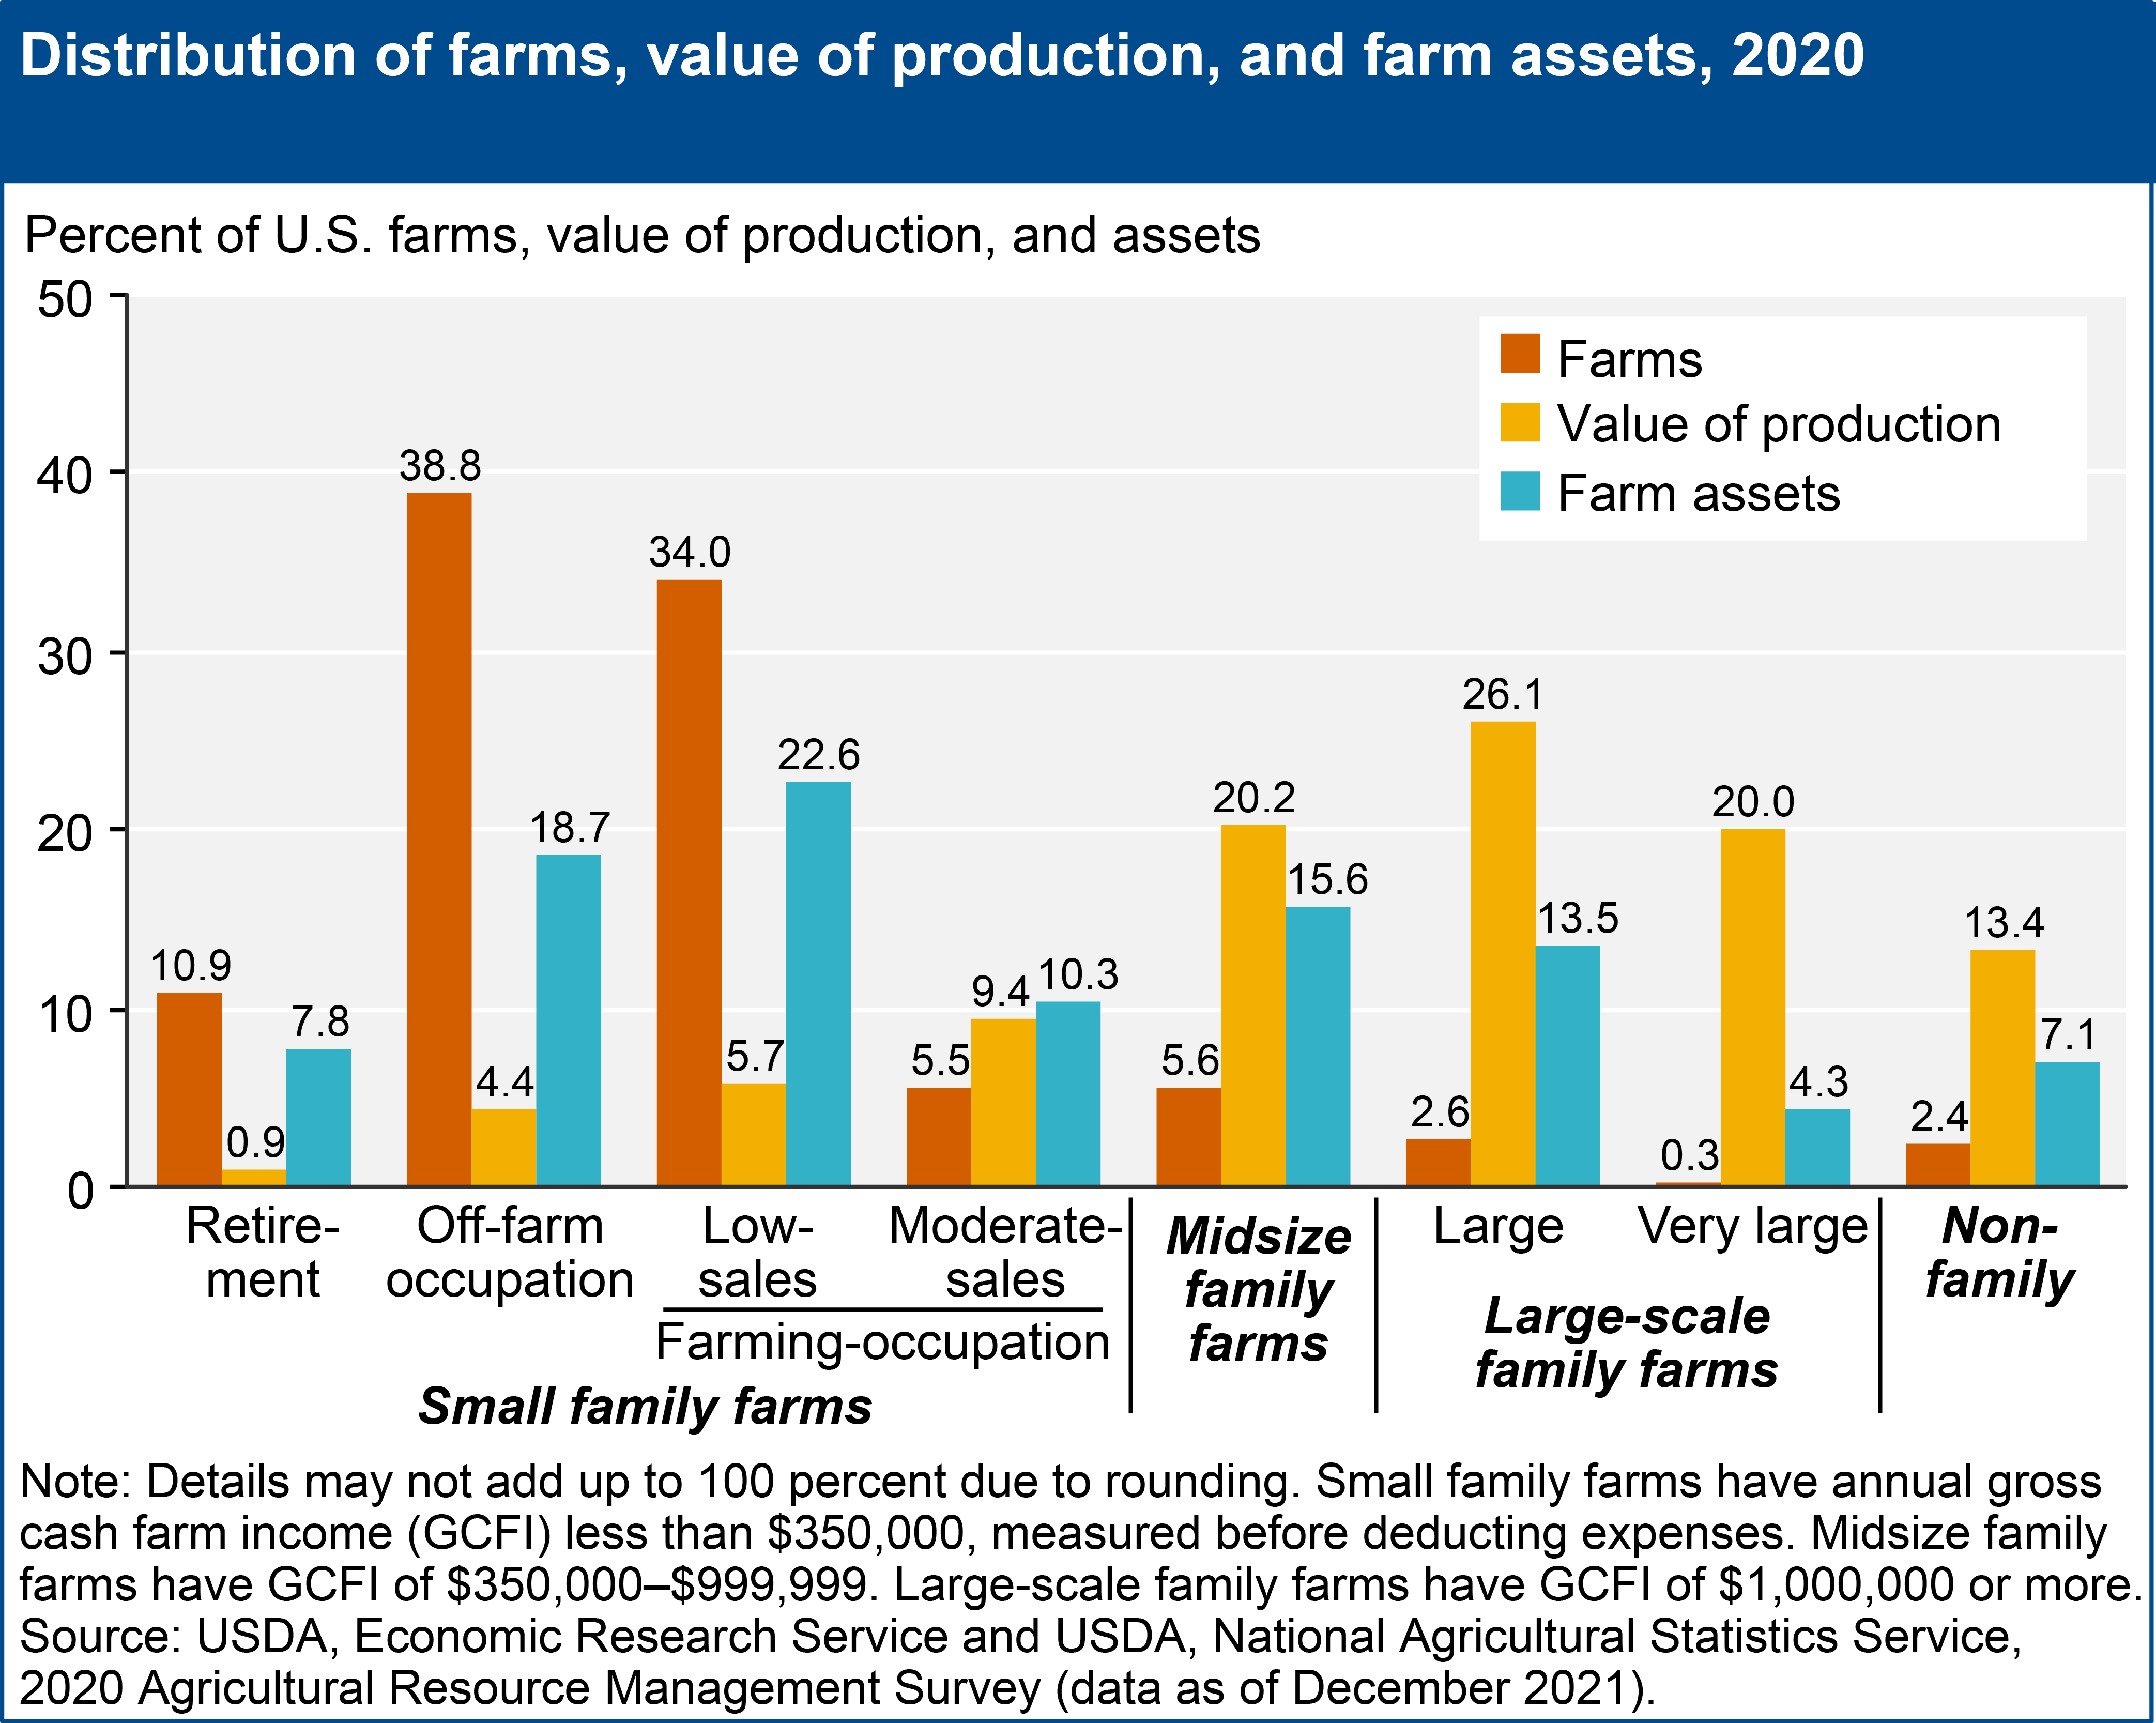
Based on the ERS farm typology and data from the 2020 Agricultural Resource Management Survey (ARMS), 98 percent of U.S. farms are family farms. The remaining 2 percent are nonfamily farms, which produce 13 percent of the value of agricultural output. Two features of family farms stand out. First, there are many small family farms—those with GCFI less than $350,000—making up 89 percent of all U.S. farms and holding 59 percent of farm assets. Second, most production—66 percent—occurs on the 8 percent of family farms classified as midsize or large-scale. Among small family farm types, moderate-sales farms (GCFI of $150,000 to $349,999) account for the highest share of total U.S. production, at 9 percent.
Download chart image | Chart data
Contracting
Contracts can potentially provide benefits to both producers and contractors. Farmers get a guaranteed outlet for their production with known compensation, while contractors get an assured supply of commodities with specified characteristics, delivered on time.
A contract is a legal agreement between a farm operator (contractee) and another person or firm (contractor) to produce a specific type, quantity, and quality of agricultural commodity. The Economic Research Service classifies contracts as either marketing or production.
Marketing contract. Ownership of the commodity remains with the farmer during production. The contract sets a price (or a pricing formula), product quantities and qualities, and a delivery schedule. Contractor involvement in production is minimal, and the farmer provides all the inputs. For crops, the contract is finalized before harvest. For livestock, the contract is finalized before the animals are ready to be marketed.
Production contract. The contractor usually owns the commodity during production, and the farmer is paid a fee for services rendered. The contract specifies farmer and contractor responsibilities for inputs and practices. The contractor often provides specific inputs and services, production guidelines, and technical advice. In livestock contracts, for example, contractors typically provide feed, veterinary services, transportation, and young animals. The contract is finalized before production of the commodity.
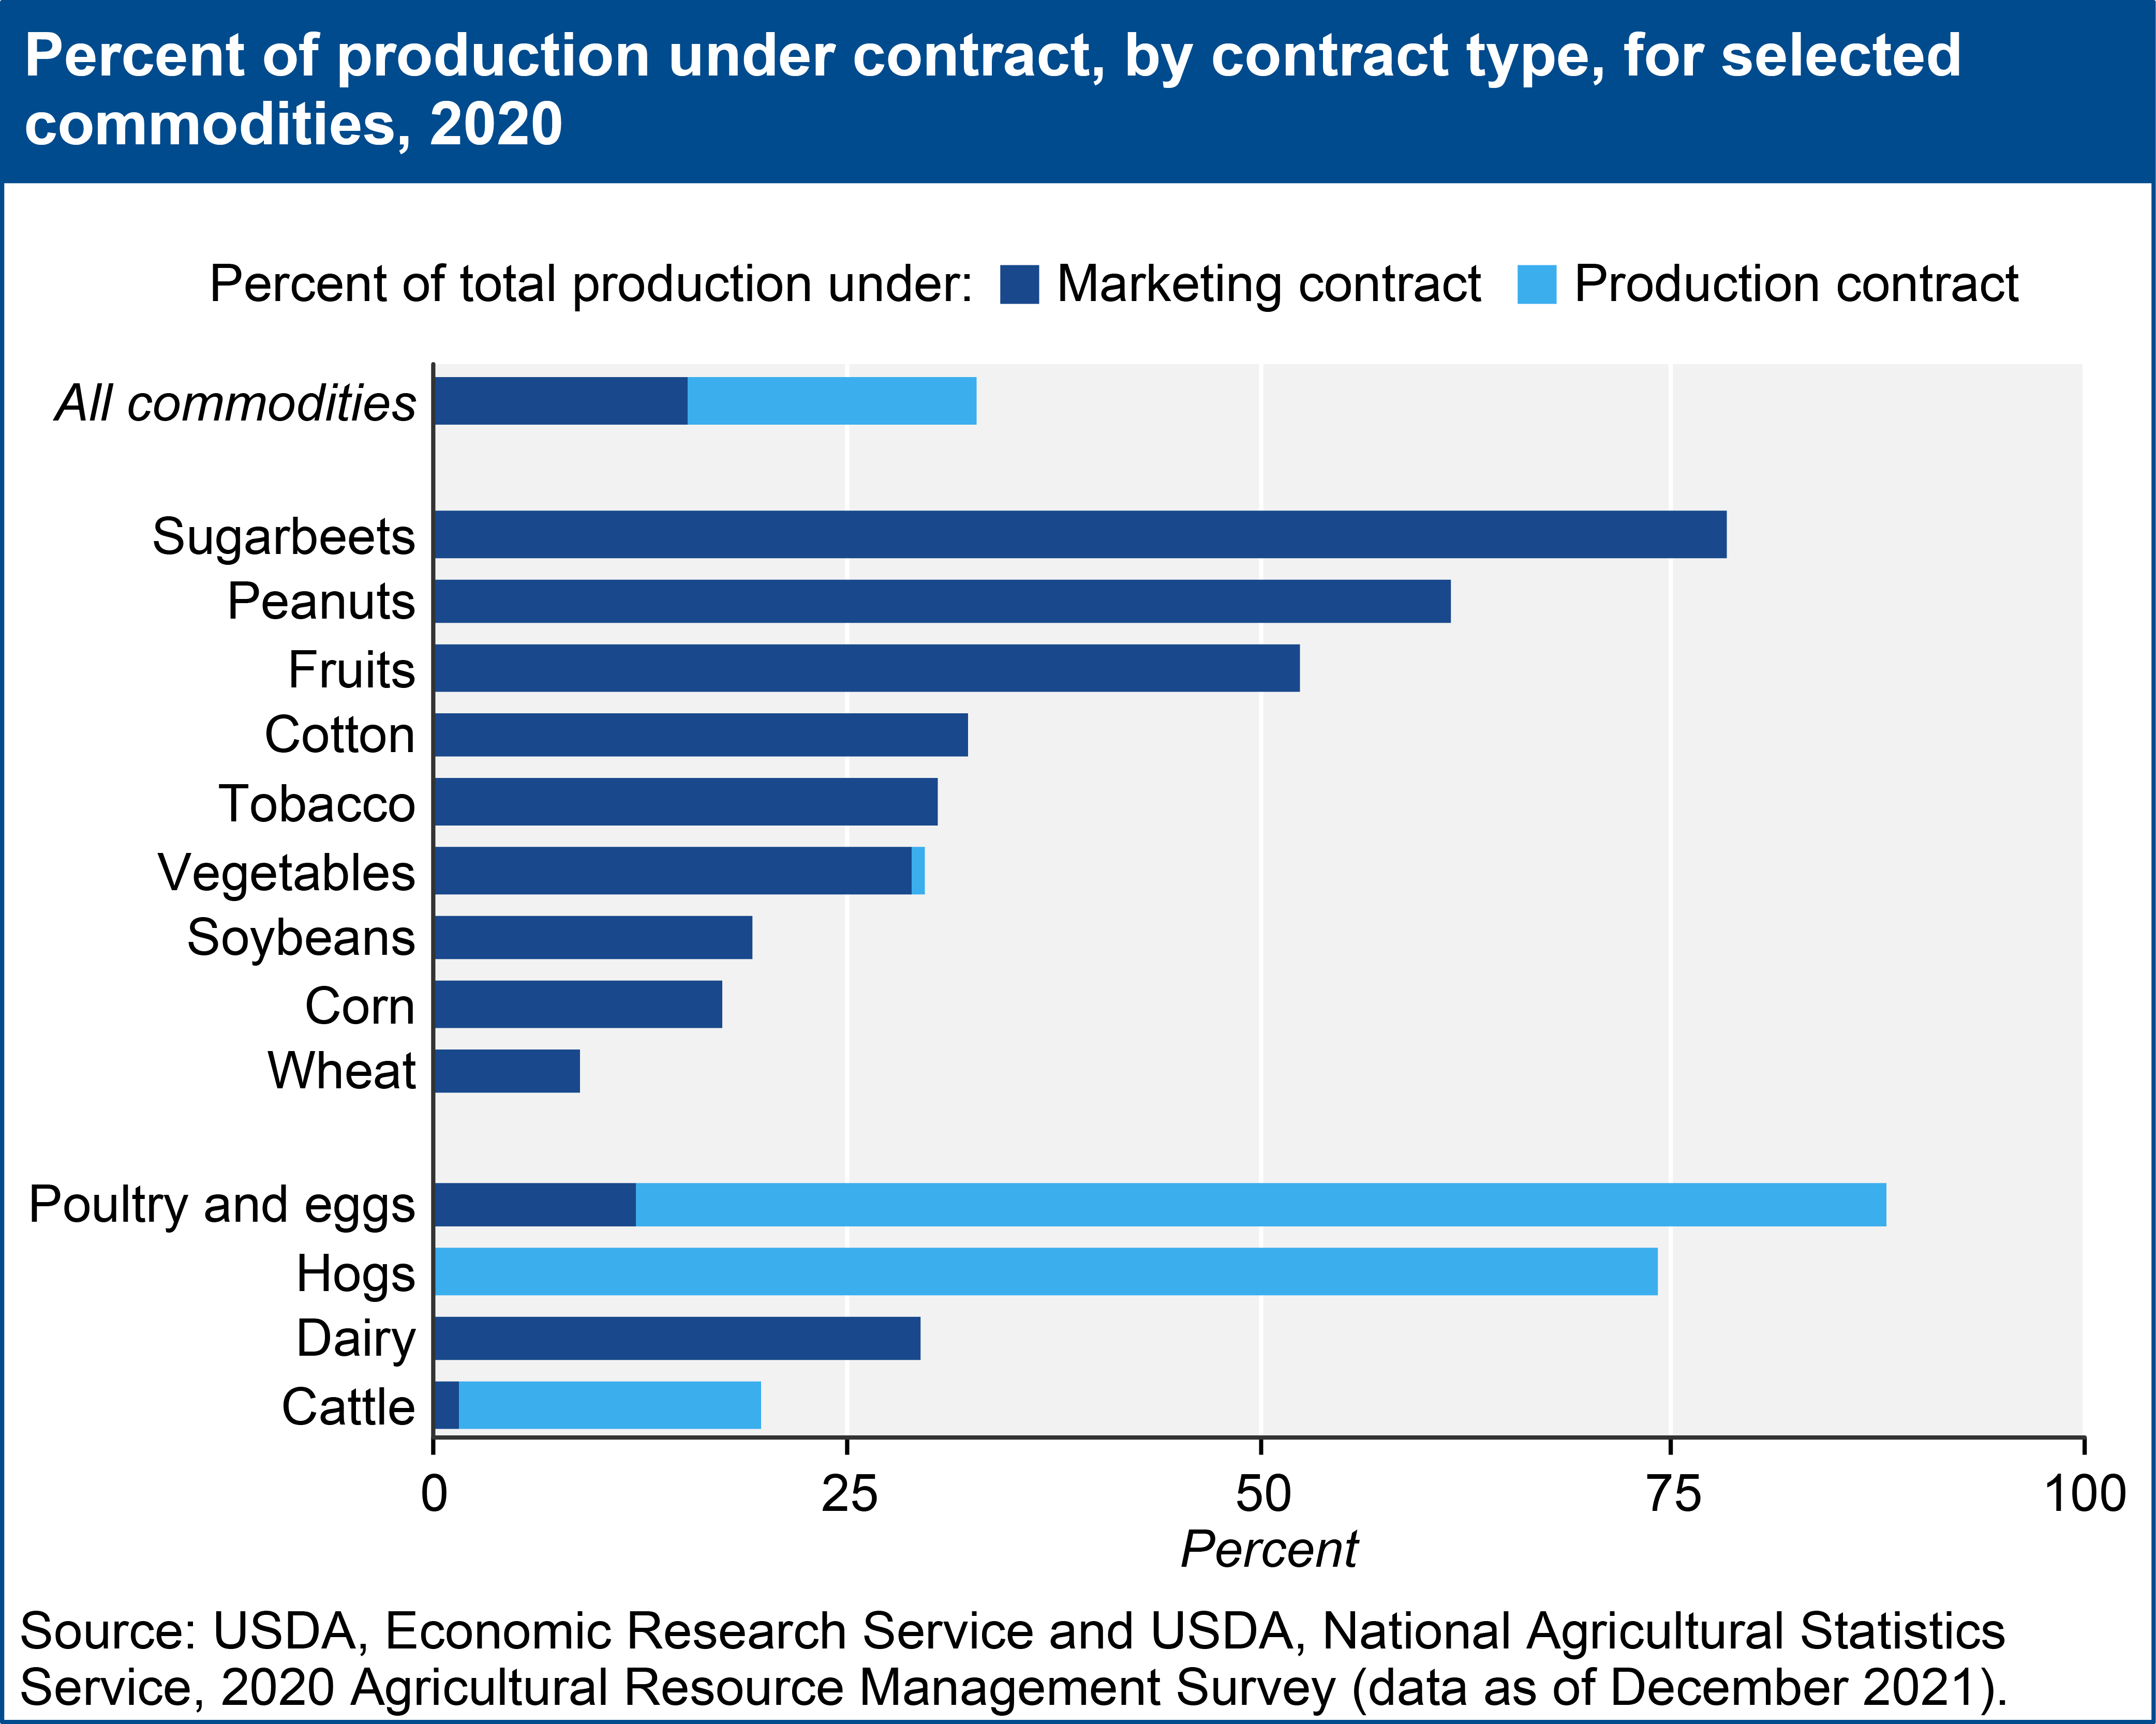
For commodities as a whole, marketing contracts and production contracts contributed about the same levels of value of production in 2020. Production contracts—more commonly used on livestock farms—represented the majority of production on poultry/egg and hog farms. In contrast, marketing contracts were more commonly used on crop farms. Over half of the value of production of sugarbeet, peanut, and fruits was under marketing contracts. In contrast, less than 20 percent of soybean, corn, and wheat production was produced under marketing contract in 2020.
Download chart image | Chart data
Use of contracts—of either type—varies by farm type. Overall, the share of U.S. farms using contracts is about 7 percent. In 2020, small farms made up about 55 percent of farms with contracts but accounted for 22 percent of the production under contract. Midsize farms account for 24 percent of farms with contracts and accounted for another 21 percent of production. In contrast, large-scale and nonfamily farms together accounted for 21 percent of farms with contracts and 57 percent of contract production.