
The USDA, Economic Research Service’s (ERS) Rural-Urban Commuting Area (RUCA) codes are a classification scheme allowing for flexible, sub-county delineation of rural and urban areas throughout the United States and its territories. The Rural-Urban Commuting Area (RUCA) codes consist of two levels: (1) primary codes are whole numbers that delineate metropolitan, micropolitan, small town, and rural cores and their commuting areas based on the share and destination of the largest commuting flows, while (2) secondary codes further subdivide the primary codes using the share and destination of the second-largest commuting flows.
This page provides basic definitions, as well as tables and maps that summarize the data. It focuses on the newest census tract version of the data, the 2020 RUCA codes. For more details on the background and creation of the RUCA codes, see the Documentation.
Primary RUCA codes
The 10 primary RUCA codes are created by combining the share and destination of a location’s primary, or largest, commuting flow. Commuting flows fall into one of three categories: within-commuting, high out-commuting, and low out-commuting. These commuting flows are either to a rural tract or one of three urban cores that are differentiated by size: metropolitan cores, micropolitan cores, and small town cores.
Each of the codes for the primary RUCA classification combines these two aspects. For example, a census tract that is part of a micropolitan core where the strongest commuting flow is within the core would be classified as a 4 (micropolitan core). Whereas a census tract whose strongest commuting flow is to a rural tract would be classified as a 10 (rural). Finally, a census tract whose strongest commuting flow is to a metropolitan core but has a low level of commuting is classified as a 3 (metropolitan low commuting).
The RUCA codes were designed to delineate the boundaries between rural and urban areas at a sub-county level because counties, as the building blocks of the U.S Office of Management and Budget’s (OMB) Core-Based Statistical Areas, are often too large to do this. In addition to containing a mix of rural and urban land, metropolitan and micropolitan statistical areas often contain multiple urban cores. The maps in the figure below compare the extent of metropolitan statistical areas with the RUCA codes of the census tracts within them. Tracts related to metropolitan cores are represented by shades of black, tracts related to micropolitan cores are represented by shades of purple, tracts related to small town cores are represented by shades of green, and rural tracts are represented by light yellow. Boundaries of the metropolitan statistical areas (MSAs) are represented by thick white lines.

The map on the right shows the 15-county Minneapolis–St. Paul–Bloomington, Minnesota MSA. The dense metropolitan core (code 1, black) is surrounded by a large band of metropolitan high commuting locations (code 2, dark grey), with metropolitan low commuting locations (code 3, light grey) further from the urban core. Some of these economically connected census tracts are outside of the MSA boundary, particularly in the north and southwest. Conversely, there are also rural (code 10, light yellow) census tracts located inside the MSA boundary that are not economically connected to the urban core. Additionally, some of the metropolitan high commuting tracts whose destination is the Mankato, Minnesota urban area are included within the MSA boundary. This illustrates that the actual influence of the Minneapolis-St. Paul urban area is not strictly coextensive with the counties used to create its MSA.
There are also several micropolitan area and small town cores (codes 4 and 7, respectively) nestled within the Minneapolis–St. Paul urban area’s commute shed. These urban cores stand out as dark green (e.g., Princeton, Minnesota) or dark purple (e.g., River Falls, Wisconsin) locations surrounded by grey. In these locations, most residents live and work within the urban core, while most commuters in surrounding tracts travel to the larger urban area for work. However, some urban areas (e.g., Hudson, Wisconsin and Stillwater, Minnesota) are not classified as urban cores because most commuters in those locations travel to work in the Minneapolis–St. Paul urban area, making them bedroom communities for the larger urban area, rather than an economically distinct community.
The 10-county Columbus, Ohio MSA, shown in the map on the left of the figure above, has a few similar economically distinct communities (e.g., Marysville) and economically integrated bedroom communities (e.g., Sunbury). However, the Columbus MSA also has a second economically distinct metropolitan core, Newark, included within the MSA boundary. The micropolitan and small town cores of Lancaster, Logan, and Circleville even have their own distinct commute sheds (indicated by the lighter purple and green census tracts) within the boundary of the MSA. While the counties these urban cores are located in have a strong enough economic tie to be included in the MSA, the local dynamics of the rural-urban hierarchy are masked at the county level.
Additionally, not all census tracts are economically integrated within the commute shed. Just north of the urban core, there is a rural census tract. This tract is not part of the metropolitan core but most of its commuting residents also work within the tract. Situations like this can also occur when large groups of commuters within a tract travel to two different work destinations.
The distribution of census tracts and population across primary RUCA codes is available in the table below. Nearly 70 percent of census tracts are classified as metropolitan core (code 1). This makes sense, as census tracts are defined using an optimal population size, resulting in a higher number in urban locations. Conversely, metropolitan core tracts comprise less than 5 percent of land area. The second largest RUCA category is metropolitan high commuting tracts, which comprise 10 percent of census tracts. However, this is only about a fifth of all metropolitan tracts (codes 1–3).
| Census tracts | Population | Land area | ||||
| Primary RUCA code | Units | Percent | People | Percent | Square miles | Percent |
| 1–Metropolitan core | 58,777 | 68.7 | 241,049,747 | 71.9 | 153,619 | 4.3 |
| 2–Metropolitan high commuting | 8,550 | 10.0 | 34,350,428 | 10.3 | 513,845 | 14.5 |
| 3–Metropolitan low commuting | 1,151 | 1.3 | 4,142,024 | 1.2 | 84,447 | 2.4 |
| 4–Micropolitan core | 4,780 | 5.6 | 18,058,952 | 5.4 | 68,206 | 1.9 |
| 5–Micropolitan high commuting | 2,244 | 2.6 | 7,771,848 | 2.3 | 293,918 | 8.3 |
| 6–Micropolitan low commuting | 693 | 0.8 | 2,320,824 | 0.7 | 57,113 | 1.6 |
| 7–Small town core | 1,508 | 1.8 | 5,307,246 | 1.6 | 61,266 | 1.7 |
| 8–Small town high commuting | 612 | 0.7 | 1,862,961 | 0.6 | 137,709 | 3.9 |
| 9–Small town low commuting | 337 | 0.4 | 1,054,981 | 0.3 | 35,334 | 1.0 |
| 10–Rural | 6,508 | 7.6 | 19,154,165 | 5.7 | 2,131,635 | 60.3 |
| 99–Not coded (water only) | 368 | 0.4 | 0 | 0.0 | 0 | 0.0 |
| Total | 85,528 | 100.0 | 335,073,176 | 100.0 | 3,537,092 | 100.0 |
|
RUCA = Rural-Urban Commuting Area. Note: This table includes information for the United States and its territories. Source: USDA, Economic Research Service the 2020 Rural-Urban Commuting Area Codes data product. |
||||||
This pattern is consistent across the different urban cores and the census tracts tied to them through commuting. The largest share of tracts (and, subsequently, population) is located within the urban cores, with much fewer census tracts commuting into those cores, either at a high or low level. And the number of tracts within those urban cores decreases as the size of the urban core decreases. Rural tracts comprise the third-largest RUCA category, with about 7.5 percent of census tracts and 6 percent of the population, but they represent more than 60 percent of the nation’s land area.
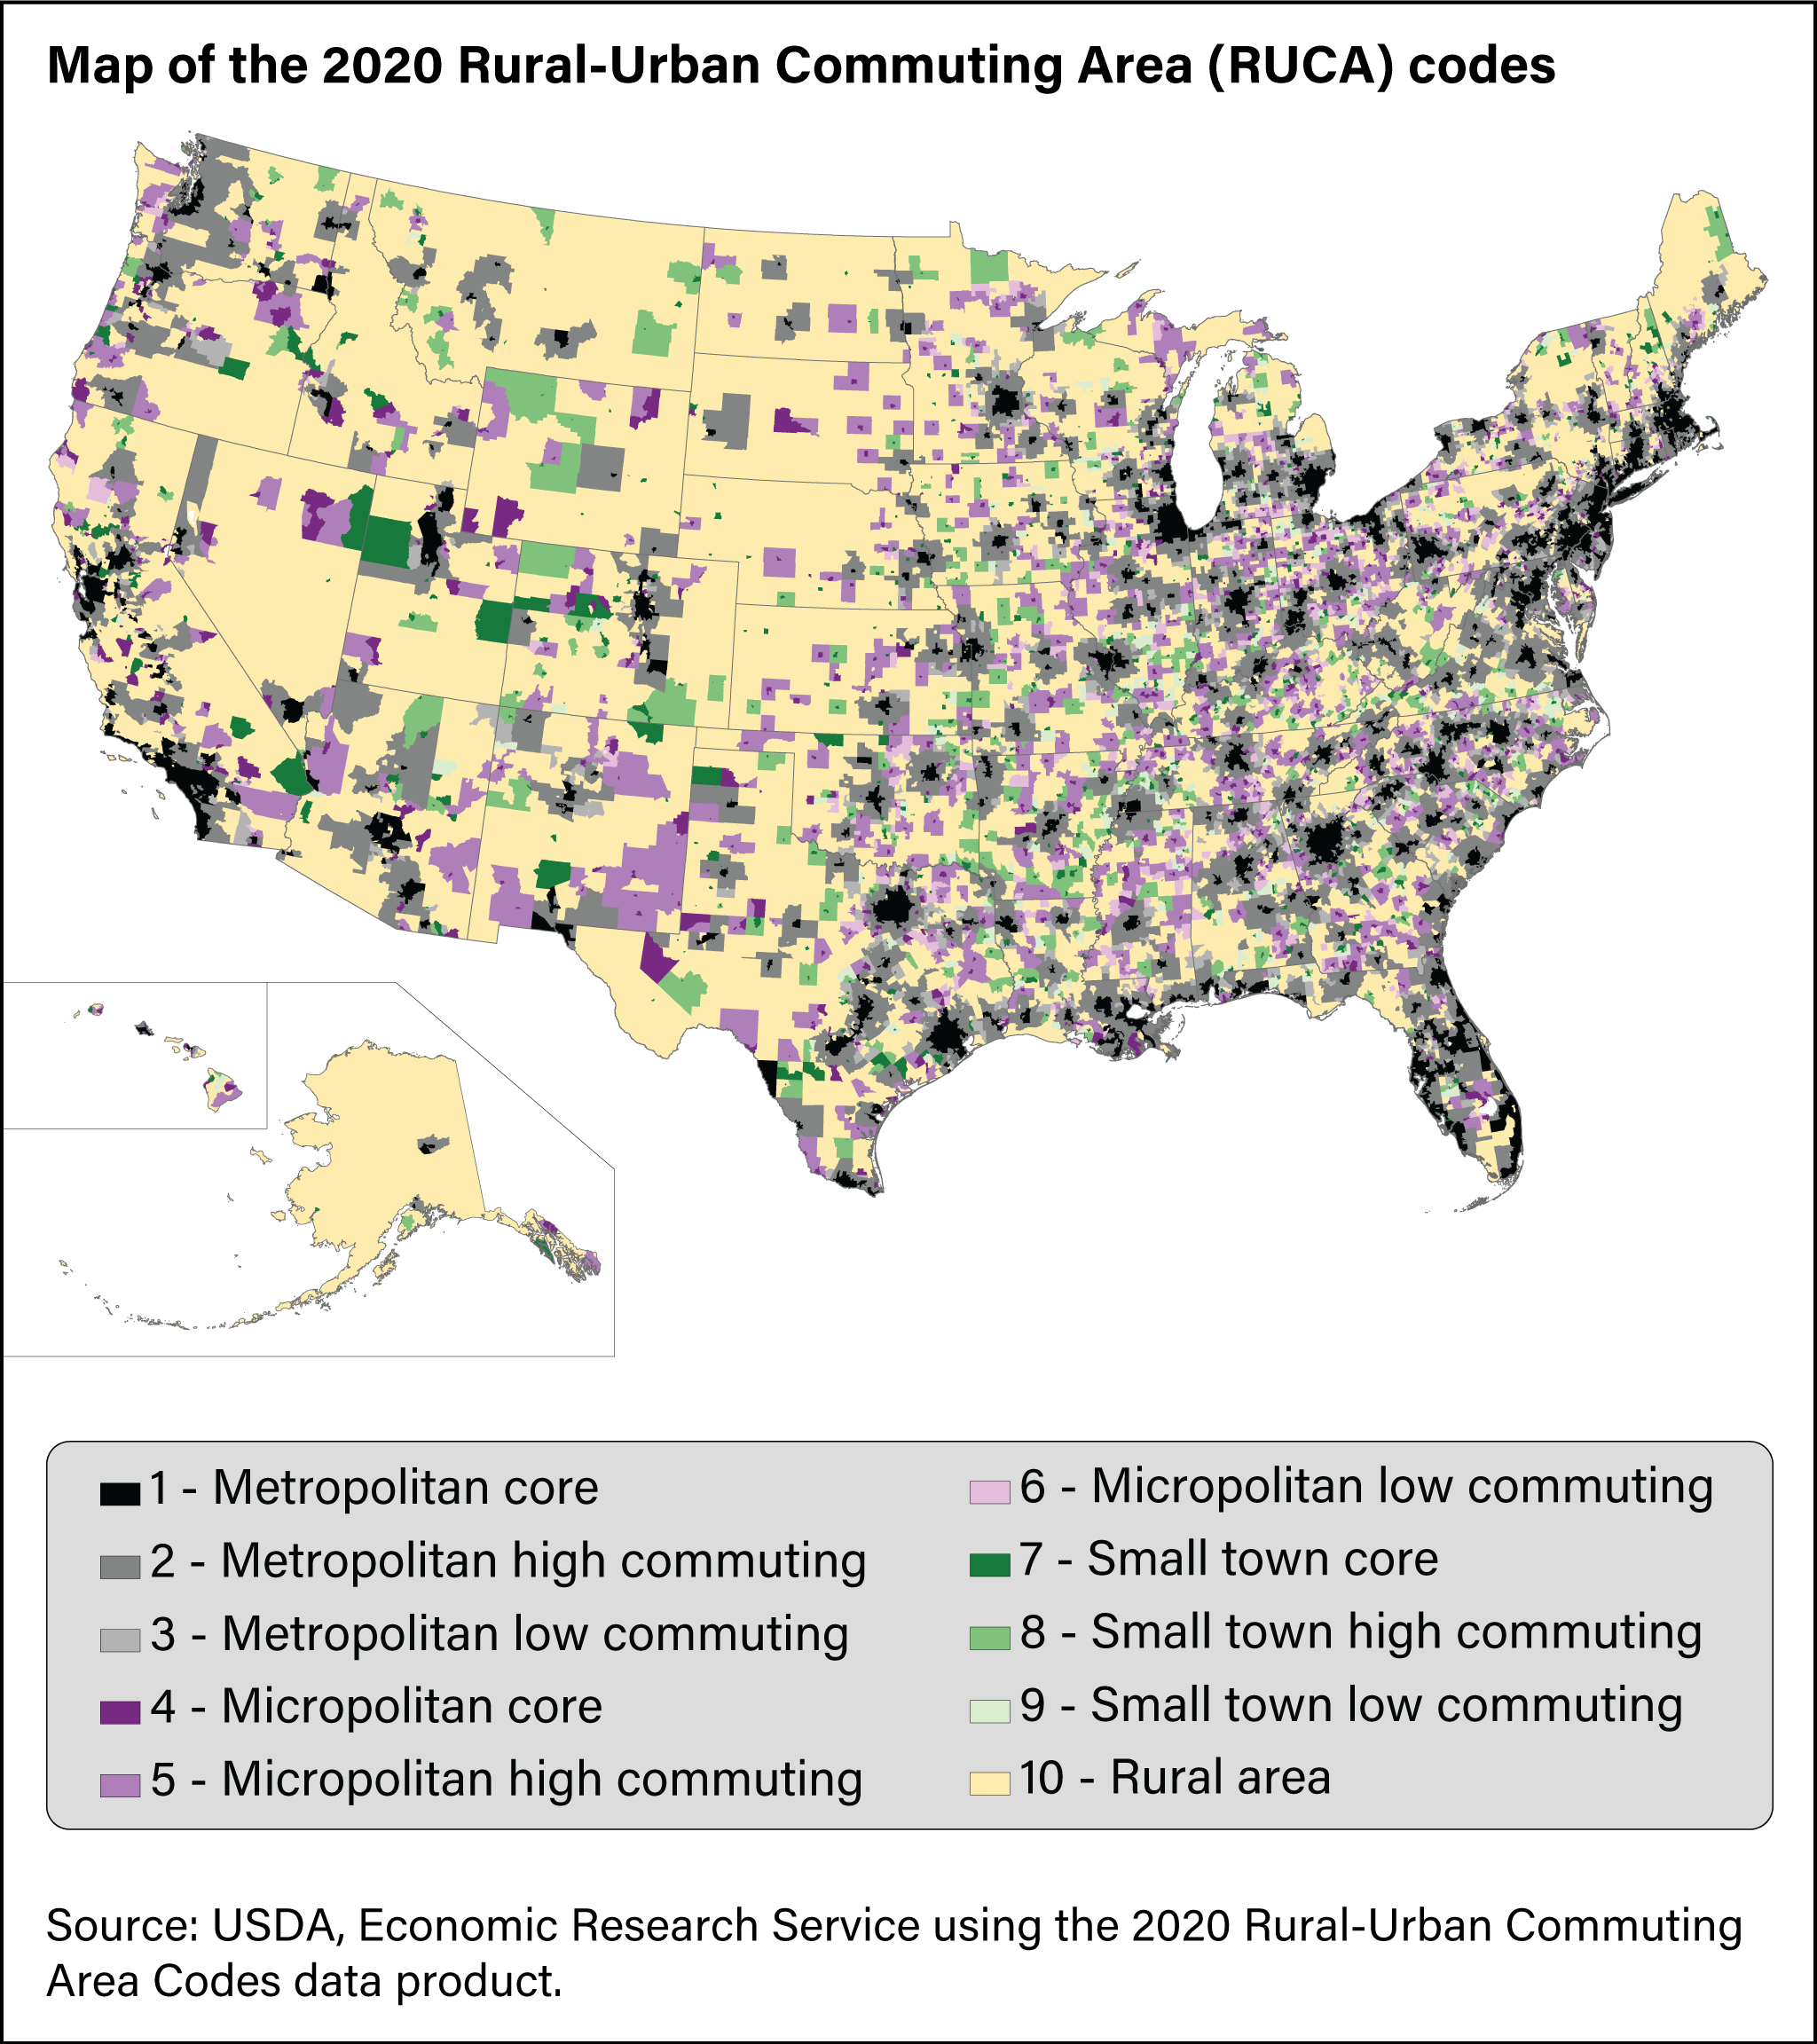
The map below uses primary RUCA codes to illustrate the distribution of urban areas across the United States. Population is distributed more evenly across space in the eastern part of the Nation, while in the western part of the Nation, there is much more space between urban areas. The larger census tract sizes in these areas are also much more apparent through large blocks of color, representing commute sheds (high and low commuting tracts) to the urban cores.
Secondary RUCA codes
About 2.5 percent of census tracts in the United States have a secondary RUCA code linking them to an urban core further up the rural-urban hierarchy. More than half of these census tracts are metropolitan core (code 1). The rest of the census tracts are mainly rural (code 10), which comprise about 20 percent of U.S. census tracts with a secondary RUCA code linking them to a larger urban core, and micropolitan core (code 4), which comprise about 15 percent. The table below shows the distribution of census tracts and population across secondary RUCA codes. Nearly all (88 percent) of the secondary RUCA codes indicate a connection to a (larger) metropolitan core through the census tract’s secondary commuting flow. Only 8 percent of the secondary RUCA codes indicate a connection to a micropolitan core, with the remaining 4 percent indicating a connection to a small town core.
| Census tracts | Population | |||
| Secondary RUCA code | Units | Percent | People | Percent |
| 1.0 – Metropolitan core, no additional code | 56,756 | 67.2 | 232,719,700 | 70.2 |
| 1.1 – Metropolitan core, secondary flow to larger UA | 1,159 | 1.4 | 5,306,356 | 1.6 |
| 2.0 – Metropolitan high commuting, no additional code | 8,488 | 10.1 | 34,109,617 | 10.3 |
| 2.1 – Metropolitan high commuting, secondary flow to larger UA | 62 | 0.1 | 240,811 | 0.1 |
| 3.0 – Metropolitan low commuting, no additional code | 1,151 | 1.4 | 4,142,024 | 1.2 |
| 4.0 – Micropolitan core, no additional code | 4,361 | 5.2 | 16,397,584 | 4.9 |
| 4.1 – Micropolitan core, secondary flow to metro UA | 324 | 0.4 | 1,352,285 | 0.4 |
| 5.0 – Micropolitan high commuting, no additional code | 2,219 | 2.6 | 7,674,838 | 2.3 |
| 5.1 – Micropolitan high commuting, secondary flow to metro UA | 25 | 0.0 | 97,010 | 0.0 |
| 6.0 – Micropolitan low commuting, no additional code | 693 | 0.8 | 2,320,824 | 0.7 |
| 7.0 – Small town core, no additional code | 1,403 | 1.7 | 4,911,271 | 1.5 |
| 7.1 – Small town core, secondary flow to metro UA | 64 | 0.1 | 261,708 | 0.1 |
| 7.2 – Small town core, secondary flow to micro UA | 20 | 0.0 | 75,691 | 0.0 |
| 8.0 – Small town high commuting, no additional code | 606 | 0.7 | 1,845,481 | 0.6 |
| 8.1 – Small town high commuting, secondary flow to metro UA | 4 | 0.0 | 12,075 | 0.0 |
| 8.2 – Small town high commuting, secondary flow to micro UA | 2 | 0.0 | 5,405 | 0.0 |
| 9.0 – Small town low commuting, no additional code | 337 | 0.4 | 1,054,981 | 0.3 |
| 10.0 – Rural area, no additional code | 5,984 | 7.1 | 17,570,784 | 5.3 |
| 10.1 – Rural area, secondary flow to metro UA | 216 | 0.3 | 692,717 | 0.2 |
| 10.2 – Rural area, secondary flow to micro UA | 147 | 0.2 | 441,846 | 0.1 |
| 10.3 – Rural area, secondary flow to small town UA | 74 | 0.1 | 216,273 | 0.1 |
| 99 – Not coded | 319 | 0.4 | 0 | 0.0 |
| Total | 84,414 | 100 | 331,449,281 | 100 |
|
RUCA = Rural-Urban Commuting Area; UA = urban area. Note: This table only includes information for the 50 U.S. States and Washington, DC. The territories do not have commuting data, so they do not have an additional secondary code. Source: USDA, Economic Research Service using the 2020 Rural-Urban Commuting Area Codes data product. |
||||
The maps in the figure below illustrate the additional information the secondary RUCA codes provide about the relationship among parts of the rural-urban hierarchy. The colors represent the primary RUCA codes, as discussed earlier. The patterns indicate the secondary RUCA codes. Diagonal stripes indicate that the second largest commuting flow is to a (larger) metropolitan core. Crosshatching indicates that the second largest commuting flow is to a micropolitan core. Dots indicate that the second-largest commuting flow is to a small town core.
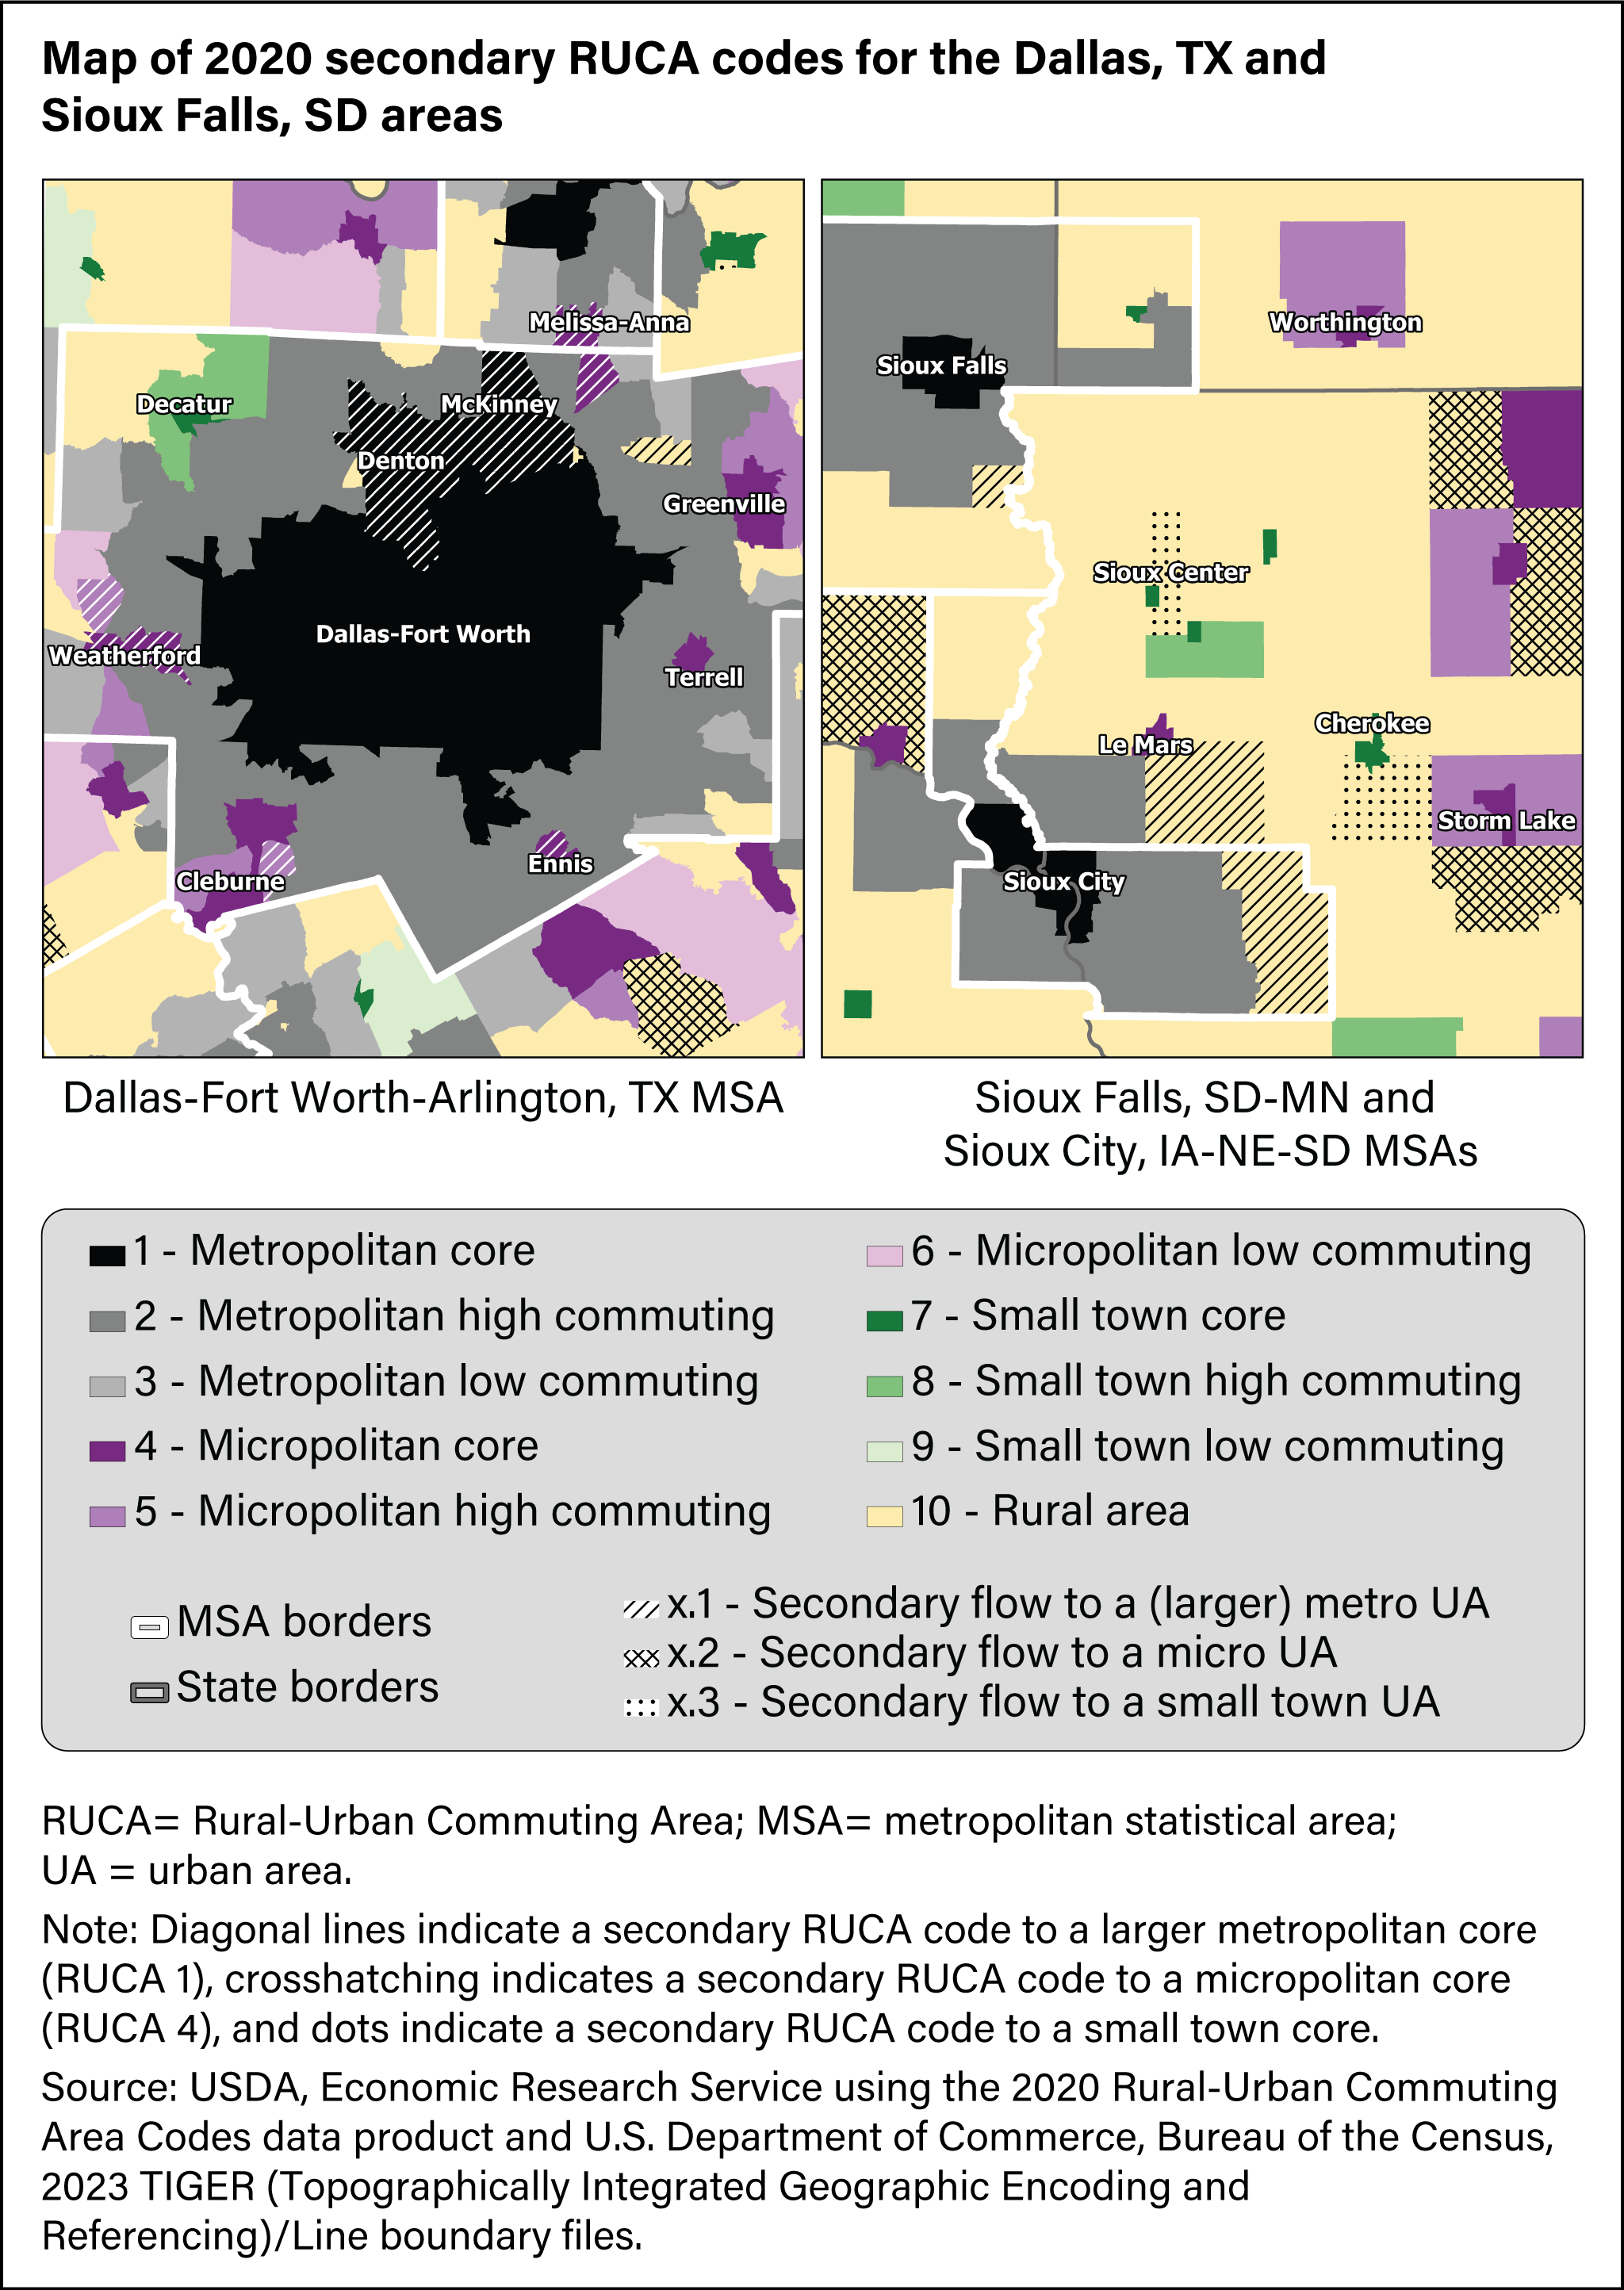
The map on the left side of the figure shows the Dallas-Fort Worth-Arlington, Texas MSA. Within the boundaries of the MSA, the tracts with secondary RUCA codes are tied to a larger metropolitan core. The secondary RUCA codes indicate that, while the micropolitan cores of Ennis, Melissa-Anna, and Weatherford operate primarily as local job centers, they are also economically connected to the Dallas-Fort Worth-Arlington metropolitan core. However, this strong secondary connection is not true for all local job centers within the MSA. The micropolitan cores of Cleburne, Greenville, and Terrell (as well as the small town core of Decatur) do not have a strong secondary economic connection to the Dallas-Fort Worth-Arlington metropolitan core. These strong secondary economic ties are not exclusive to smaller urban cores. The metropolitan cores of Denton-Lewisville and McKinney-Frisco are directly adjacent to the Dallas-Forth Worth-Arlington core, making them visually indistinguishable when looking solely at the primary RUCA codes. However, the secondary RUCA codes indicate that there is a strong economic tie between these two metropolitan cores and the larger Dallas-Fort Worth-Arlington core.
The areas surrounding the Sioux Falls, South Dakota and Sioux City, Iowa MSAs (shown in the map on the right side of the figure above) illustrate the importance of secondary RUCA codes in a more rural context. The economic connections may be obvious in some locations, such as for Sioux Center, Iowa and Worthington, Minnesota, where the rural census tracts are directly adjacent or encompass the urban center. However, in situations where rural tracts are adjacent to multiple urban cores, the connections are more ambiguous. For example, the secondary RUCA code of the rural tract south of Le Mars, Iowa indicates a strong economic connection to the Sioux City urban core, rather than the Le Mars urban core. And the rural tract south of Cherokee, Iowa is more economically connected to Cherokee than the larger Storm Lake, Iowa micropolitan core to the east. Additionally, the tracts in this area illustrate the difference in census tract sizes in more urban locations, compared to rural locations. Each of the patterned census tracts in the map is one census tract, and their area is frequently several times the size of the multiple tracts making up the urban cores.
These examples illustrate the value of the secondary RUCA codes in understanding the overall structure and dynamics within the rural-urban hierarchy of the United States. For suggestions on how to utilize the secondary RUCA codes, see the Users' Guide and the “Rural-Urban Classification Examples” document on the Overview page.