
USDA, Economic Research Service (ERS) researchers examined differences in diet quality by food source and demographics from 1977–2018. Diet quality is measured by employing the nutrient and food-group density measure—the amount of nutrient or food equivalent from foods that contain 1,000 calories. Food sources are categorized into two broad categories—food at home (FAH) and food away from home (FAFH). FAFH is further disaggregated into four sources—restaurant with waiter service (restaurant), fast food establishment (fast food), school cafeteria and day care center (school), and other FAFH places (other FAFH). USDA, ERS researchers report mean intakes, distribution percentages (shares), and density of nutrients and food groups by food source for individuals aged 2 and older, as well as by selected demographic characteristics (age, sex, race and ethnicity, household income, and adult education attainment). Selected major findings for U.S consumers aged 2 and older as well as certain demographics are summarized below. Additional findings and an in-depth discussion of the data are available in the Economic Information Bulletin report:
Dietary Quality by Food Source and Demographics in the United States, 1977–2018
During the 1977–2018 period, U.S. consumers’ reported calorie intake increased by 15 percent from 1,807 calories per person per day in 1977–1978 to 2,093 calories in 2017–2018 (table 2). The trend in calorie intake is consistent with the rising obesity rate in the United States, but the rise in obesity rate outpaced the increase in calorie intake. Weight gain is associated with an imbalance between energy intake and expenditure, the latter of which is affected by an array of lifestyle and environmental factors such as physical activity level, sleep, healthfulness of diet, food environment, advances in modern technology, etc.
Figure 1

Download chart data in Excel format.
- Over time, full-service and fast-food restaurants have become increasingly important to U.S. consumers’ diets. Between 1977 and 2018, the share of food energy coming from fast food rose from 5.9 to 16.3 percent and the restaurant share more than doubled from 3.3 to 7.8 percent (figure 1 and table 4).
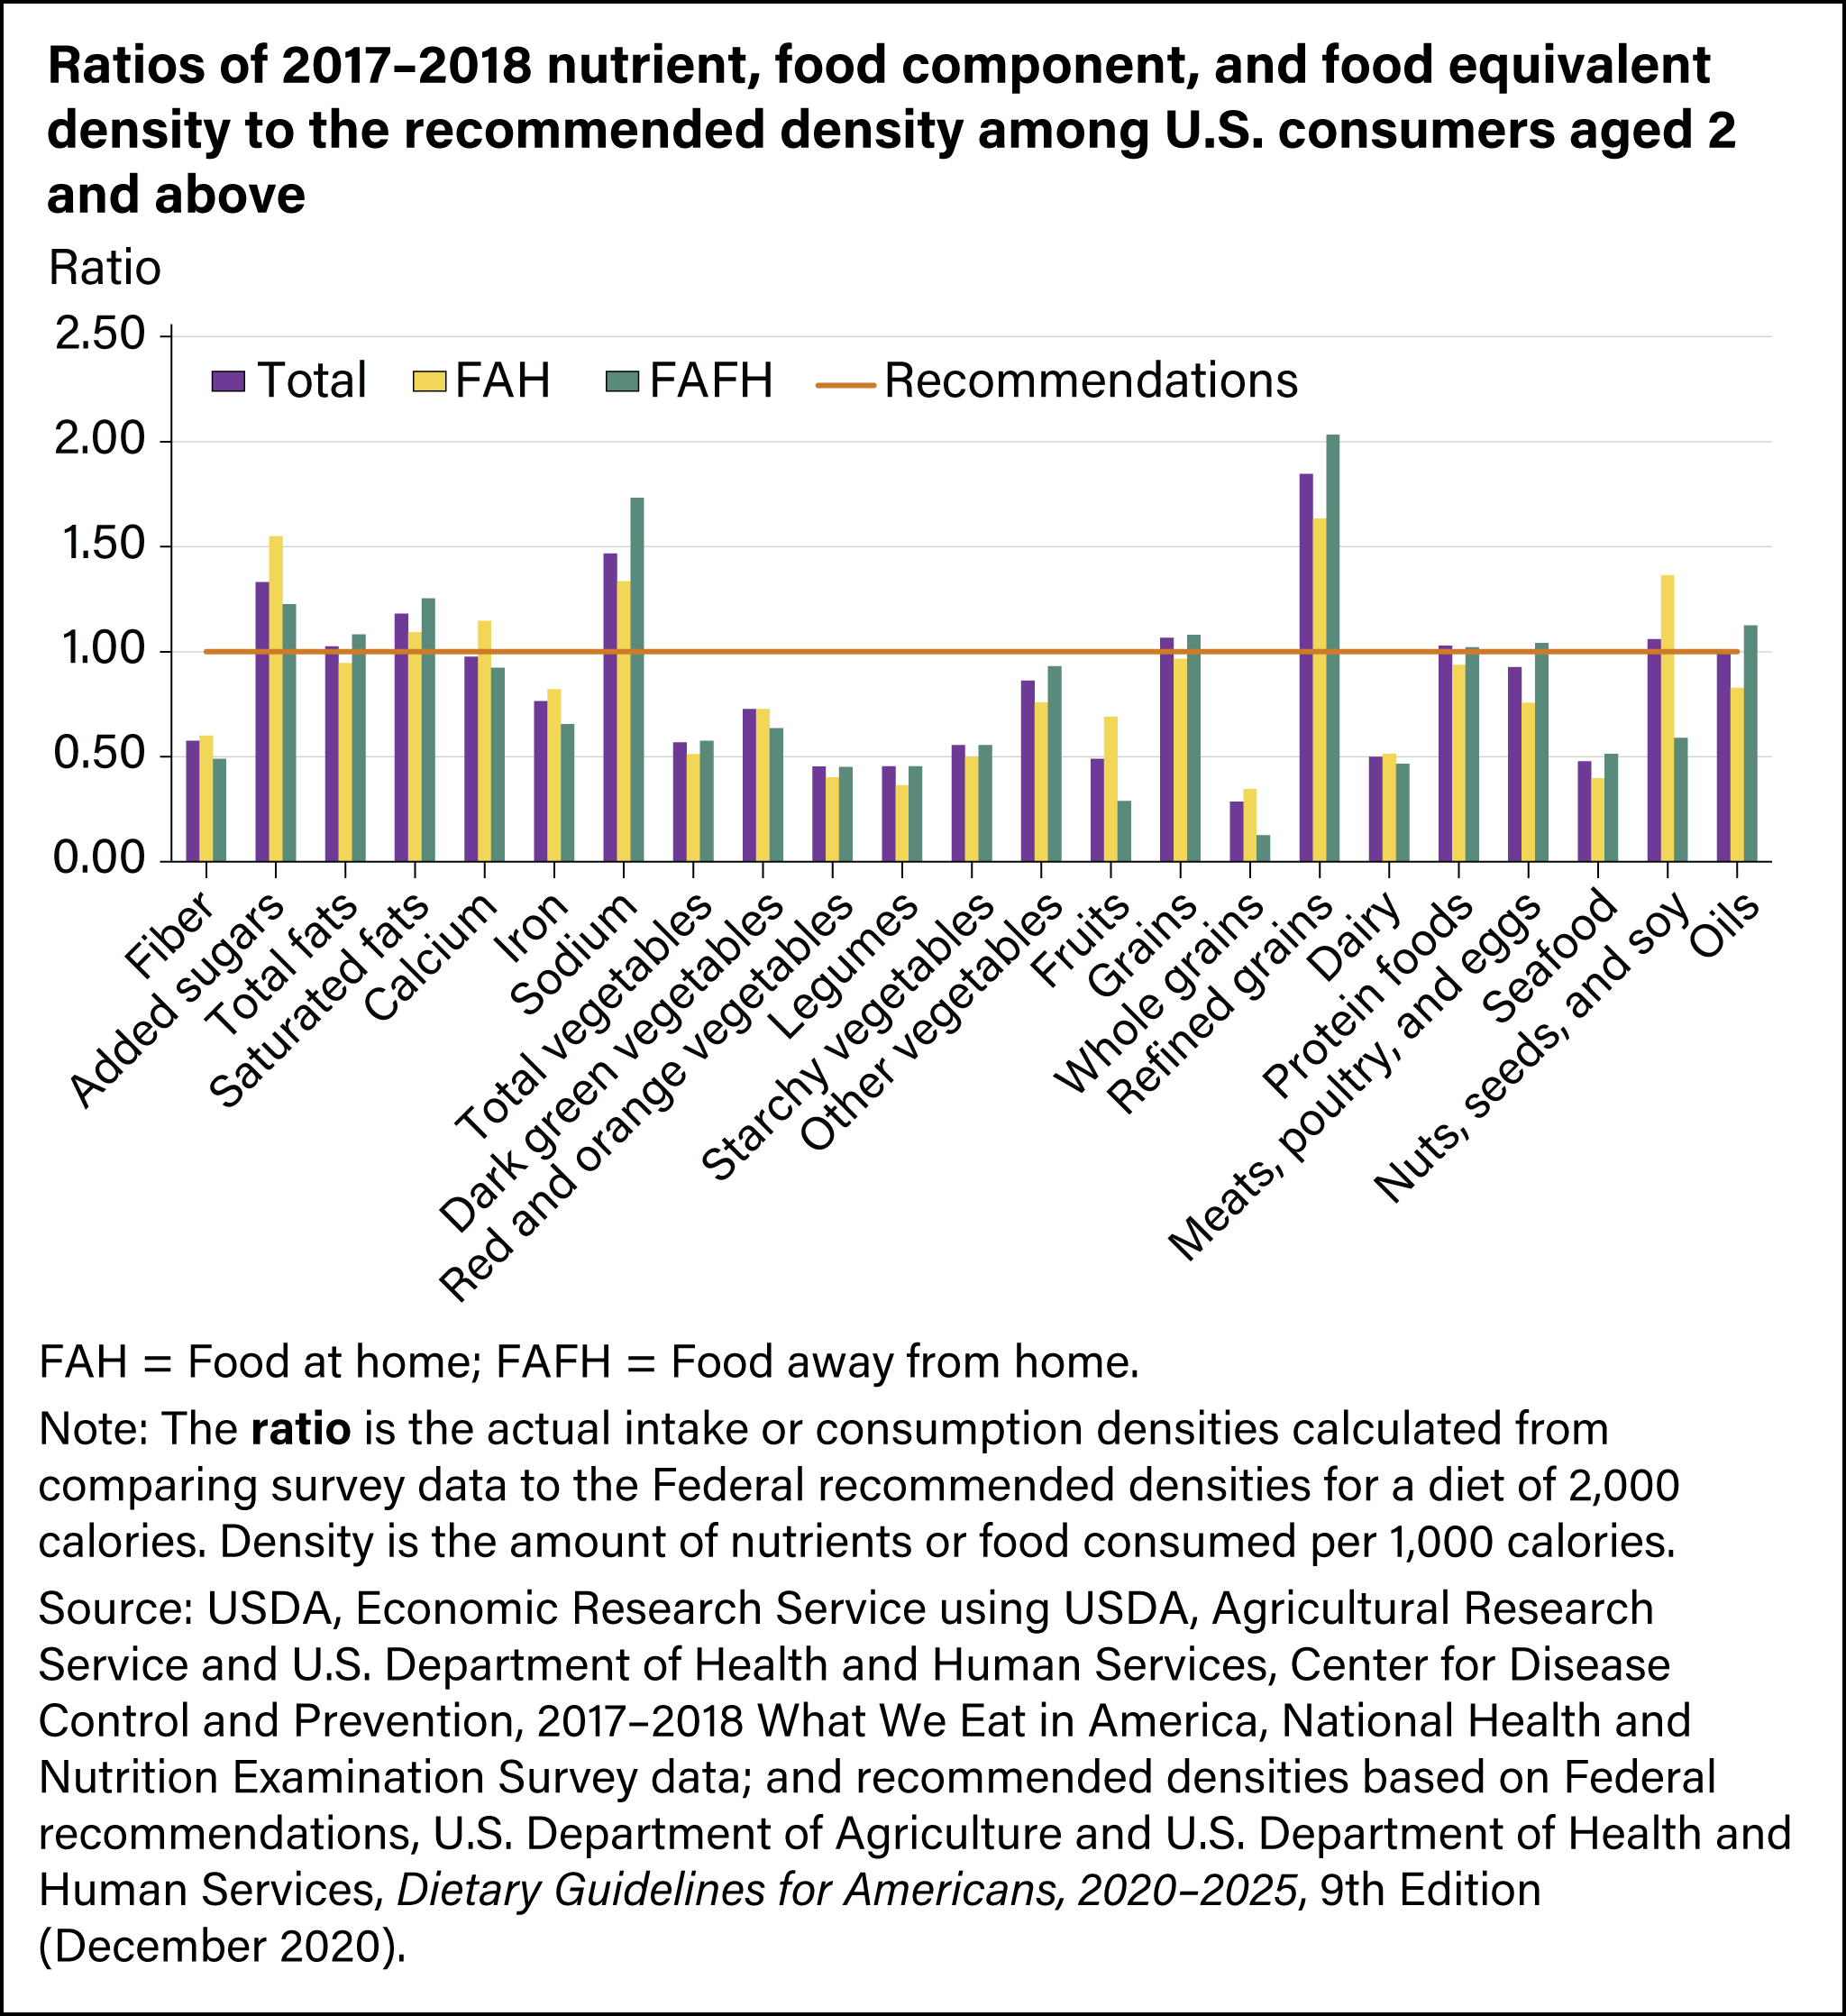
Figure 2
Download chart data in Excel format.
- U.S. consumers’ diets fall short of the 2020–2025 Dietary Guidelines for Americans’ recommendations by substantial margins, except for total fats, calcium, most of the protein foods, and oils (figure 2 and table 8). Of the 23 densities analyzed using 2017–2018 data, researchers found 16 deviated from their recommended levels by more than 20 percent including fiber, added sugars, saturated fats, iron, sodium, total vegetables, dark green vegetables, red and orange color vegetables, starchy vegetables, legumes, other vegetables, fruits, whole grains, refined grains, dairy, and seafood intake densities.
- In general, U.S. consumers make more nutritious choices when grocery shopping for foods than when ordering from the menu in a commercial eating establishment (figure 2 and table 8).
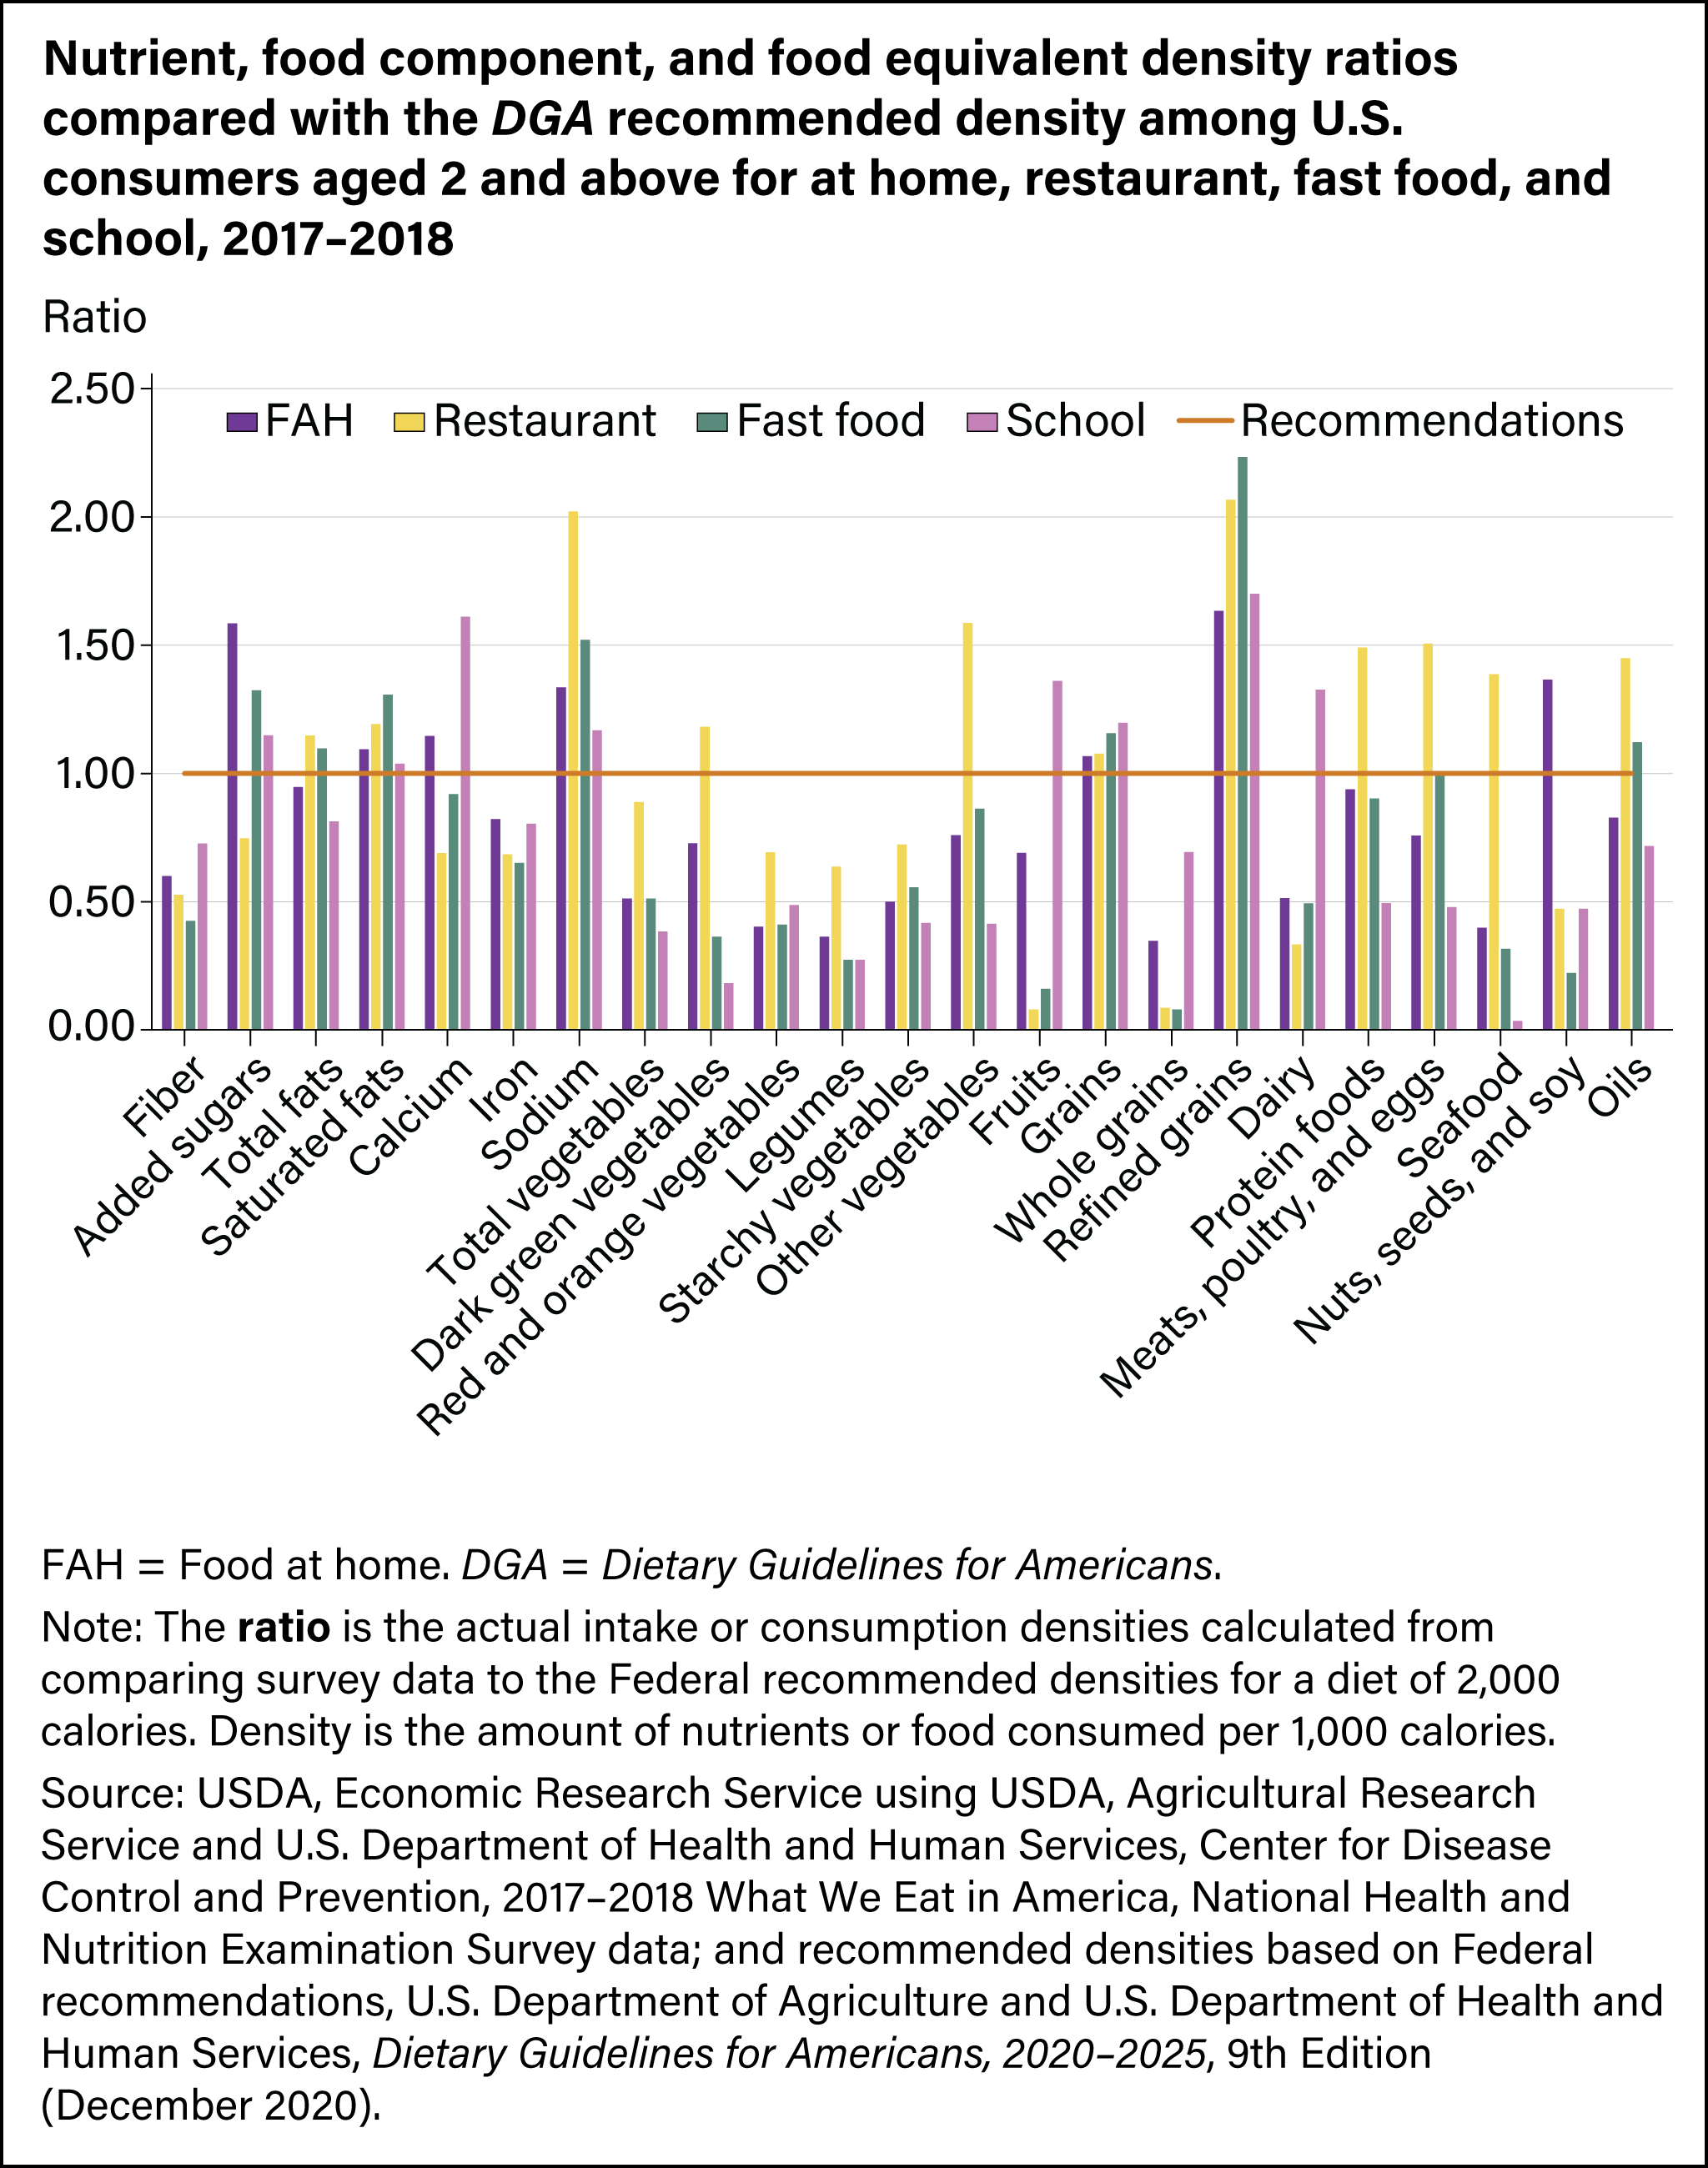
Figure 3
Download chart data in Excel format.
- Foods from restaurants and fast-food places were lower in several underconsumed nutrients and foods (e.g., fiber, calcium, iron, fruits, dairy, whole grains, nuts, seeds, and soy products) and higher in saturated fats, sodium, and refined grains than FAH (figure 3 and table 8).
- Restaurant foods were lower in added sugars and denser in vegetables, meats, poultry, eggs, and seafood than FAH (figure 3 and table 8).
- Since USDA updated school meal nutrition standards in 2012–2013, school foods (mostly provided by USDA school meal programs) have become twice as dense in whole grains as FAH and seven times denser than fast food and restaurant foods (table 8). The density of saturated fats decreased and the density of fiber and fruits increased in school foods since 2005–2006 (tables 5 and 8). However, vegetable consumption from school foods has not had the same improvement despite expanded vegetable offerings as part of updated school meal standards (table 8).
USDA, ERS researchers also examined differences in dietary quality across several demographics, including age, sex, race and ethnicity, household income, and education among adults aged 20 and above. For some dietary components, there are density disparities across certain demographic groups, whereas, for other dietary components (e.g., sodium), all groups fall equally short of Federal dietary guidance. Some of the major findings on demographics are highlighted here.
- Fiber density did not vary across race and ethnicity during 1977–1991, but the racial and ethnic gaps in fiber density have increased over time. Since 1994, non-Hispanic Black consumers’ diets have had a lower fiber density than non-Black consumers (table 4).
- Foods consumed by higher income (300 percent of the poverty level and above) consumers and individuals who have attended college were less dense in added sugars than their respective counterparts (table 7).
- The density of total vegetables consumed increased with age (table 7).
- Non-Hispanic Black consumers’ diets were lower in total vegetables and dairy density than non-Black consumers (table 7).
- Females incorporated more fiber and fruits, by density, in their diets than males, but fruit-group density did not vary by age, race and ethnicity, or household income (tables 4 and 7).