

General Documentation
Errata: On March 25, 2021, the General Documentation and the Documentation for the Farm Sector Financial Ratios pages in the Farm Income and Wealth Statistics data product were modified to correct formulas and associated text pertaining to value of production and production expenses. These corrections affect the documentation of the data product only, no reported data were affected.
Current Data Sources for Farm Income and Expenditure Estimates
The annual values for crop cash receipts for each State are based on data obtained from both published and unpublished NASS sources, the annual Agricultural Resource Management Survey (ARMS) Phase III, and USDA Farm Service Agency’s Commodity Credit Corporation (CCC) loan data. NASS annual crop quantities produced for each State are converted to quantities sold. Crop quantities are allocated over the 12 months of the calendar year using NASS monthly marketing percentages for that State, which are then converted to monthly open-market cash receipts using monthly average State prices. Monthly CCC loan receipts plus any profits from CCC transactions are added to the open-market sales to create monthly cash receipts. The sum of the State's monthly cash receipts from January through December for each crop obtains its calendar-year annual cash receipts. The U.S. estimate for each crop is the sum of the States' annual estimates.
The annual values for livestock cash receipts are based on NASS' annual Production, Disposition, and Income (PDI) reports and other published and unpublished NASS data. The Meat Animal PDI report contains information on cattle/calves and hogs. Dairy cow data are derived from the Milk PDI. Broiler, turkey, and egg data are provided by the Poultry & Egg PDI. The livestock commodities not accounted for in these reports are presented in other commodity-specific reports such as "Honey" or "Trout." Receipts for commodities not accounted for in individual or grouped reports are collected in a Minor Commodities report. Unlike crop cash receipts, all livestock commodities are measured on a calendar-year basis, so no transformations from commodity year to calendar year are required. The U.S. estimate for each livestock category is the sum of the States' annual estimates.
Annual estimates of home consumption for each State are based on State annual ARMS estimates for the 15 largest agricultural States. Estimates for the remaining States are based on their share of farm operations, reflecting the most recent NASS data, within their particular region. The value of inventory adjustment reflects the sum of each State's inventory adjustments for their respective crop inventories. Inventory adjustments reflect the value of the annual quantity change in inventories. U.S. estimates are a summation of the State estimates.
Most USDA estimates of farm sector production expenses for the 48 contiguous States are derived from annual ARMS results. USDA analysts from ERS and NASS use survey responses to produce estimates of 18 individual production expenses for the United States, 5 geographical regions, and 15 "core" States, as reported in NASS' Farm Production Expenses Annual Summary. The core States are the largest in terms of agricultural production.
Production expenses are first estimated for each production expense category for the United States. Estimates of each production expense and total expenses for 5 regions, the 15 "core" States, and the group of remaining States in each region are then produced. The intraregional distribution of expenses for noncore States are based on data reported in the latest census of agriculture. Since ARMS is conducted only for the 48 contiguous States, estimates for Alaska and Hawaii have to be generated using other sources (when ARMS is the basis for an estimate). Estimates for Alaska are based on the relationship of the State's values to the sum of the 48 contiguous States' values, most often determined via the census of agriculture. Hawaii's expense estimates are based mainly on the State's census of agriculture values in the census year adjusted by the change in its cash receipts in subsequent years. For hired labor, the census value is adjusted by results from the Farm Labor Survey. When no census expense exists, Hawaii's estimates are generated in a manner similar to Alaska's.
Method for Forecasting Cash Receipts
The current ERS method for forecasting farm sector cash receipts relies on a combination of historical commodity production/monthly prices from USDA’s National Agricultural Statistics Service and forecasts of commodity production and crop marketing-year average prices from the World Agricultural Outlook Board’s World Agricultural Supply and Demand Estimates (WASDE) report. However, the marketing-year schedule of the WASDE forecasts does not match the calendar-year (monthly) price data needed for the ERS cash receipt forecast.
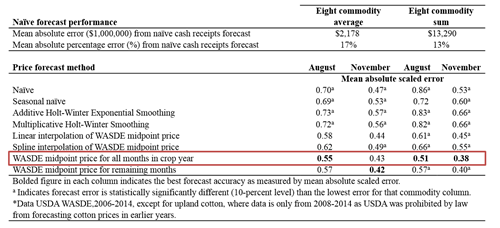
Previously, a calendar-year price forecast was developed by ERS commodity analysts using a number of different methods. To increase transparency and replicability, a new method was developed and implemented. Beginning in August 2016, farm income forecasts for the August and November releases will use the August and November WASDE midpoint price for the eight WASDE crop commodities (barley, corn, upland cotton, oats, rice, sorghum, soybeans, and wheat). The February forecast will use the current year’s commodity price forecast from ERS’ agricultural baseline report.
The calendar-year price approach described above was adopted after consideration of several alternatives for forecasting monthly commodity prices. We evaluated the performance of rolling forecasts created using different methods over the 2006-2014 period. The performance of each method was compared using contemporaneous WASDE prices against a forecast using actual prices, holding constant other parameters such as production, marketing percentages, production used on farm, and CCC loan activity. Our analysis suggested that the WASDE price forecasts deliver substantial value in terms of forecast accuracy compared to alternatives that rely on recent and seasonally adjusted historical data only. Among the WASDE-based methods that we considered, the method that applied the WASDE midpoint price for all months in the crop year had the lowest mean absolute scaled error (i.e., not statistically different from the best-performing method).
NASS Statistical Bulletins Currently Used in USDA's Net Farm Income Estimates
- Citrus Fruits
- Crop Production - Annual Summary
- Noncitrus Fruits and Nuts
- Vegetables - Annual Summary
- Potatoes - Annual Summary
- Crop Values - Annual Summary
- Land Values
- Farms, Land in Farms, and Livestock Operations
- Cattle
- Hogs and Pigs
- Milk Production
- Sheep and Goats
- Chickens and Eggs - Annual Summary
- Honey
- Meat Animals Production, Disposition, and Income - Annual Summary
- Milk Production, Disposition and Income - Annual Summary
- Poultry Production and Value
- Mink
| Value added components | Sources |
|---|---|
| Value of crop production | |
| Food grains | NASS Crop Production, Agricultural Prices, Crop Values, ARMS percent used on farms, and FSA-CCC loan data. |
| Feed crops | NASS Crop Production, Agricultural Prices, Crop Values, ARMS percent used on farms, and FSA-CCC loan data. |
| Cotton | NASS Crop Production, Agricultural Prices, Crop Values, ARMS percent used on farms, and FSA-CCC loan data. |
| Oil crops | NASS Crop Production, Agricultural Prices, Crop Values, ARMS percent used on farms, and FSA-CCC loan data. |
| Tobacco | NASS Crop Production, Agricultural Prices, and Crop Values |
| Fruits and tree nuts | NASS Citrus Fruits Summary and Noncitrus Fruits and Nuts Summary |
| Vegetables | NASS Vegetables Summary and Crop Values and Crop Production Summary |
| All other crops | Based on estimates provided by each NASS State Statistical Office from a survey of their minor crop commodities and NASS published estimates from Crop Values and Crop Production Summary |
| Home consumption | ARMS estimates of home State and regional home consumption; NASS number of farms |
| Value of inventory adjustment | NASS Crop Production, Agricultural Prices, Crop Values, ARMS percent used on farms, and FSA-CCC loan data. |
| Value of livestock production | |
| Meat animals | Based on NASS published estimates from Meat Animals Production, Disposition, and Income Report (PDI) |
| Dairy products | Based on NASS published estimates from Milk PDI |
| Poultry & eggs | Based on NASS published estimates from Poultry PDI |
| Miscellaneous livestock | Based on estimates provided by each State Statistical Office from a survey of their minor livestock commodities |
| Home consumption | ARMS estimates of home State and regional home consumption; NASS number of farms |
| Value of inventory adjustment | Based on NASS published estimates from Meat Animals PDI and Chickens and Eggs Summary |
| Revenues from services and forestry | |
| Machine and custom work | U.S., regions, 15 States: Estimate based on ARMS. Remaining States: ARMS estimate distributed with data from the most recent Census of Agriculture prior to the estimate year. |
| Forest products sold | Based on estimates provided by each State Statistical Office from a survey of their forest products sold |
| Other farm income | ARMS results, distributed with data from the most recent Census of Agriculture prior to the estimate year. Risk Management Agency administrative data |
| Gross imputed value of farm dwellings | For operator and other, non-labor dwellings: ARMS national distributors for nine ranges of dwelling value, 9 rent-to-value ratios from Bureau of Economic Analysis, and Operator and Other Dwelling Values for each State calculated from AELOS and the Census of Agriculture; hired labor dwellings are represented by the estimate for Perquisites from the Labor account. |
| Value of agricultural sector production: Purchased inputs | |
| Farm origin | |
| Feed purchased | U.S., regions, 15 States: Estimate based on ARMS. Remaining States: ARMS estimate distributed with data from the most recent Census of Agriculture prior to the estimate year., adjusted in intercensus years by a calculation of feed expenses using annual animal production and feed cost per unit from cost of production budgets updated with current-year prices. |
| Livestock and poultry purchased | U.S.: Sum of States. States: Livestock: Number of inshipments price per cwt. and average weights, from NASS; Poultry: poultry production and Agricultural Prices, from NASS. |
| Seed purchased | U.S., regions, 15 States: Estimate based on ARMS. Remaining States: ARMS estimate distributed with data from the most recent Census of Agriculture prior to the estimate year. |
| Manufactured inputs | |
| Fertilizer and lime | U.S., regions, 15 States: Estimate based on ARMS. Remaining States: ARMS estimate distributed with data from the most recent Census of Agriculture prior to the estimate year, adjusted in intercensus years by constrained change in the annual amount of Commercial Fertilizers purchased. |
| Pesticides | U.S., regions, 15 States: Estimate based on ARMS. Remaining States: ARMS estimate distributed with data from the most recent Census of Agriculture prior to the estimate year. |
| Fuel and oils | U.S., regions, 15 States: Estimate based on ARMS. Remaining States: ARMS estimate distributed with data from the most recent Census of Agriculture prior to the estimate year. All States: less refunds of Federal excise taxes distributed with census and State tax refunds based on data from the Office of Highway Policy Information, Dept. of Transportation. |
| Electricity | U.S., regions, 15 States: Estimate based on ARMS. Remaining States: ARMS estimate distributed with 1 data from the most recent Census of Agriculture prior to the estimate year, adjusted in intercensus years by change in number of farms from NASS and change in electricity rates from Dept. of Energy. |
| Other purchased inputs | |
| Repair and maintenance of capital items | U.S., regions, 15 States: Estimate based on ARMS. Remaining States: ARMS estimate distributed with value of land and buildings; number of vehicles and tractors on farms from Census and number of farms. |
| Machine hire and custom work | U.S., regions, 15 States: Estimate based on ARMS. Remaining States: ARMS estimate distributed with data from the most recent Census of Agriculture prior to the estimate year, adjusted in intercensus years by change in number of farms from NASS. |
| Marketing, storage, and transportation | U.S., regions, 15 States: Estimate based on ARMS. Remaining States: ARMS estimate distributed with total cash receipts. |
| Contract labor | U.S., regions, 15 States: Estimate based on ARMS. Remaining States: ARMS estimate distributed with data from the most recent Census of Agriculture prior to the estimate year. |
| Miscellaneous expenses | U.S., regions, 15 States: Estimates based on ARMS. Remaining States: ARMS estimate distributed with total value of production; livestock value of production; miscellaneous livestock cash receipts; cattle on feed and broiler, hog and egg production; 2003 Farm and Ranch Irrigation Survey; insurance premiums, 1999 Agricultural Economics and Land Ownership Survey (AELOS); 2014 Tenure, Ownership and Transition of Agricultural Land (TOTAL) was used for estimates after 2013. Risk Management Agency administrative data. |
| Net Government transactions | |
| + Direct Government Payments | Payments to producers for programs administered by Farm Service Agency or Natural Resources Conservation Service and paid by Farm Service Agency-Calendar Year Report of Payments to Producers by State and Category (MS-241R) from Farm Service Agency; Payments to producers for programs administered and paid by Natural Resources Conservation Service-Fiscal Year Report of Monthly Payments to Producers by State and Category from Natural Resources Conservation Service. |
| - Vehicle registration and licensing fees | U.S., Regions, 15 States: Estimate based on ARMS. Remaining States: ARMS estimate distributed with number of vehicles on farms. |
| - Property taxes | U.S., Regions, 15 States: Estimate based on ARMS. Remaining States: ARMS estimate distributed with data from the most recent Census of Agriculture prior to the estimate year; and 1999 AELOS; 2014 TOTAL was used for estimates after 2013. |
| Gross value added | |
| Capital consumption | U.S.: Declining balance of capital stock, ARMS-based capital expenditures, and NASS prices paid indexes. States: Value of land and buildings; number of vehicles and tractors on farms; value of machinery from 1999 AELOS (2014 TOTAL was used for estimates after 2013) adjusted in intercensus years for changes in balance sheet values. |
| Net value added: Payments to stakeholders | |
| Employee compensation | U.S., regions, 15 States: Estimate based on ARMS. Remaining States: ARMS estimate distributed with data from the most recent Census of Agriculture prior to the estimate year. |
| Net rent received by nonoperator landlords | Cash and share rent: U.S., regions, 15 States: Estimates based on ARMS; Remaining States: ARMS estimate distributed with data from the most recent Census of Agriculture prior to the estimate year, and 1999 AELOS (2014 TOTAL was used for estimates after 2013) adjusted in intercensus years by crop value of production. Government payments: U.S. ratio of total Government payments based on data from FSA; States: ARMS regional estimates and State distribution of Government payments within regions. Expenses: ARMS regional estimates distributed with 1999 AELOS (2014 TOTAL) percent of region; 1999 AELOS (2014 TOTAL) ratios of landlord to total for interest, taxes, and capital consumption. |
| Real estate and nonreal estate interest | U.S. and State debt from lenders, excluding debt identified by ARMS as nonfarm debt, and interest rates based on ARMS from Balance sheet. |
| Net farm income | Residual |
Assets, Debt, and Wealth Data Sources and Definitions
| Variable | Source |
|---|---|
| Farm asset data | |
| Real estate assets | USDA-NASS—Land Values Summary; Farms, Land in Farms, and Livestock Operations; Agricultural Economics and Land Ownership Survey (AELOS); Tenure, Ownership and Transition of Agricultural Land (TOTAL); and USDA-Agricultural Resource Management Survey (ARMS) |
| Livestock and poultry | USDA-NASS and USDA-ERS farm income statement |
| Machinery and motor vehicles | Census of Agriculture, USDA-ERS estimates and USDA-ARMS survey |
| Crops stored | USDA-NASS and ERS farm income statement |
| Purchased inputs | USDA-ARMS survey |
| Financial assets | USDA-ARMS survey; Economic Report of the President |
| Farm debt data | |
| Source institution | Source |
| Farm Credit System | Farm Credit System—Quarterly Information Statement online |
| Farm Service Agency | Administrative data: FSA 616 Report as of 9/30 and extrapolated to 12/31 |
| Commercial banks | Board of Governors of the Federal Reserve System, Agricultural Finance Databook, table B.1. |
| Insurance companies | Data collected online from the Life Insurers Fact Book |
| Individuals and others | ARMS expanded to sector level estimate using 1999 AELOS (2014 TOTAL was used after 2013) distribution to account for absence of landlords in ARMS data |
| Notes: For real estate debt, an adjustment is applied that reduces the total amount of farm debt by the amount of loans attributable to operator dwellings. ARMS is the source for the amount of debt owed for operator dwellings owned by farm businesses. Both real estate and nonreal estate debt are adjusted for nonfarm uses based on responses to the most recent ARMS survey. | |
| Measure | Computational method | Significance |
|---|---|---|
| Efficiency | ||
| Asset turnover ratio | (Value of production + Government payments)/((assets(t) + (assets(t–1))/2) | Measures gross farm income generated per dollar of farm sector assets |
| Operating expense ratio |
(Total production expenses –interest expenses – capital consumption)/(value of production + Government payments) |
Measures the amount of cash the farm sector spends to generate a dollar of production |
| Net farm income ratio | Net farm income/(value of production + Government payments) | Measures the amount of net income generated per dollar of production in the farm sector |
| Interest expense ratio | Interest expense/(value of production + Government payments) | Measures the proportion of production used to make interest payments on debt |
| Capital consumption ratio | Capital consumption/(value of production + Government payments) | Measures the amount of capital used up to generate a dollar of production |
| Liquidity | ||
| Current ratio | Current assets/current debt | Measures the farm sector's ability to meet short-term obligations |
| Working capital | Current assets – current debt | Measures the amount of cash that would be available to fund operating expenses after paying off current debt |
| Working capital to gross revenues ratio | Working capital/(value of production + Government payments) | Measures the amount of working capital available relative to the total size of the farm sector |
| Debt service ratio | (Interest + principal payments)/(value of production + Government payments) | Measures share of farm sector's gross income needed to service debt |
| Times interest earned | (Net farm income + interest expense)/interest expense | Measure the ability to cover debt payments, specifically interest payments |
| Profitability | ||
| Net farm income | Value of production – operating expenses + net Government transactions – capital consumption – payments to stakeholders | Measures residual income left over after all factors of production are paid |
| Earnings before interest, taxes and capital consumption | Net farm income + interest expense + taxes + capital consumption | Measures gross income before accounting for financing costs, taxes and use of long-term capital investments |
| Operating profit margin ratio | (Net farm income + interest expense – returns to unpaid labor/management)/(value of production + Government payments) | Measures the profits earned per dollar of gross cash income |
| Total rate of return on equity | Rate of return on farm equity from income + rate of return on farm equity from capital gains | Measures the total per-dollar return on farm equity |
| Rate of return on equity from income | (Net farm income – returns to unpaid labor/management)/((equity(t) + equity(t–1))/2)) | Measures the per-dollar return on farm equity from income |
| Rate of return on equity from capital gains | (Assets(t) – assets(t–1))/((equity(t) + Equity(t–1))/2) | Measures the per-dollar (accrued) return on farm equity from (accrued) capital gains |
| Total rate of return on assets | Rate of return on farm assets from income + rate of return on farm assets from capital gains | Measures the total per-dollar return on farm assets |
| Rate of return on assets from income | (Net farm income + interest expense – returns to unpaid labor/management)/((assets(t) + assets(t–1))/2)) | Measures the per-dollar return on farm assets from income |
| Rate of return on assets from capital gains | (Assets(t) – assets(t–1))/((assets(t) + assets(t–1))/2) | Measures the per-dollar (accrued) return on farm assets from (accrued) capital gains |
| Solvency | ||
| Debt-to-asset ratio | Debt/assets | Measures farm sector debt relative to assets, indicating overall financial risk |
| Debt-to-equity ratio | Debt/equity | Measures the relative proportion of funds invested by creditors (debt) and owners (equity) |
| Equity-to-asset ratio | Equity/assets | Measures the proportion of farm assets claimed by farm owners |