ERS Charts of Note
Subscribe to get highlights from our current and past research, Monday through Friday, or see our privacy policy.
Get the latest charts via email, or on our mobile app for  and
and 
Wednesday, November 30, 2016
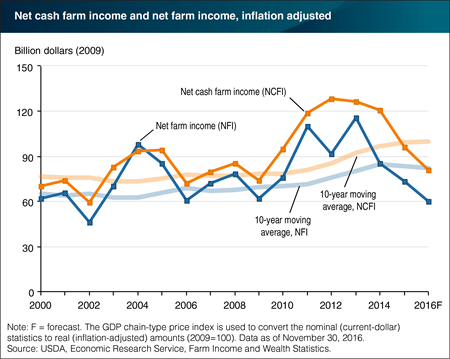
Net cash farm income and net farm income are two conventionally used and related measures of farm sector profitability. The first measure includes cash receipts, government payments, and other farm-related cash income net of cash expenses, while the second is more comprehensive and incorporates noncash transactions such as implicit rents, changes in inventories, and economic depreciation. Following several years of high income, both measures have trended downward since 2013. ERS forecasts that net cash farm and net farm income for 2016 will be $90.1 billion and $66.9 billion, respectively, or $80.9 billion and $60.1 billion, respectively, when adjusted for inflation (in 2009 dollars). Cash receipts declined across a broad set of agricultural commodities in 2015, and are expected to fall further in 2016—primarily for animal/animal products. Production expenses are forecast to contract in 2016, but not enough to offset the commodity price declines. Net cash farm and net farm income are below their 10-year averages, which include surging crop and animal/animal product cash receipts from 2010 to 2013. Find additional information and analysis in ERS’ Farm Sector Income and Finances topic page, updated November 30, 2016.
Wednesday, September 28, 2016
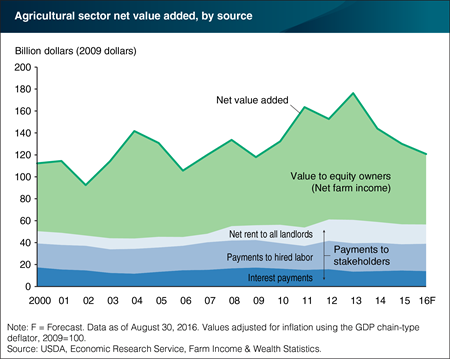
ERS forecasts net value added will decline by 6.1 percent and payments to stakeholders will increase by 0.9 percent ($0.5 billion) in 2016. Net value added represents the sum of economic returns to all stakeholders and equity owners. Stakeholders provide the hired labor, leased capital, and rental land used in agricultural production, but in most cases do not directly share risk in the short term. Stakeholders receive a fixed ¬payment in return for their services while equity owners share in the profits (net farm income). In general, the payments that stakeholders receive adjust more slowly over time than net returns to the equity owners of agricultural production. Find additional information and analysis in ERS’ Farm Sector Income and Finances topic page, released August 30, 2016.
Tuesday, August 30, 2016
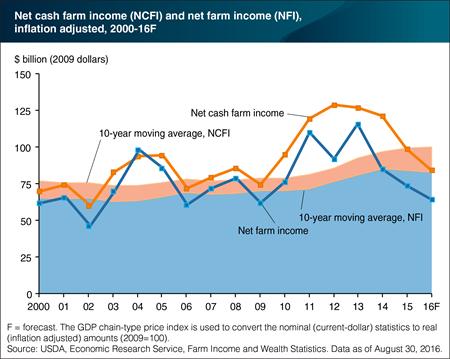
Net cash farm income (NCFI) and net farm income (NFI) are two common measures of farm sector profitability. NCFI includes cash receipts and farm program government payments less cash expenses; it represents the net cash income available to farmers in a given year. NFI is a broader measure that represents the net value added to the U.S. economy by the agricultural sector, and includes noncash transactions such as changes in inventories, capital replacement, and implicit rent and expenses related to the farm operators’ dwelling. Following several years of high income, both measures have trended downward since 2013. ERS forecasts that, in 2016, net cash farm and net farm income will fall to $94.1 billion and $71.5 billion, respectively ($84.6 billion and $64.3 billion, when adjusted for inflation); these values are below their 10-year averages in both nominal and inflation-adjusted terms. Lower forecasts for NCFI and NFI reflect price declines across a broad set of agricultural commodities in 2015 that are expected to continue in 2016. A forecast increase in government payments and decline in production expenses in 2016 only partially offset the drop in commodity receipts. Find additional information and analysis on the 2016 farm sector income forecast in ERS’ Farm Sector Income and Finances topic page, released August 30, 2016.
Monday, August 8, 2016
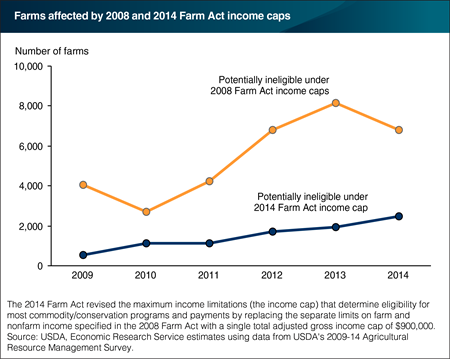
The 2014 Farm Act revised the maximum income limitations (the income cap) that determine eligibility for most commodity and conservation programs and payments by replacing the separate limits on farm and nonfarm income specified in the 2008 Farm Act with a single total adjusted gross income cap of $900,000. Based on data for 2009-14--a period of overall increasing farm sector income--a comparison of the impact of the income caps imposed by the 2008 and 2014 Farm Acts finds that the number of potentially ineligible farms increases over the period under both income caps. The potential number of farms affected by the 2014 income cap is below the number affected by the 2008 income caps, averaging 1,500 farms per year (about 0.1 percent of all farms) for the period 2009-14. This chart is found in the August 2016 Amber Waves feature, "Farm Bill Income Cap for Program Payment Eligibility Affects Few Farms."
Friday, July 29, 2016
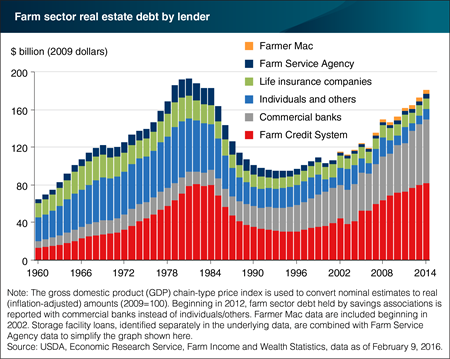
Since the late 1970s, the Farm Credit System (FCS) has been the largest U.S. lender to the farm sector for loans secured by real estate. The trend in outstanding real estate debt held by FCS closely tracks the overall sector real estate debt trend. Debt held by FCS peaked in the early 1980s and then declined for the next decade before increasing to an inflation-adjusted high of $81.7 billion in 2014. Prior to the 1990s, commercial banks held substantially less debt than the FCS. However, farm sector real estate debt held by commercial banks has increased sharply since the 1990s, leading commercial banks to become the second most prominent farm real estate lender. Farmer Mac, though small relative to FCS and commercial banks, has also shown growth in real estate debt outstanding during the period. While the real estate debt outstanding at FCS, commercial banks, and Farmer Mac has grown sharply since the 1990s, the trend has held relatively flat or declined modestly for the other lenders in that period. This chart is found in the July 2016 Amber Waves article, “Trends in Farm Sector Debt Vary by Type of Debt and Lender.”
Wednesday, July 20, 2016
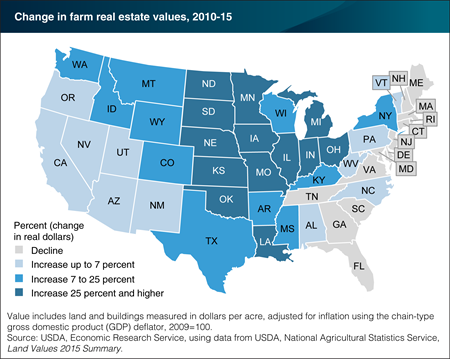
Between 2010 and 2015, change in inflation-adjusted average farm real estate values (the value of farmland and buildings) varied widely across the 48 contiguous States. The value of farm real estate is expected to change over time to reflect changes in expectations for income streams from future use—including both agriculture and nonagricultural uses. Over 2010-15, the largest State percentage increases in farm real estate values occurred in the Northern Plains and Midwest regions, presumably based on expectations of high farm-based earnings. In contrast, while farmland values in the Northeast region are typically among the highest in the country, this is largely due to urban proximity rather than agricultural returns, and declines in farm real estate values generally reflect regional impacts from the downturn in the residential housing market. This map is based on the data visualization, Charts and Maps of U.S. Farm Balance Sheet Data, in the Farm Income and Wealth Statistics data product, February 2016.
Monday, June 20, 2016
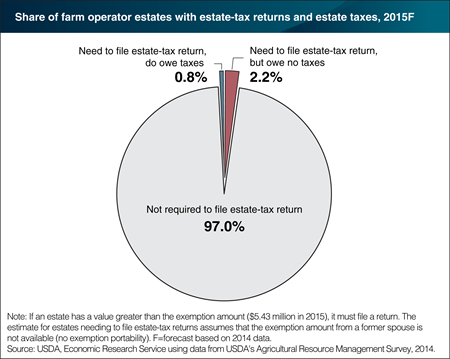
The Federal estate tax applies to the transfer of property at death. Under present law, the estate of a decedent who, at death, owns assets in excess of the estate-tax exemption amount ($5.43 million in 2015) must file a Federal estate-tax return. However, only those returns that have a taxable estate above the exempt amount (after deductions for expenses, debts, and bequests to a surviving spouse or charity) are subject to tax at a graduated rate, up to a current maximum of 40 percent. Based on simulations using farm-level survey data from USDA’s 2014 Agricultural Resource Management Survey (ARMS), about 3 percent of farm estates would have been required to file an estate tax return in 2015, while 0.8 percent of all farm estates would have owed any Federal estate tax. This chart is based on the ERS topic page on Federal Estate Taxes.
Wednesday, June 15, 2016
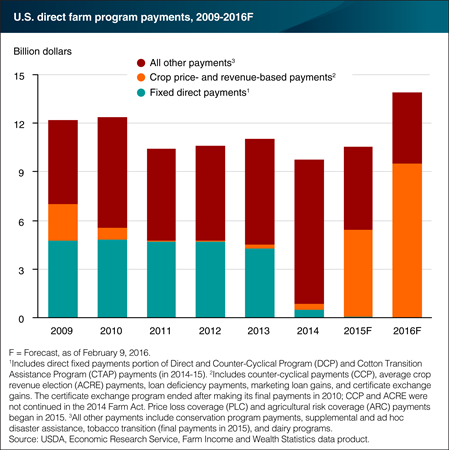
“Direct” farm program payments are those paid directly from the U.S. Government to farmers and include fixed payments, crop price- and revenue-based payments, and other payments such as conservation payments and disaster relief. Direct farm program payments are forecast to rise by about 31 percent in 2016 to $13.9 billion. The forecast reflects changes made in the 2014 Farm Act that eliminated several programs and added new price- and revenue-based support programs in an environment of declining crop prices. The largest of these (in terms of payouts in 2015) were the Price Loss Coverage (PLC) and Agricultural Risk Coverage (ARC). Although these programs commenced in 2014, payments corresponding to 2014 crop production (based on average prices received over the 2014-2015 crop marketing year) were made in the latter part of 2015. PLC and ARC together are expected to account for over $9 billion in 2016—about 96 percent of all crop price- and revenue-based payments. The majority of ARC payments were paid to farms with a history of corn production, followed by wheat and soybeans. PLC payments were primarily made to farms with a history of long-grain rice, peanuts, and canola production. This chart is found in the ERS topic page on the 2016 Farm Sector Income Forecast.
Tuesday, April 26, 2016
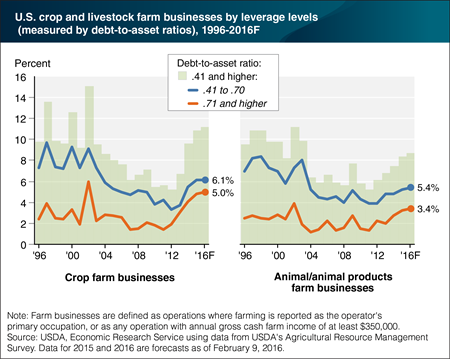
Farm businesses—those farms with at least $350,000 in annual sales or farms with lower revenues where the operator’s primary occupation is farming—account for more than 90 percent of U.S. farm sector production, and hold 71 percent of all farm assets and 80 percent of farm debt, according to USDA’s 2014 Agricultural Resource Management Survey (ARMS). Debt-to-asset (D/A) ratios measure the amount of assets that are financed by debt, and are an indicator of the level of a farm’s solvency. The share of farm businesses that are highly leveraged (defined as having debt-to-asset ratios greater than .40) has trended upward since 2012 and is forecast to increase slightly in both 2015 and 2016. Farm businesses specializing in crops are forecast to have higher shares of both highly and very highly leveraged operations (with over .70 D/A ratios) than those specializing in animals/animal products. In 2016, the share of very highly leveraged crop farms is expected to reach the highest level since 2002. Because lending institutions consider D/A (along with other measures reflecting the chance of default) to assess credit worthiness of farms, some of these highly and very highly leveraged farm businesses may have difficulty securing a loan. This chart updates one found in the ERS report, Debt Use by U.S. Farm Businesses, 1992-2011, April 2014.
Thursday, April 14, 2016
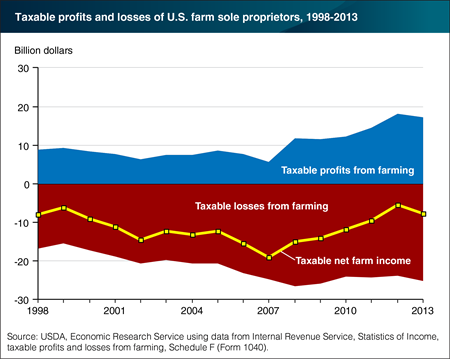
U.S. farm households generally receive income from both farm and off-farm activities, and for many, off-farm income largely determines the household’s income-tax liability. Since 1980, farm sole proprietors, in aggregate, have reported negative net farm income for tax purposes. From 1998 to 2008, both the share of farm sole proprietors reporting losses and the total amount of losses reported generally increased, due in part to deduction allowances for capital expenses. Since 2007, strong commodity prices bolstered farm-sector profits and the net losses from farming declined, leading to a peak in taxable profits (though still a negative taxable amount on net) in 2012. In 2013, the latest year for which complete tax data are available, U.S. Internal Revenue Service data showed that nearly 68 percent of farm sole proprietors reported a farm loss, totaling $25 billion. The remaining farms reported profits totaling $17 billion. This chart is found on the ERS Federal Tax Issues topic page, updated April 2016.
Monday, March 14, 2016
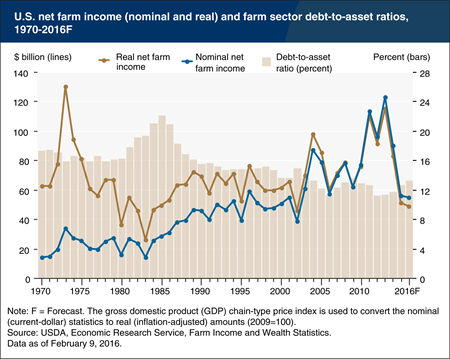
National net farm income, along with the farm-sector debt-to-asset ratio (which is a measure of solvency), provide indicators of the economic well-being of the U.S. farm sector. As of February 9, 2016, U.S. net farm income is forecast to fall to $54.8 billion in 2016 after recently peaking in 2013, due largely to declines in commodity prices. In inflation-adjusted terms, since 1970 only 5 years have registered lower net farm income. With the exception of 2002, all of those years were in the early 1980s, a time of great farm financial stress. The sector’s debt-to-asset ratio has edged up the past several years but at 13.2 percent remains well below the ratio’s 1985 peak. Recent inflation-adjusted debt levels are near, but have not exceeded, early 1980s levels. Thus, the improvement in farm-sector solvency has hinged on farm-sector asset values, which have roughly doubled since 1985 in inflation-adjusted terms. About 80 percent of the value of farm-sector assets are attributable to farm real estate, and both farm real-estate and nonreal-estate assets are expected to experience modest declines in 2015 and 2016. This chart is based on data found in Farm Income and Wealth Statistics, released February 2016.
Friday, February 19, 2016
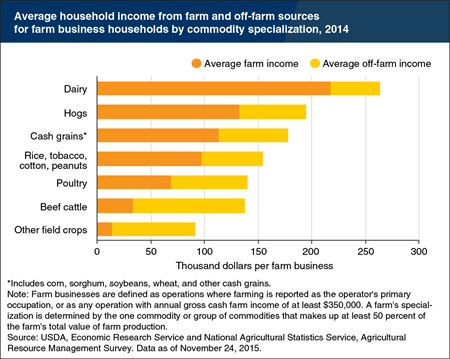
On average, households associated with farm businesses supplement farm income with income from off-farm sources. However, across different types of farm operations, the extent that off-farm income supplements farm income varies considerably. For example, with its extensive and ongoing time demands, managing a dairy farm rarely permits an operator to work many hours off-farm and is a main reason why farm income constitutes over four-fifths of these households’ total income. In 2014, households with farm businesses specializing in dairy and hogs had the highest average total household income (combining income from farm and off-farm sources), and the highest shares of household income derived from farming, followed by farms specializing in cash grains (corn, soybeans, sorghum, or wheat). Farm households with businesses specializing in beef cattle, other field crops, and poultry had the largest shares of average household income derived from off-farm activities. This chart is a variation of one found in the Farm Household Well-being topic page, and based on data available in ARMS Farm Financial and Crop Production Practices.
Tuesday, February 9, 2016
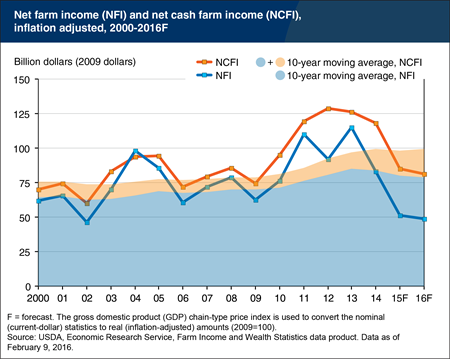
Net cash farm income and net farm income are two popular, but distinct, measures of farm sector profitability. The first measure tracks cash receipts and cash expenses, while the second also includes noncash transactions, including implicit rents, changes in inventories, capital replacement costs, and others. Following several years of high income, both measures have trended downward since 2013. ERS forecasts that net cash farm and net farm income for 2016 will be $90.9 billion and $54.8 billion, respectively, or $81.1 billion and $48.9 billion, respectively, in inflation-adjusted dollars. These amounts are below their respective 10-year average, in both nominal and inflation-adjusted terms. Before recent dips, the 10-year averages for both income measures have largely trended upward. Over the 2010 to 2013 period, surging crop and animal (including animal-product) cash receipts led net cash farm income and net farm income higher. Prices are expected to have declined for a broad set of agricultural commodities in 2015, and fall further in 2016. Production expenses are forecast to contract in 2016, but not enough to offset the commodity price declines. Find additional information and analysis in ERS’ Farm Sector Income and Finances topic page, released February 9, 2016.
Monday, December 28, 2015
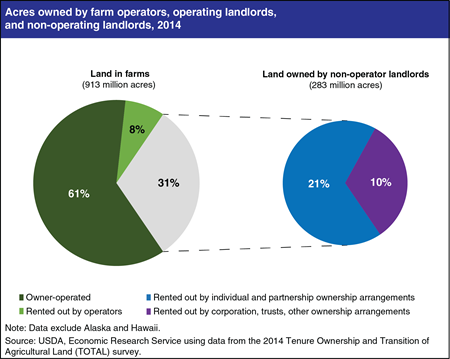
Of the 911 million acres of land in farms, 61 percent is operated by the land owner, according to the 2014 Tenure Ownership and Transition of Agricultural Land (TOTAL) survey. Another 8 percent (70 million acres) of land in farms is rented from other farm operators. The remaining land in farms (31 percent or 283 million acres) is rented from “non-operating landlords,” or landlord entities that are not currently farmer operators. The majority of acres owned by these non-operating landlords is held by individuals or in partnerships (191 million acres or 21 percent of land in farms). Corporations, trusts, or other ownership arrangements also rent out 92 million acres (about 10 percent of land in farms) to operators. Even though some agricultural land is owned by non-operating landlords, many of these landlords have prior farming experience. Of the 191 million acres owned in individual or partnership arrangements, nearly half were held by a retired farmer or rancher in 2014. Six percent of the acres owned in individual and partnership arrangements by non-operating landlord entities had a principal landlord that reported spending greater than 50 percent of their work time in farm or ranch work, but not as a farm operator. More information can be found on the ERS Land Use, Land Value & Tenure topic page.
Tuesday, December 22, 2015
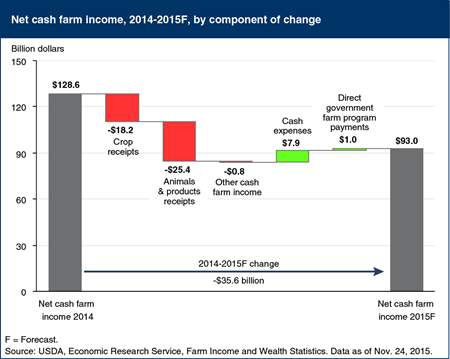
U.S. net cash farm income (NCFI)—the funds available to farm operators to meet family living expenses and pay down debt—is forecast to decline in 2015. This would be the second consecutive year of decline for NCFI, after reaching recent highs in 2012 and 2013. NCFI is expected to drop by $35.6 billion (28 percent) to $93 billion in 2015. If realized, the 2015 forecast would be the lowest since 2009, and $14.7 billion (in real terms) below the previous 10-year average. The drop in NCFI reflects a broad decline in commodity receipts. Crop receipts are expected to decrease by $18.2 billion from 2014, led by projected declines in receipts for corn ($8.6 billion) and soybeans ($5.7 billion). Livestock receipts are expected to decline by $25.4 billion, with the largest decreases in receipts expected for dairy ($13.9 billion), hogs ($6.6 billion), and broilers ($4.4 billion). Partially offsetting reduced cash receipts, total cash expenses are forecast to decrease by $7.9 billion in 2015, the first decline since 2009. Government payments are also projected to rise 10 percent ($1.0 billion) to $10.8 billion in 2015. This chart is based on information found in the 2015 Farm Sector Income Forecast, released November 24, 2015.
Tuesday, November 24, 2015
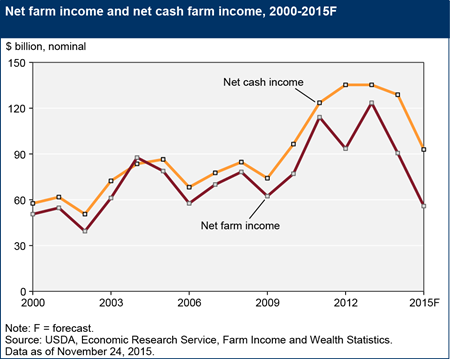
U.S. net farm income—a measure of the sector’s profitability—is forecast to be $55.9 billion in 2015, down 38 percent from 2014’s estimate of $90.4 billion. If realized, the 2015 forecast for net farm income would be the lowest since 2002 (in both real and nominal terms) and a drop of 55 percent from the recent high of $123.3 billion in 2013. Lower crop receipts (declining by $18.2 billion) and livestock receipts (declining by $25.4 billion) are the main drivers of the change, as total production expenses are projected down by 2 percent ($7.7 billion) and government payments are forecast to increase about 10 percent ($1.0 billion) in 2015. Net cash income is forecast at $93.0 billion, down about 28 percent from the 2014 estimate. Net cash income is projected to decline less than net farm income primarily because it reflects the sale of carryover stocks from 2014. This chart is found in 2015 Farm Sector Income Forecast, released November 24, 2015.
Thursday, October 1, 2015
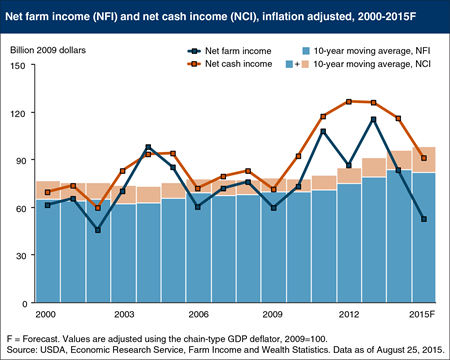
Net farm income and net cash income are two key measures of farm sector profitability. Following several years of high income, both have trended downward since peaking in 2013. ERS forecasts that both net cash and net farm income for 2015 will be below their 10-year moving averages in inflation-adjusted terms for the first time since 2009. Before falling in 2014 and 2015, both income measures had largely trended upward since 2009. Over the 2010 to 2013 period, surging crop, animal, and animal product cash receipts outpaced the growth in production expenses, leading net cash and net farm incomes (and their 10-year moving averages) higher. However, commodity receipts are forecast to fall sharply in 2015. Production expenses are also forecast to contract in 2015 after several years of growth, but not enough to offset the decline in commodity receipts. This chart is based on data found in Farm Income and Wealth Statistics, updated August 25, 2015.
Tuesday, September 8, 2015
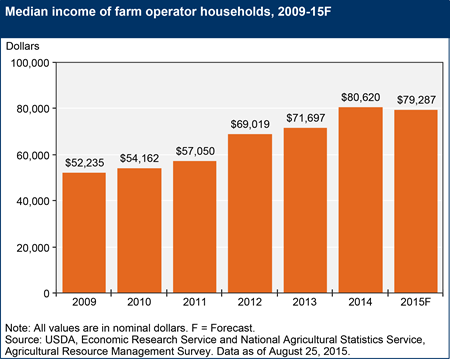
The median total income of farm households has increased steadily over the past 5 years (in both nominal and inflation-adjusted terms), peaking at an estimated $80,620 in 2014. However, it is forecast to decrease slightly in 2015, to $79,287. Households with commercial farms—operations which earn at least $350,000 in gross cash farm income—derive roughly three-fourths of their income from farming. Conversely, off-farm income contributes substantially to the total income of many farm households, especially those with smaller farms or a primary occupation other than farming. Farm households, on average, derive roughly 60 percent of their off-farm income from wages, salaries, and operating other businesses, while the remaining portion comes mostly from interest, dividends, and private and public transfer payments. Farm household median income remains higher than the median income of U.S. households, which was $51,939 in 2013 (the latest figure available). This chart is based on the Farm Household Well-Being Topic Page.
Tuesday, September 1, 2015
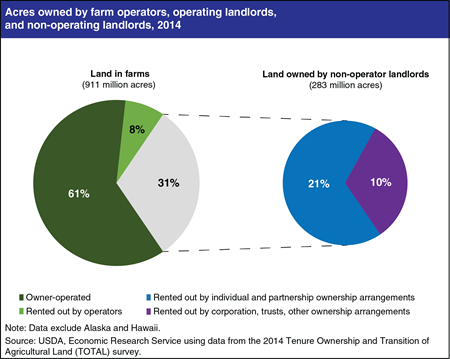
Of the 911 million acres of land in farms in the continental U.S., 61 percent is operated by the land owner, according to the 2014 Tenure Ownership and Transition of Agricultural Land (TOTAL) survey. Another 8 percent (70 million acres) of land in farms is rented from other farm operators. The remaining land in farms (31 percent or 283 million acres) is rented from “non-operating landlords”, or landlord entities that are not currently farmer operators. The majority of acres owned by these non-operating landlords is held by individuals or in partnerships (191 million acres or 21 percent of land in farms). Corporations, trusts, or other ownership arrangements also rent out 92 million acres (about 10 percent of land in farms) to operators. Even though some agricultural land is owned by non-operating landlords, many of these landlords have prior farming experience. Of the 191 million acres owned in non-operator individual or partnership arrangements, nearly half were held by a retired farmer or rancher in 2014. About 6 percent of the acres owned in individual and partnership arrangements by non-operating landlord entities had a principal landlord that reported spending greater than 50 percent of their work time in farm or ranch work, but not as a farm operator. More information can be found on the ERS Farmland Ownership and Tenure topic page.
Friday, August 28, 2015
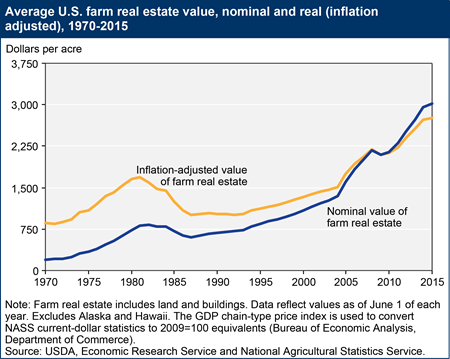
With a value of $2.38 trillion, farm real estate (land and structures) accounted for 81 percent of the total value of U.S. farm sector assets in 2014. Because it comprises such a significant portion of the U.S. farm sector’s asset base, change in the value of farm real estate is a critical barometer of the farm sector's financial performance. On average, U.S. (excluding Alaska and Hawaii) farm real estate values increased 2.4 percent (in nominal terms) to $3,020 per acre over the 12 months ending June 1, 2015. Growth in average values has slowed substantially relative to the previous three year mid-year to mid-year periods, when nominal farm real estate values increased over 8 percent annually. National averages mask wide regional variation. Based on nominal values, farm real estate in the Southern Plains and Pacific regions experienced the highest rates of appreciation of 6.1 percent and 5.8 percent (to $1,900 and $4,780 per acre), respectively, over the 12 months ending June 1, 2015. In contrast, farm real estate in the Corn Belt declined 0.3 percent (to $6,350 per acre). This chart is found on the ERS topic page on Land Use, Land Value & Tenure, updated August 2015.


