
Lower U.S. farm sector income and higher debt-to-asset ratios are forecast for 2016
- by Farm Income Team
- 3/14/2016
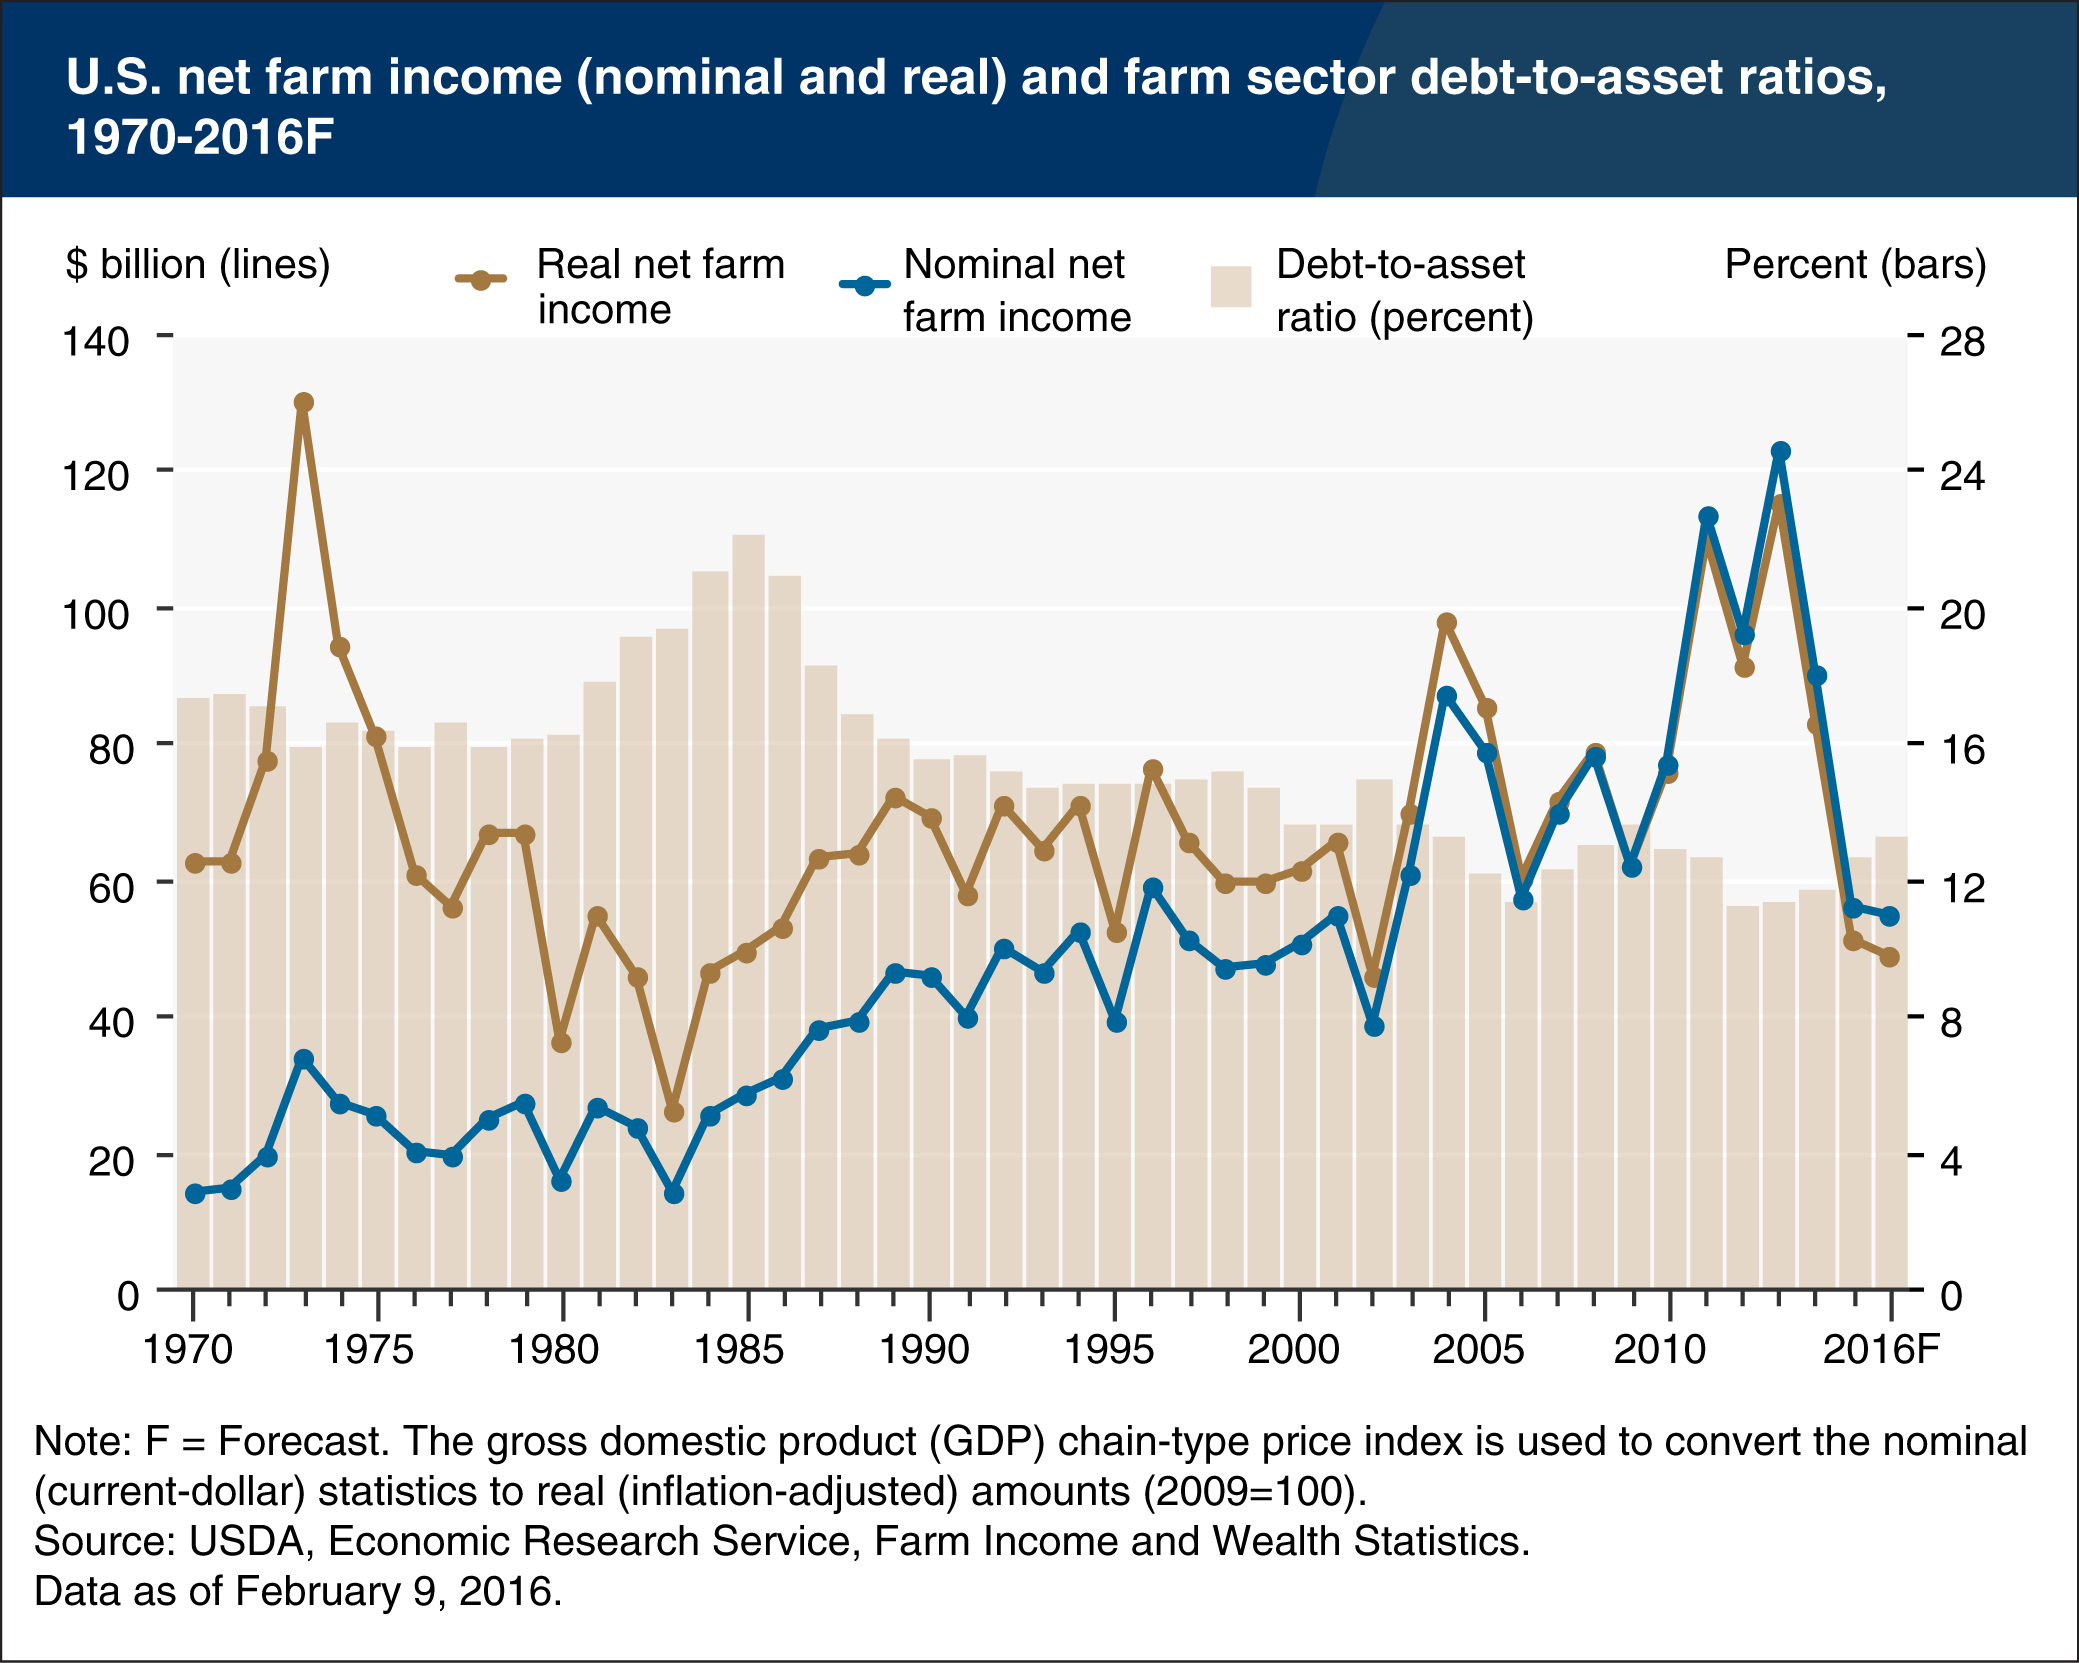
National net farm income, along with the farm-sector debt-to-asset ratio (which is a measure of solvency), provide indicators of the economic well-being of the U.S. farm sector. As of February 9, 2016, U.S. net farm income is forecast to fall to $54.8 billion in 2016 after recently peaking in 2013, due largely to declines in commodity prices. In inflation-adjusted terms, since 1970 only 5 years have registered lower net farm income. With the exception of 2002, all of those years were in the early 1980s, a time of great farm financial stress. The sector’s debt-to-asset ratio has edged up the past several years but at 13.2 percent remains well below the ratio’s 1985 peak. Recent inflation-adjusted debt levels are near, but have not exceeded, early 1980s levels. Thus, the improvement in farm-sector solvency has hinged on farm-sector asset values, which have roughly doubled since 1985 in inflation-adjusted terms. About 80 percent of the value of farm-sector assets are attributable to farm real estate, and both farm real-estate and nonreal-estate assets are expected to experience modest declines in 2015 and 2016. This chart is based on data found in Farm Income and Wealth Statistics, released February 2016.
We’d welcome your feedback!
Would you be willing to answer a few quick questions about your experience?