ERS Charts of Note
Subscribe to get highlights from our current and past research, Monday through Friday, or see our privacy policy.
Get the latest charts via email, or on our mobile app for  and
and 
Wednesday, December 5, 2012
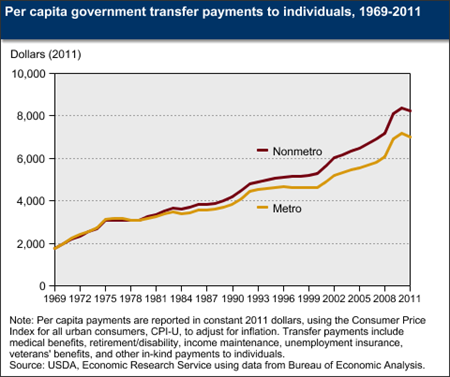
Government transfer payments comprise a large share of personal income for both nonmetro and metro residents. In 2011, transfer payments to individuals accounted for 24.8 percent of total personal income in nonmetro areas and 16.3 percent in metro areas. Per capita in 2011, nonmetro residents received more government transfers than metro residents: $8,236 vs. $7,022. Since 1978, nonmetro per capita transfer payments (adjusted for inflation) have risen faster than payments in metro areas. Most of this increase comes from the rising cost of government programs that provide medical benefits, such as Medicare and Medicaid. Because nonmetro areas have an older population and a higher proportion of persons with disabilities than metro areas, nonmetro areas receive more transfer payments. Between 2010 and 2011, per capita transfer payments fell, primarily due to a decline in unemployment insurance compensation, which fell 25 percent in both metro and nonmetro areas as benefits expired. This chart is found in the Rural Poverty & Well-being topic page on the ERS website, updated November 2012.
Monday, September 24, 2012
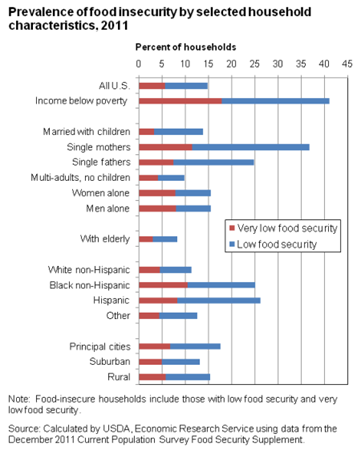
In 2011, 14.9 percent of all U.S. households were food insecure, meaning that they had difficulty at some time during the year providing enough food for all their members due to lack of resources. About 41 percent of households with incomes below the Federal poverty line were food insecure. Rates of food insecurity were substantially higher than the national average for single-parent households, as well as Black and Hispanic households. Food insecurity was more common in large cities and rural areas than in suburban areas and other outlying areas around large cities. Rates of very low food security--a more severe form of food insecurity--were higher for these demographic groups as well. The statistics for this chart are from Household Food Security in the United States in 2011, ERR-141, released on September 5, 2012.
Tuesday, July 24, 2012
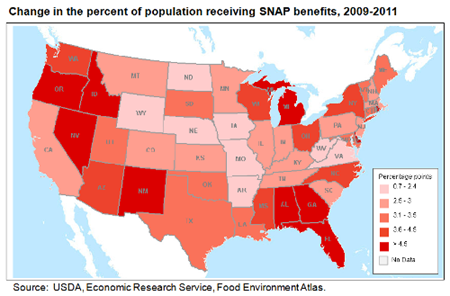
In 2011, nearly one in seven Americans (14.3 percent of the total population) lived in a household that received food assistance benefits from USDA's Supplemental Nutrition Assistance Program (SNAP). This represents a 3.4 percentage point increase from 2009 when 10.9 percent of Americans were receiving SNAP benefits. The rate of increase varied by State with 10 States, plus the District of Columbia, showing percentage point increases above 4.5 and 8 States with increases below 2.5. A combination of economic and policy factors account for differences among the States. All of the States with the slowest growth in SNAP caseloads had unemployment rates in May 2011 below the national average, and only two of them had enacted policies to expand program eligibility. In contrast, 8 of the 11 jurisdictions with the fastest growing SNAP caseloads had unemployment rates above the national average and all 11 had adopted policies raising SNAP income and/or asset eligibility cutoffs for many households. This chart is one of the new maps in ERS's Food Environment Atlas, updated on June 29, 2012. For more information on SNAP and other nutrition programs, visit the Food and Nutrition Assistance topic page on the ERS website.
Tuesday, July 17, 2012
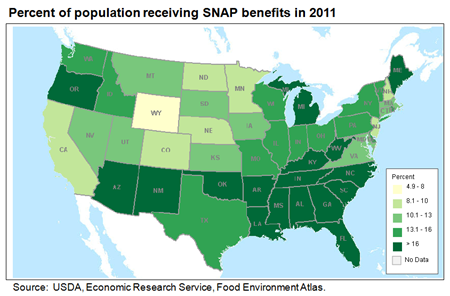
The Supplemental Nutrition Assistance Program (SNAP) is the cornerstone of USDA's nutrition assistance programs. The program accounted for 73 percent of all Federal food and nutrition spending in fiscal 2011, serving an average of 44.7 million people per month, or about 14 percent of Americans. The percent of the population receiving SNAP benefits to purchase food varies across States reflecting differences in need, as well as differences in program policies. The Southeast stands out as a region where all States have a high percent of residents receiving SNAP benefits, with participation rates of 16 to 21 percent. In 2011, 6.4 percent of Wyoming's population received SNAP benefits-the only State with less than 8 percent of the population receiving SNAP benefits. In 2009, there were 12 States with less than 8 percent of their populations participating in SNAP. This chart is one of the new maps in ERS's Food Environment Atlas, updated on June 29, 2012.
Tuesday, July 10, 2012
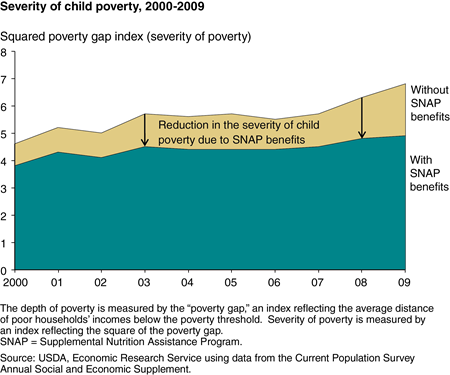
The poverty rate for children grew from 17.4 percent in 2006 to 20.7 percent in 2009, as many families' incomes fell during the 2007-09 recession. Official poverty estimates do not include non-cash assistance, such as benefits from USDA's Supplemental Nutrition Assistance Program (SNAP), as income. A recent ERS study found that including SNAP benefits in family income would have lowered the poverty rate for children to 18.7 percent in 2009. SNAP benefits also ensured that the severity of child poverty increased only slightly from 2006 to 2009 despite worsening economic conditions. Severity of poverty was measured using an index that reflects the square of the poverty gap, defined as the average distance of poor families' incomes below the poverty threshold. Without SNAP, the severity measure would have increased from 5.5 in 2006 to 6.8 in 2009, an increase of almost 24 percent. With SNAP benefits, severity rose by only 11 percent. This chart appeared in "SNAP Benefits Alleviate the Incidence and Intensity of Poverty" in the June 2012 issue of ERS's Amber Waves magazine.
Wednesday, September 14, 2011
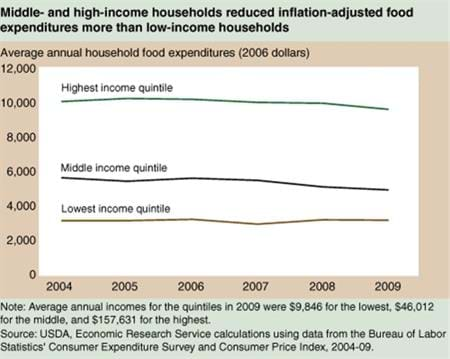
During the 2007-09 recession, inflation-adjusted food spending by U.S. households fell 5 percent-the largest decrease in at least 25 years. Spending patterns differed by income level, with middle-income households curbing expenditures the most. Households in the middle quintile of income decreased their inflation-adjusted food expenditures by 12.5 percent from 2006 to 2009. Households in the lowest quintile cut spending 1.8 percent, while the highest quintile reduced food spending 5.7 percent. This chart appeared in the September 2011 issue of Amber Waves magazine.
Tuesday, August 16, 2011
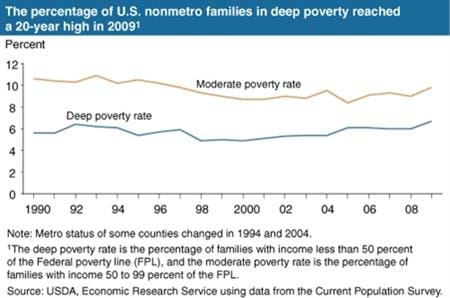
The 2007-09 recession was particularly severe in the depth of poverty it engendered. The number of nonmetro residents living in poverty increased more than 8 percent between 2007 and 2009 to 8.1 million (a 16.6-percent poverty rate). Of these, an estimated 3.3 million (6.7 percent of the nonmetro population) were in deep poverty in 2009, up nearly 13 percent from 2007. The number of nonmetro residents living in poverty rose markedly in the previous two recessions as well (as measured by 1989-91 and 2000-02 annual data). Yet, the change in the deep poverty count was substantially higher during the 2007-09 recession. This chart appeared in the June 2011 issue of Amber Waves magazine.
Monday, March 14, 2011
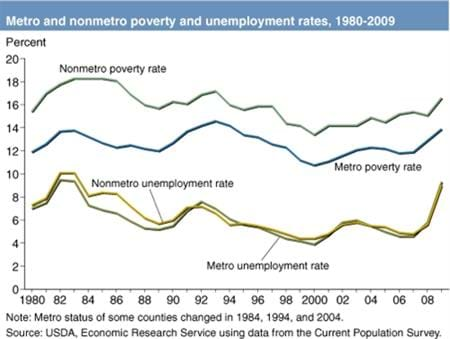
Historically, poverty grows during recessionary periods as a result of job losses, difficulty finding new work, and reductions in work hours or wages. This is evident in both nonmetro and metro poverty rates, which follow the same trends as unemployment over time. The dramatic increase in unemployment during the 2007-09 recession is tied to growth in the number of nonmetro residents living in poverty. In 2009, the nonmetro unemployment rate was 9.0 percent, which represents a 3.4-point increase from 2008. This is the largest annual increase in unemployment in more than 35 years. The percent of the population living in nonmetro areas that were poor in 2009 was 16.6 percent, compared with 15.1 percent in 2008. This is the most significant year-to-year increase in nonmetro poverty since the early 1980s recession. This chart is from the December 2010 issue of Amber Waves.


