

SNAP participation up more in some States than others
- by Economic Research Service
- 7/24/2012
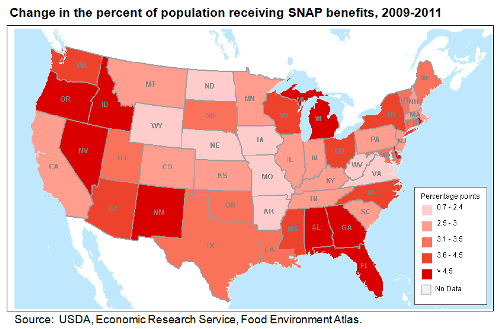
In 2011, nearly one in seven Americans (14.3 percent of the total population) lived in a household that received food assistance benefits from USDA's Supplemental Nutrition Assistance Program (SNAP). This represents a 3.4 percentage point increase from 2009 when 10.9 percent of Americans were receiving SNAP benefits. The rate of increase varied by State with 10 States, plus the District of Columbia, showing percentage point increases above 4.5 and 8 States with increases below 2.5. A combination of economic and policy factors account for differences among the States. All of the States with the slowest growth in SNAP caseloads had unemployment rates in May 2011 below the national average, and only two of them had enacted policies to expand program eligibility. In contrast, 8 of the 11 jurisdictions with the fastest growing SNAP caseloads had unemployment rates above the national average and all 11 had adopted policies raising SNAP income and/or asset eligibility cutoffs for many households. This chart is one of the new maps in ERS's Food Environment Atlas, updated on June 29, 2012. For more information on SNAP and other nutrition programs, visit the Food and Nutrition Assistance topic page on the ERS website.