
Food insufficiency in mid-June 2020 higher in some States than others
- by Christian A. Gregory and Alana Rhone
- 7/10/2020
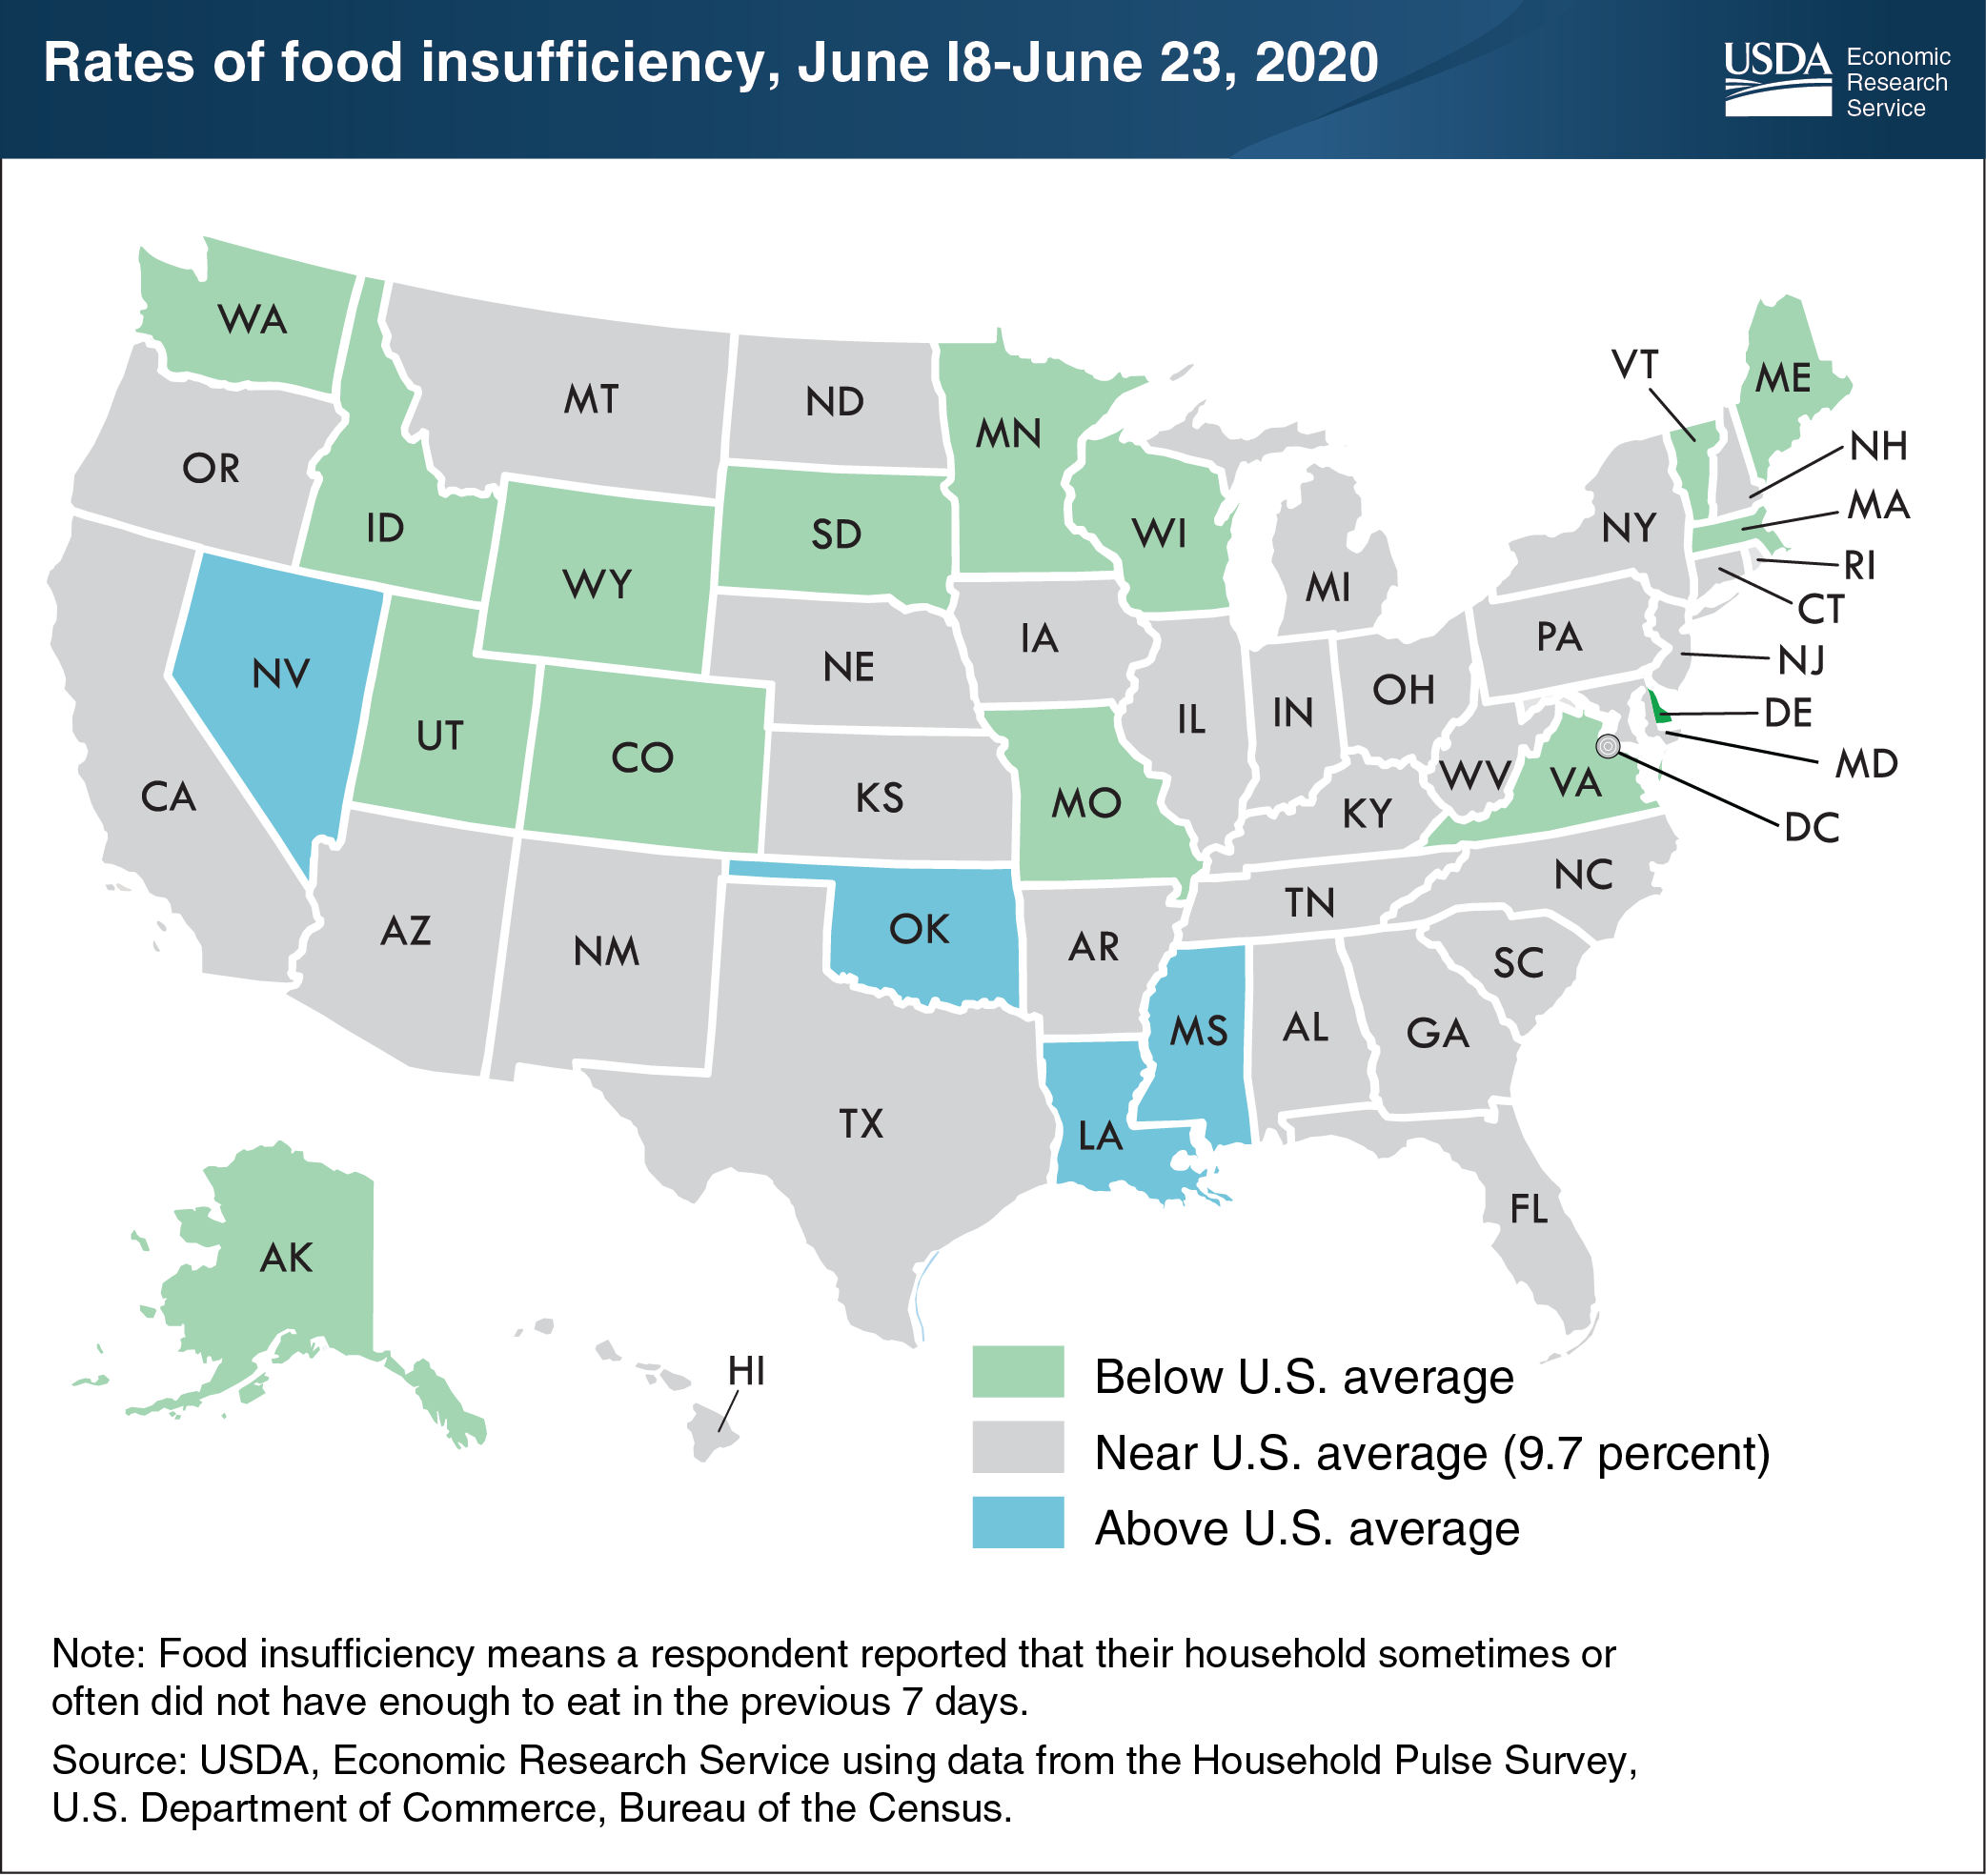
To keep track of the rapid changes in the U.S. economic landscape due to COVID-19, researchers at the Economic Research Service (ERS)—along with those at five other Federal agencies—teamed up with the Census Bureau to produce the Household Pulse Survey, a weekly, online data collection that asks respondents about their current educational, employment, health, housing, and food-related situations. The survey began in the week of April 23, 2020 and will continue until the end of July 2020. ERS researchers used the most recent data available from the new survey (June 18–June 23) to examine food sufficiency for U.S. households. Food sufficiency is distinct but related to food security: like USDA’s food security measure, it can tell us about disruptions in the quantity of foods consumed in a household. Households were classified as being "food insufficient" if they sometimes or often in the last 7 days reported not having enough to eat. Food insufficiency is comparable to the classification of “very low food security” used in USDA’s annual assessments of food security. Nationally, 9.7 percent of U.S. households were food insufficient that week, similar to the 9.8-percent U.S. average during April 23–May 5. Fifteen States had food insufficiency rates below 9.7 percent and 4 States had rates above this national average. The remaining 31 States and the District of Columbia had rates of food insufficiency statistically comparable to the national average. According to USDA’s latest food security statistics, an estimated 4.3 percent of U.S. households experienced very low food security at some time during 2018 where the food intake of some household members was reduced and normal eating patterns were disrupted due to a lack of money or other resources. The data for this chart are drawn from the Census Household Pulse Survey. For more information on ERS’s food security research, see the Food Security in the U.S. topic page on the ERS website.