
Eating-out expenditures in March 2020 were 28 percent below March 2019 expenditures
- by Eliana Zeballos and Wilson Sinclair
- 6/5/2020
Errata: On July 22, 2020, this Chart of Note was reposted with corrected data for February 2020 and March 2020.
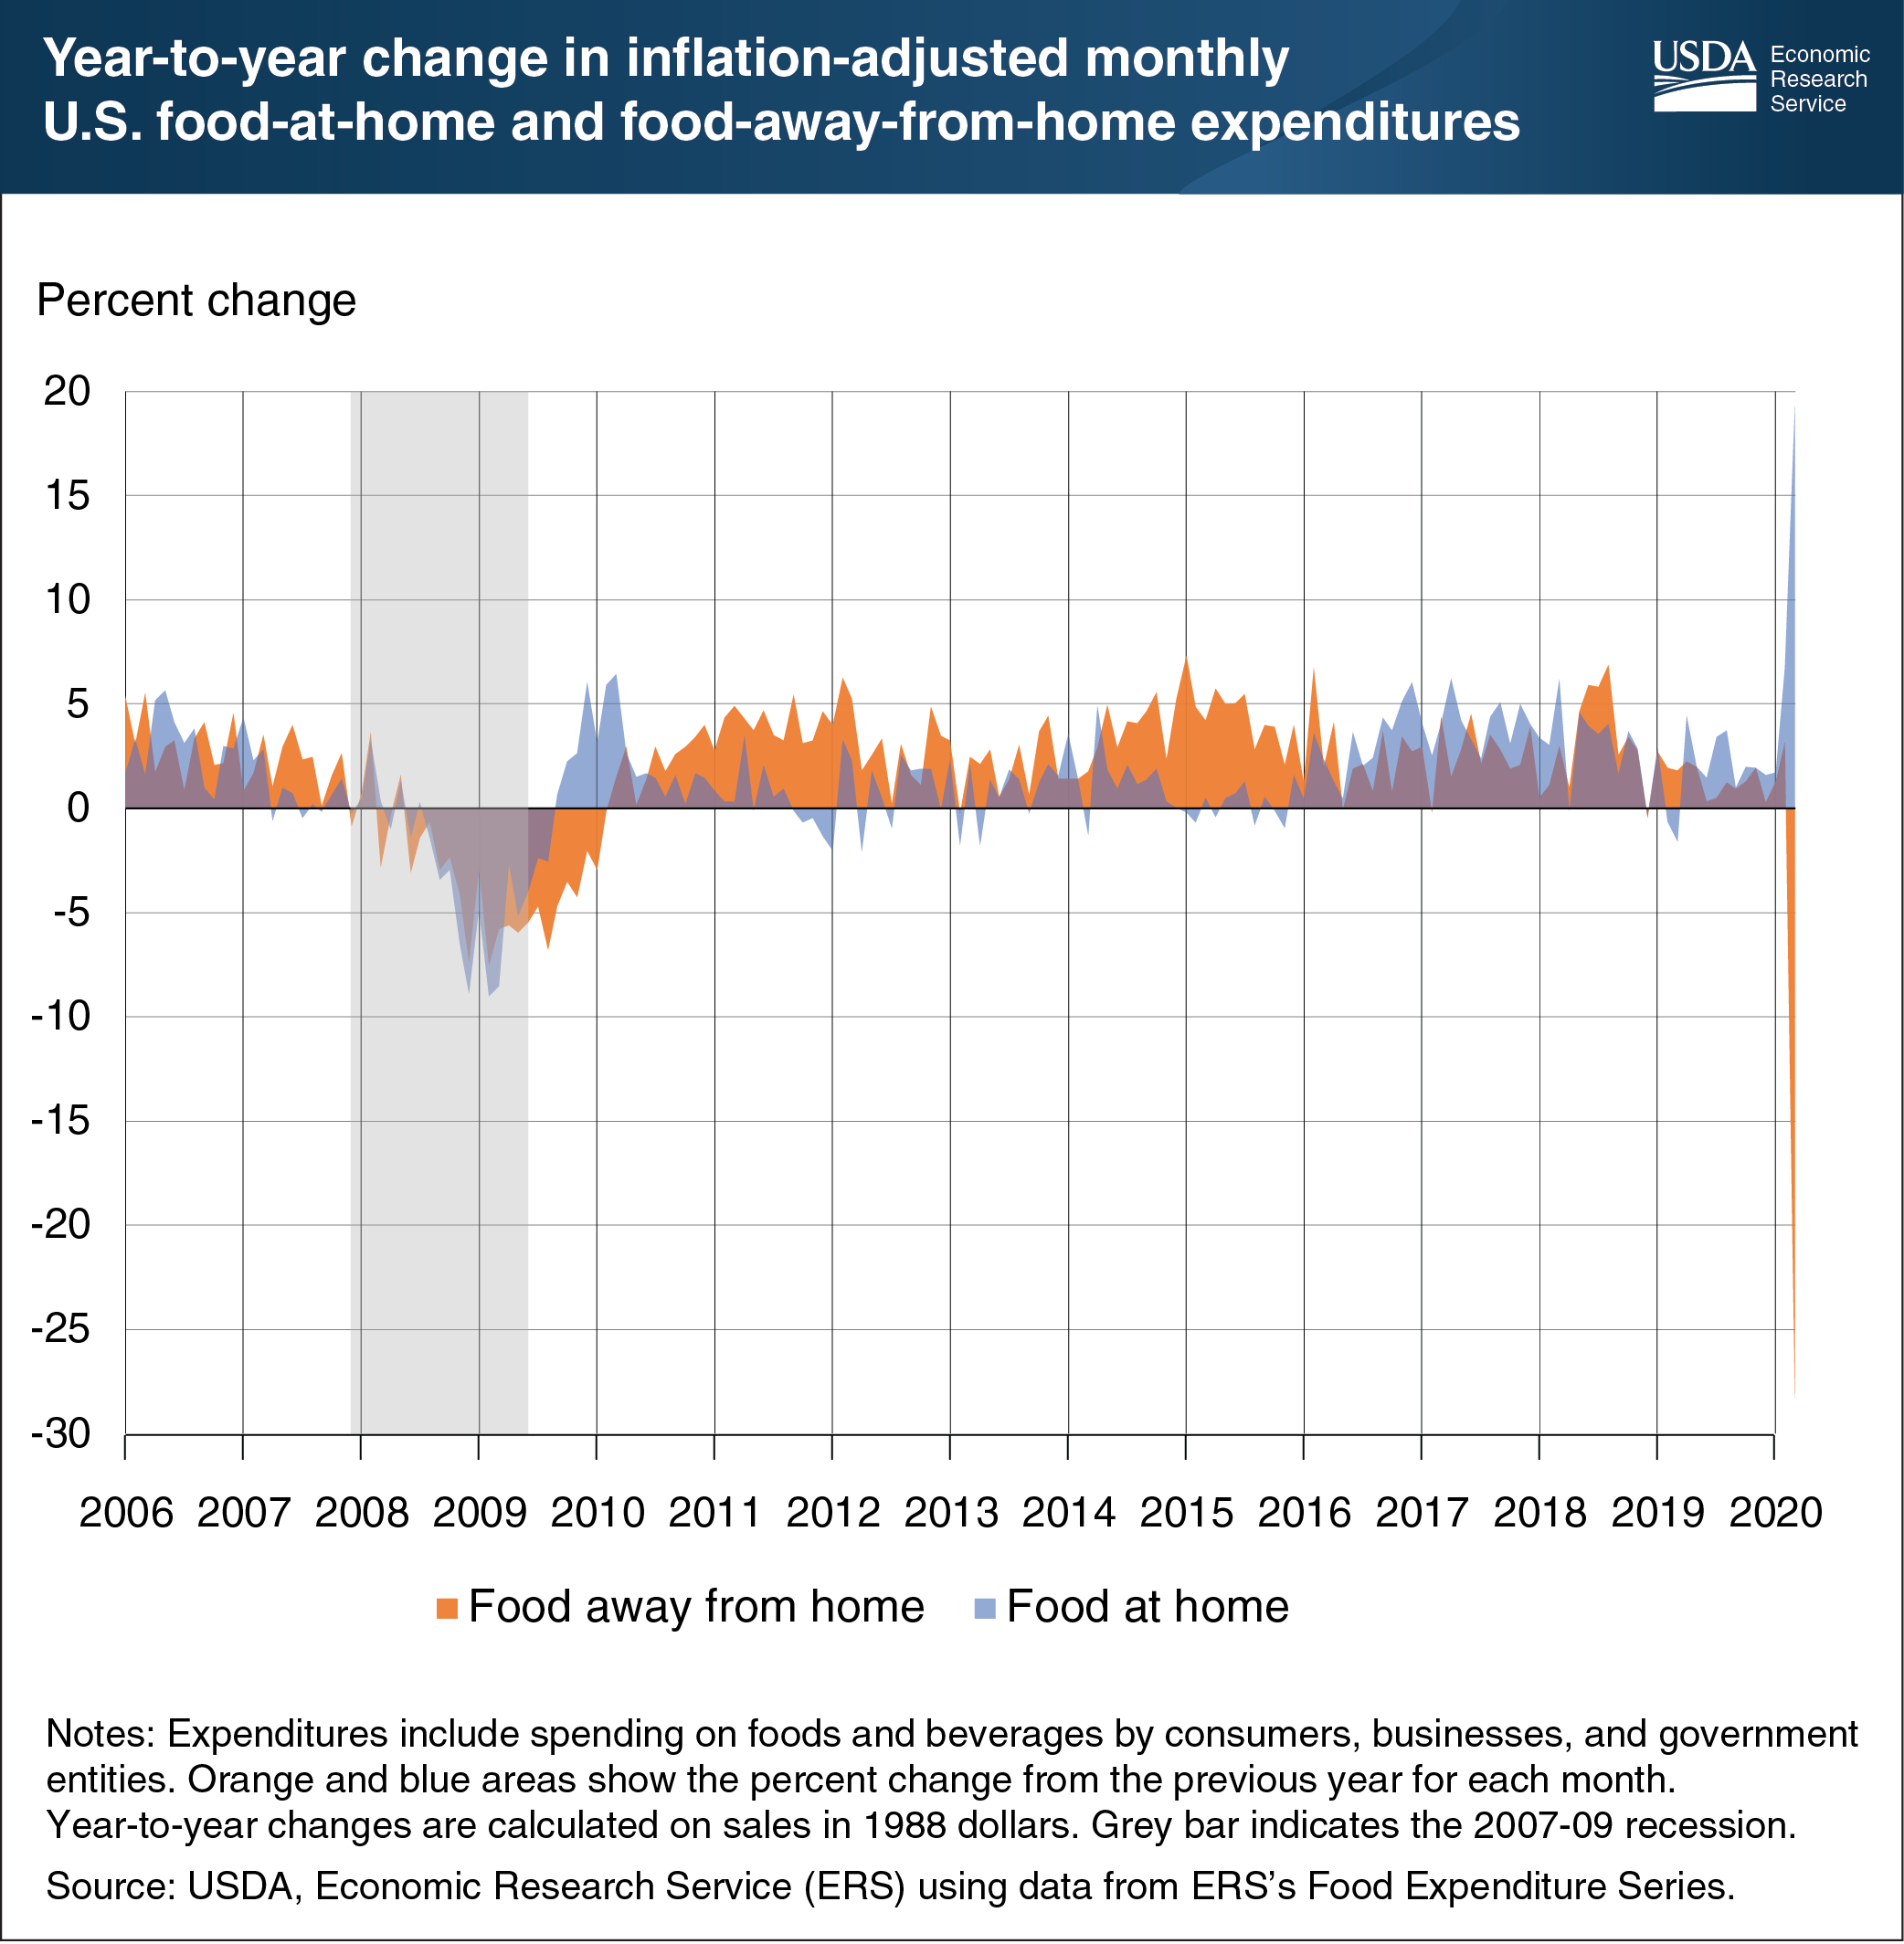
The COVID-19 pandemic and resulting stay-at-home orders have dramatically impacted Americans’ food spending. Inflation-adjusted expenditures at grocery stores, supercenters, convenience stores, and other retailers (food at home) were 6.7 percent higher in February 2020 compared with February 2019. This same spending was 19.3 percent higher in March 2020 compared with March 2019. Comparing spending for the same month accounts for seasonal food spending patterns. Inflation-adjusted February 2020 expenditures at eating-out establishments—restaurants, school cafeterias, sports venues, and other eating-out places—were 3.1 percent higher than February 2019 expenditures. March 2020 food-away-from-home spending was 28.3 percent lower than March 2019 spending. During the Great Recession of 2007-09, expenditures on both food at home and food away from home decreased, with the largest decrease in February 2009. Unlike previous economic shocks, the COVID-19 shock has led to a pronounced substitution from food away from home towards food at home. This substitution is in part due to the stay-at-home orders and the fact that many eating-out businesses are operating at a limited capacity or have ceased operations completely. The data in this chart are from the Economic Research Service’s Food Expenditure Series data product, updated June 2, 2020.