
Per capita sweetener deliveries show steady downturn largely due to reduced demand for high fructose corn syrup
- by Michael J. McConnell and Utpal Vasavada
- 10/7/2019
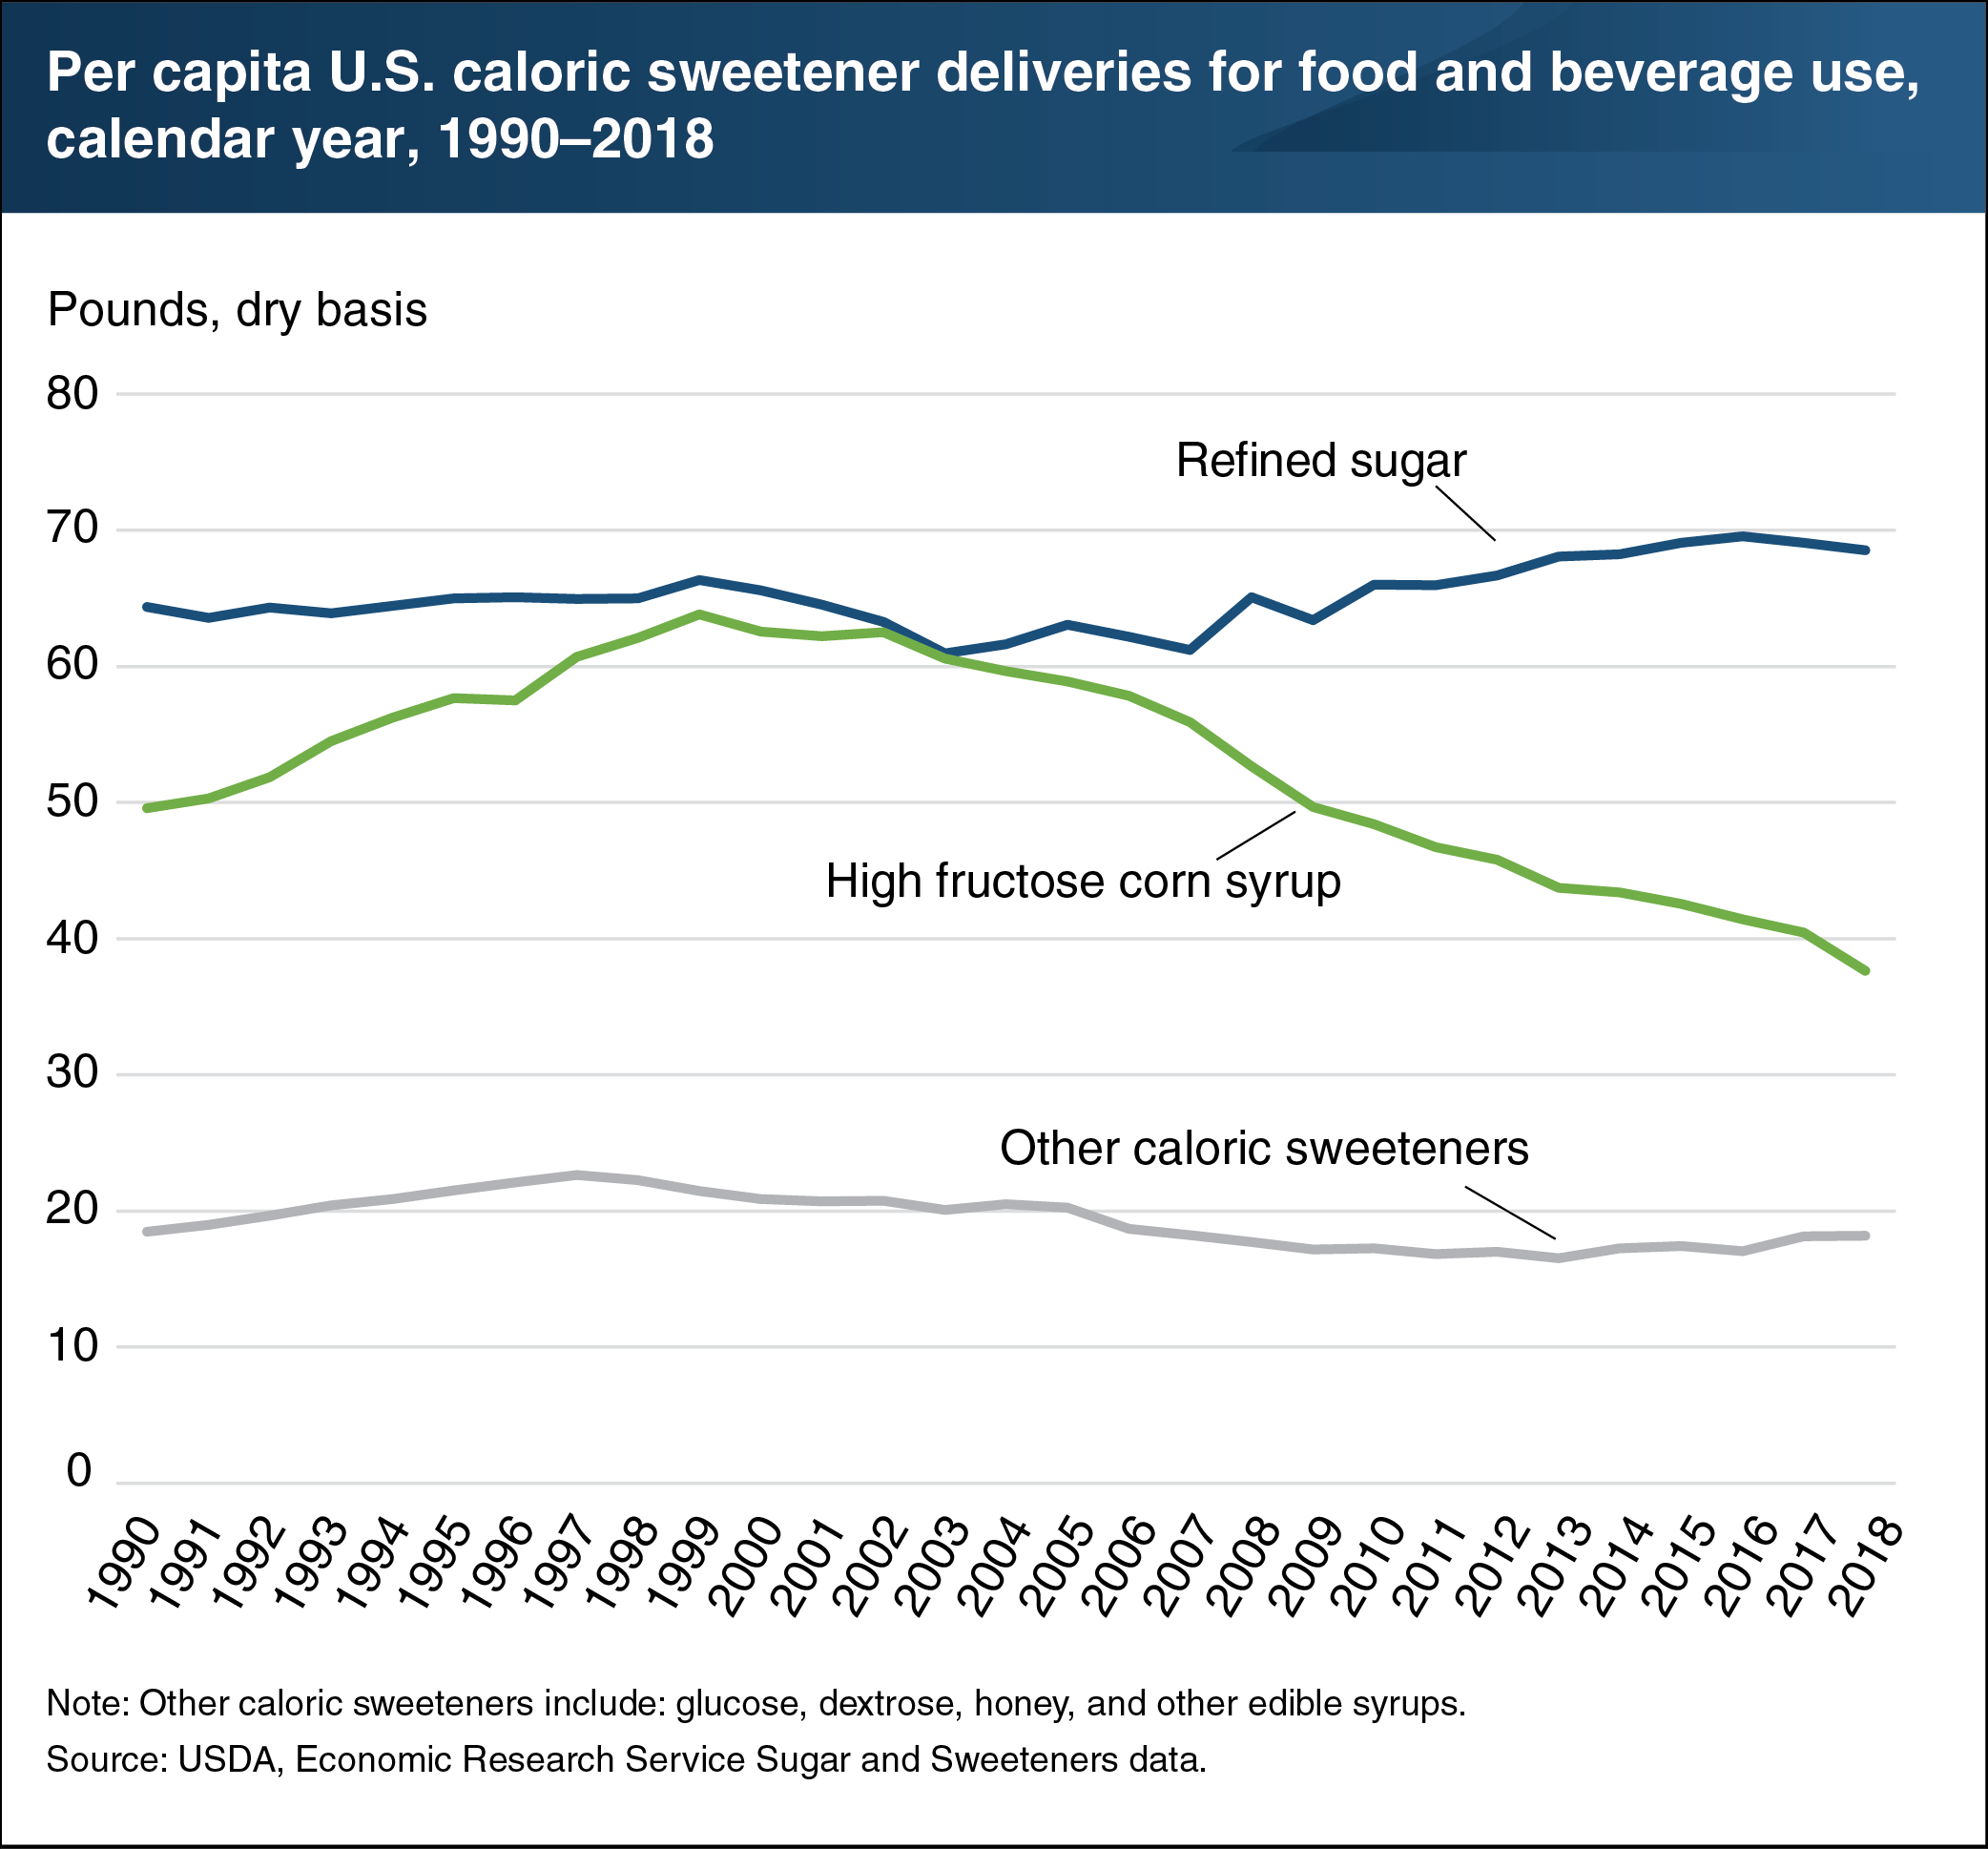
Total caloric sweetener deliveries in the United States in 2018 totaled over 40.7 billion pounds (124.4 pounds per person) on a dry weight basis (water content removed), down 2 percent from 2017. The refined sugar share of per capita deliveries continues to rise as the corn-based sweeteners share, particularly high-fructose corn syrup (HFCS), has trended downward since the early 2000s. On a per person basis, deliveries of HFCS have fallen 40 percent since 2000, while refined sugar increased by 5 percent over the same period. This period coincided with higher input prices from global commodity price spikes; growth of corn-based domestic ethanol production; increased availability of sugar supplies because of increased imports from Mexico; and greater attention to food labels by food manufacturers and consumers. Nonetheless, per capita refined sugar deliveries have declined slightly since 2016, suggesting a broader decline in caloric sweetener demand. Other caloric sweeteners, such as the corn sweeteners dextrose and glucose, honey, maple syrup, molasses syrups, and fructose syrups, make up a relatively minor share of total deliveries. This chart appears in the ERS Sugar and Sweeteners Outlook newsletter released in August 2017.