
Distance to a food store and access to vehicles both play roles in food access
- by Alana Rhone
- 8/5/2019
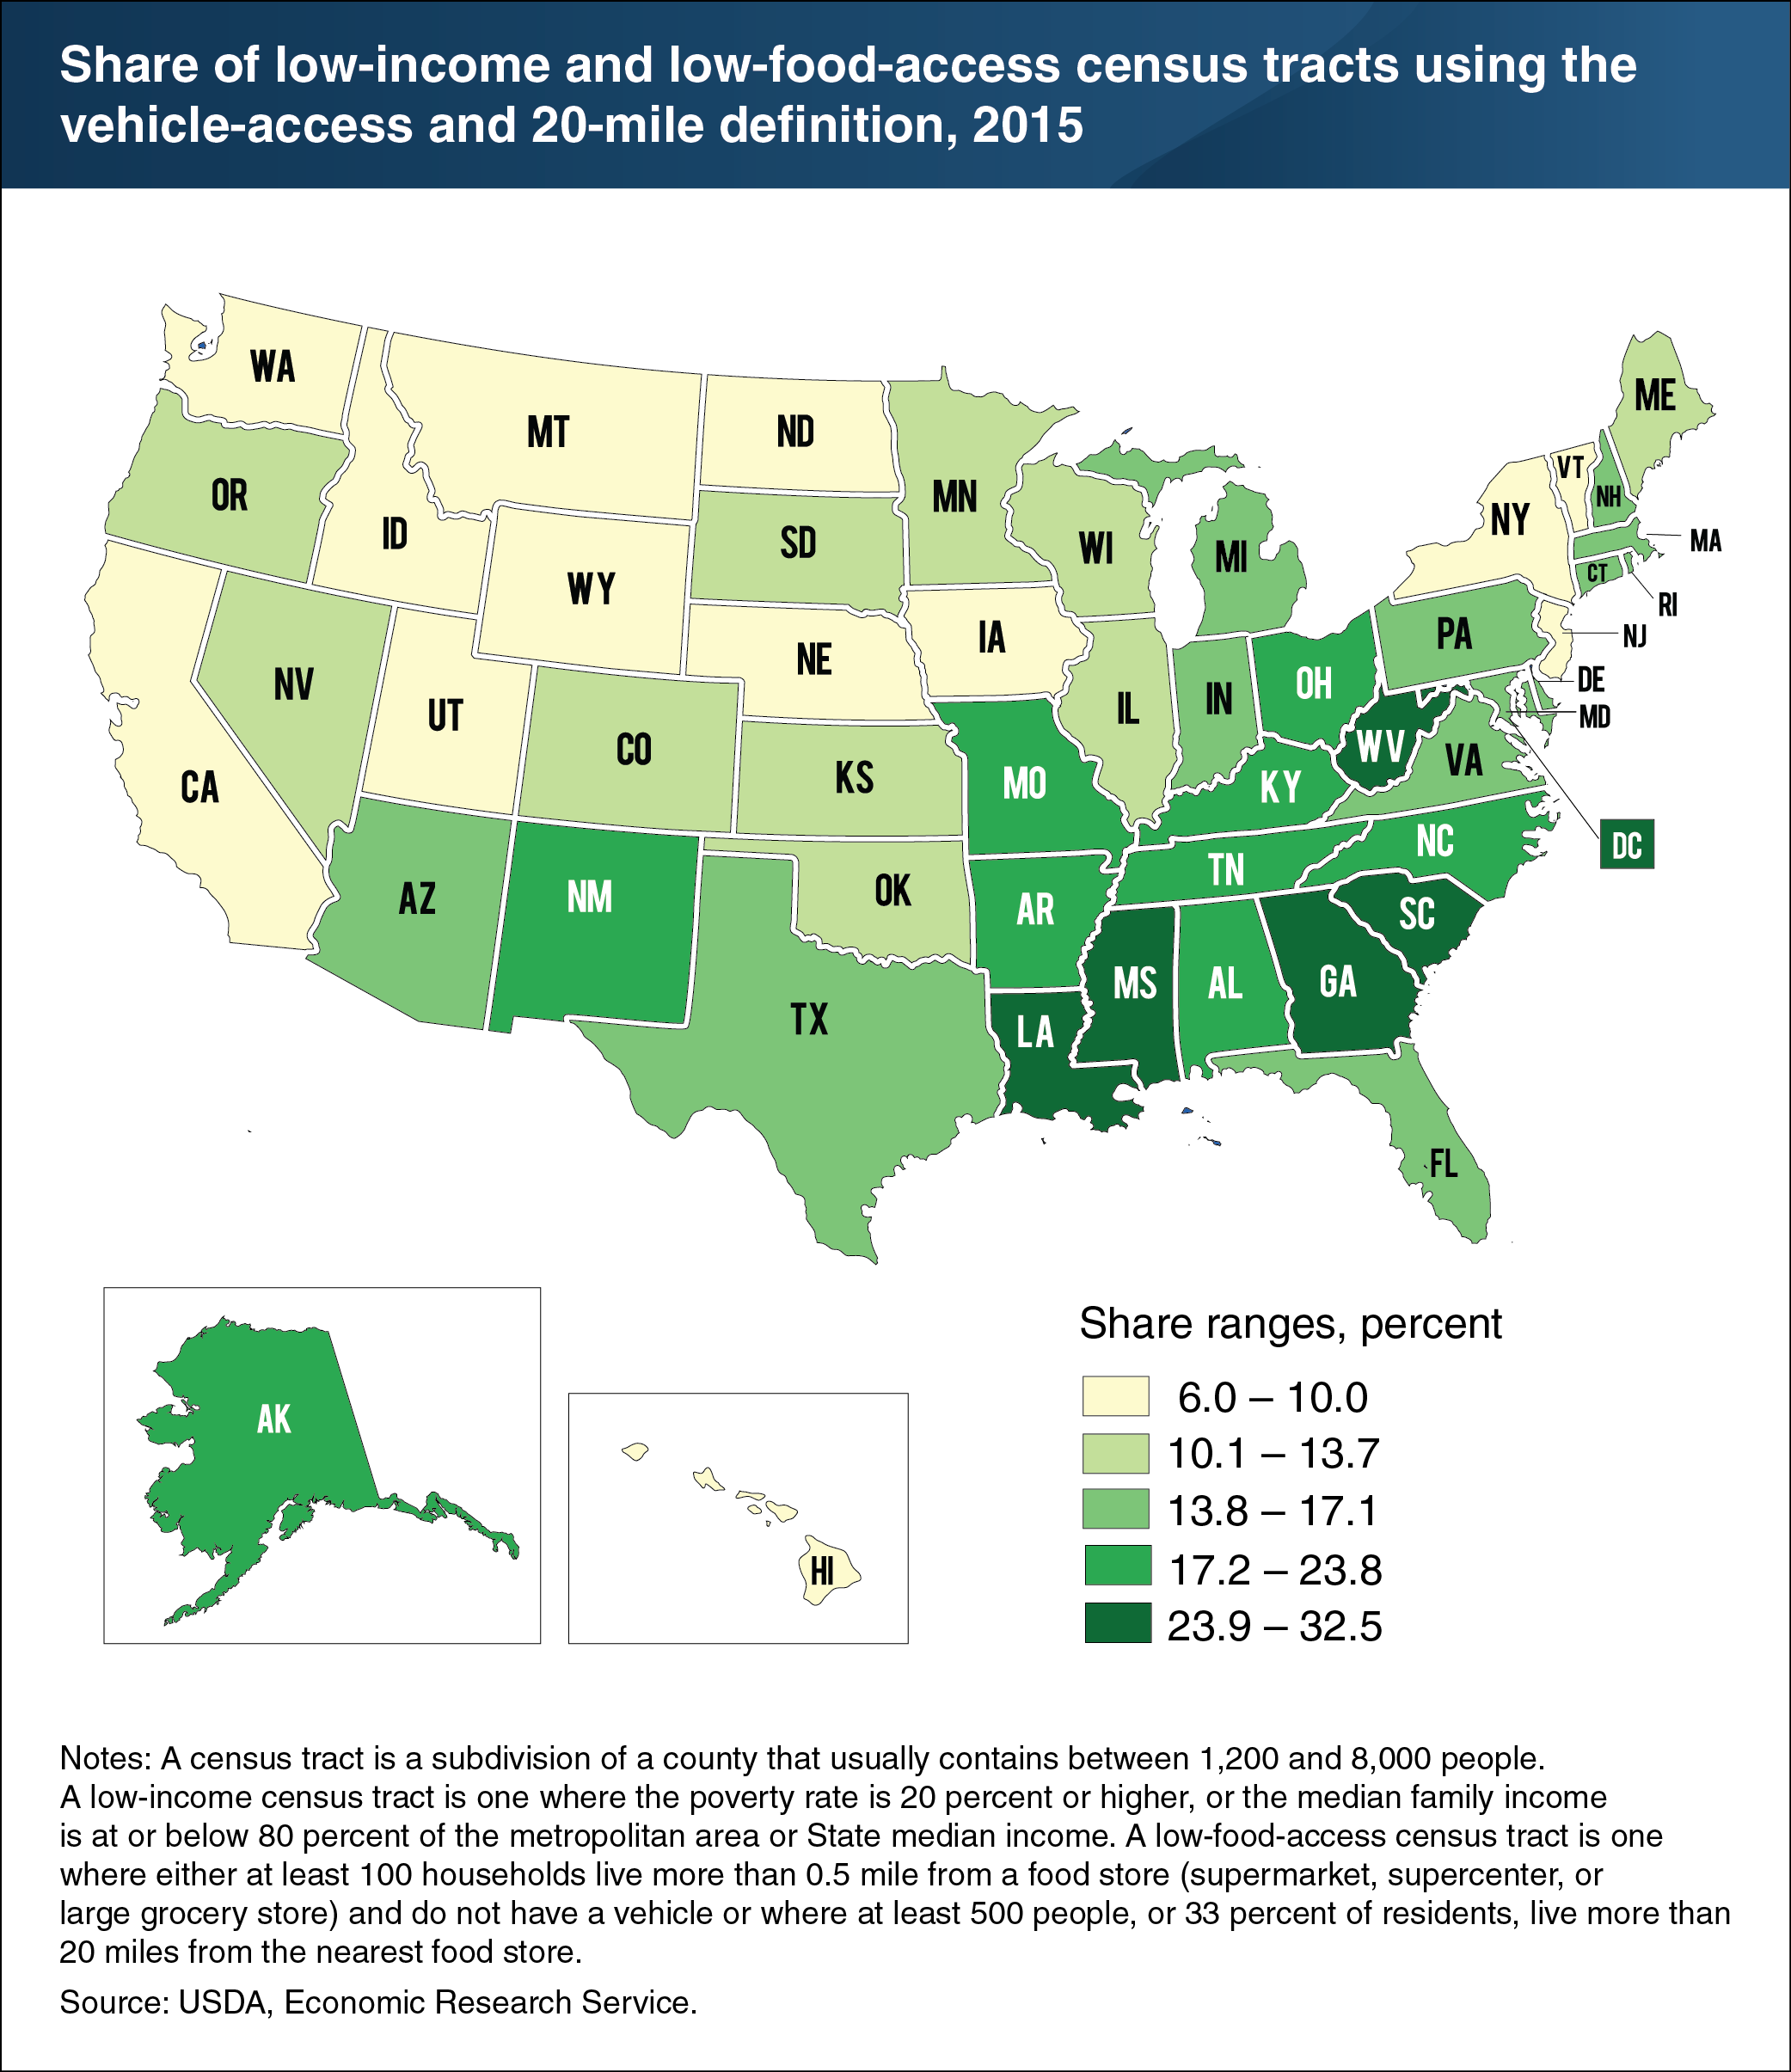
Limited access to the healthy and affordable foods stocked in supermarkets, supercenters, and large grocery stores may impede some Americans from achieving a healthy diet. How far someone lives from these food stores and whether the shopper has access to a vehicle are important components of food access. ERS researchers identified low-income census tracts in 2015 that also had low food access based on distance to a supermarket, supercenter, or large grocery store and access to a vehicle. (See chart note for definitions of low income and low food access.) In 2015, five States (Mississippi, South Carolina, Louisiana, Georgia, and West Virginia) and the District of Columbia had the highest shares of low-income/low-food-access census tracts (more than 24 percent of each State’s total tracts) using the ERS measure. Vermont and Hawaii had the lowest shares of low-income/low-food-access tracts—6.0 percent and 6.7 percent, respectively. This chart appears in the ERS report, Understanding Low-Income and Low-Access Census Tracts Across the Nation: Subnational and Subpopulation Estimates of Access to Healthy Food, May 2019.