
Number of U.S. fast food restaurants grew by 9 percent between 2009 and 2014
- by Alana Rhone
- 12/19/2017
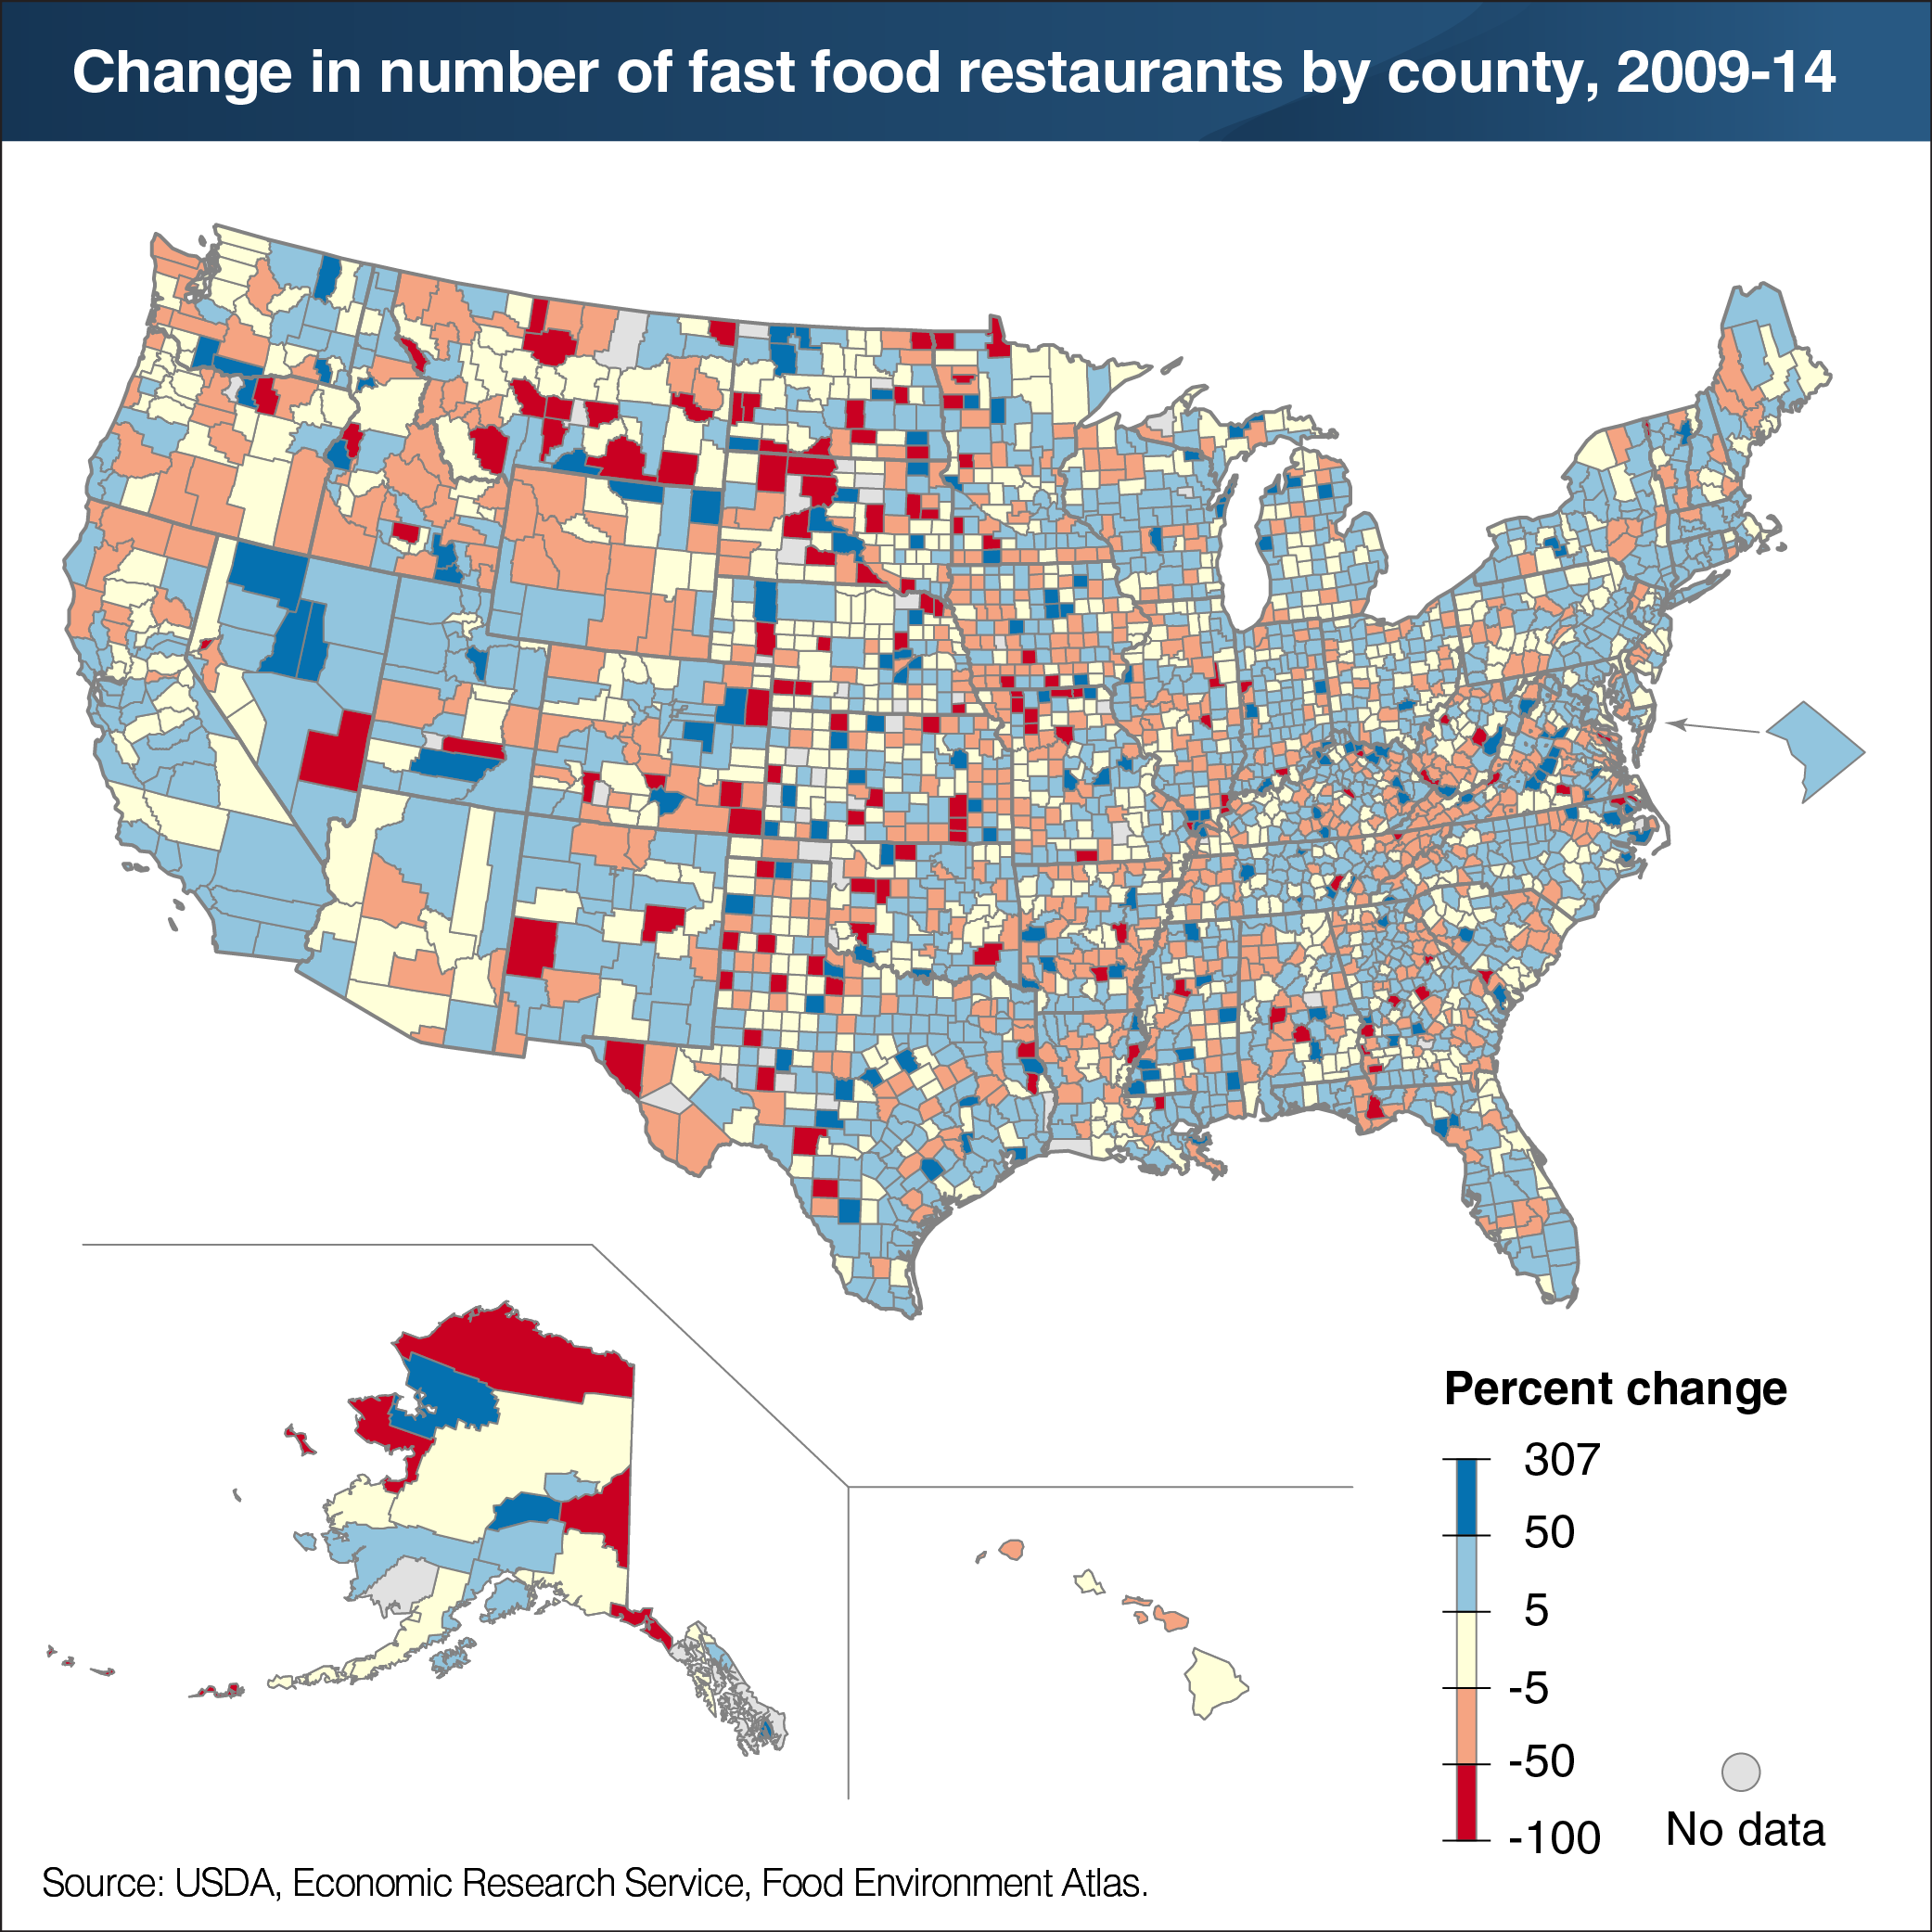
People’s access to both grocery stores and eating out places may influence their food choices and diet quality. Easy-to-access retailers and restaurants that sell less healthy foods may lead to greater consumption of these foods. Data from ERS’s Food Environment Atlas show that the number of fast food restaurants in the United States—establishments where customers generally order or select foods and pay before eating—grew from 210,692 in 2009 to 228,677 in 2014. Part of this 9-percent growth reflects the growing popularity of more upscale chains featuring soups, sandwiches, or ethnic foods. The U.S. county with the largest increase in new fast food restaurants was Los Angeles County, California, followed by Cook County, Illinois. Los Angeles County added 680 new fast food restaurants (a 10-percent increase) from 2009 to 2014, and Cook County added 426 new fast food restaurants (an 11-percent jump). Between 2009 and 2014, 163 U.S. counties saw more than 50 percent growth in fast food restaurants. This map appears in "ERS’s Updated Food Environment Atlas Shows an Increase in Fast Food Restaurants Between 2009 and 2014" in the December 2017 issue of ERS’s Amber Waves magazine.