
Per capita sweetener deliveries steadily declining due to reduced high fructose corn syrup demand
- by Michael J. McConnell
- 9/26/2017
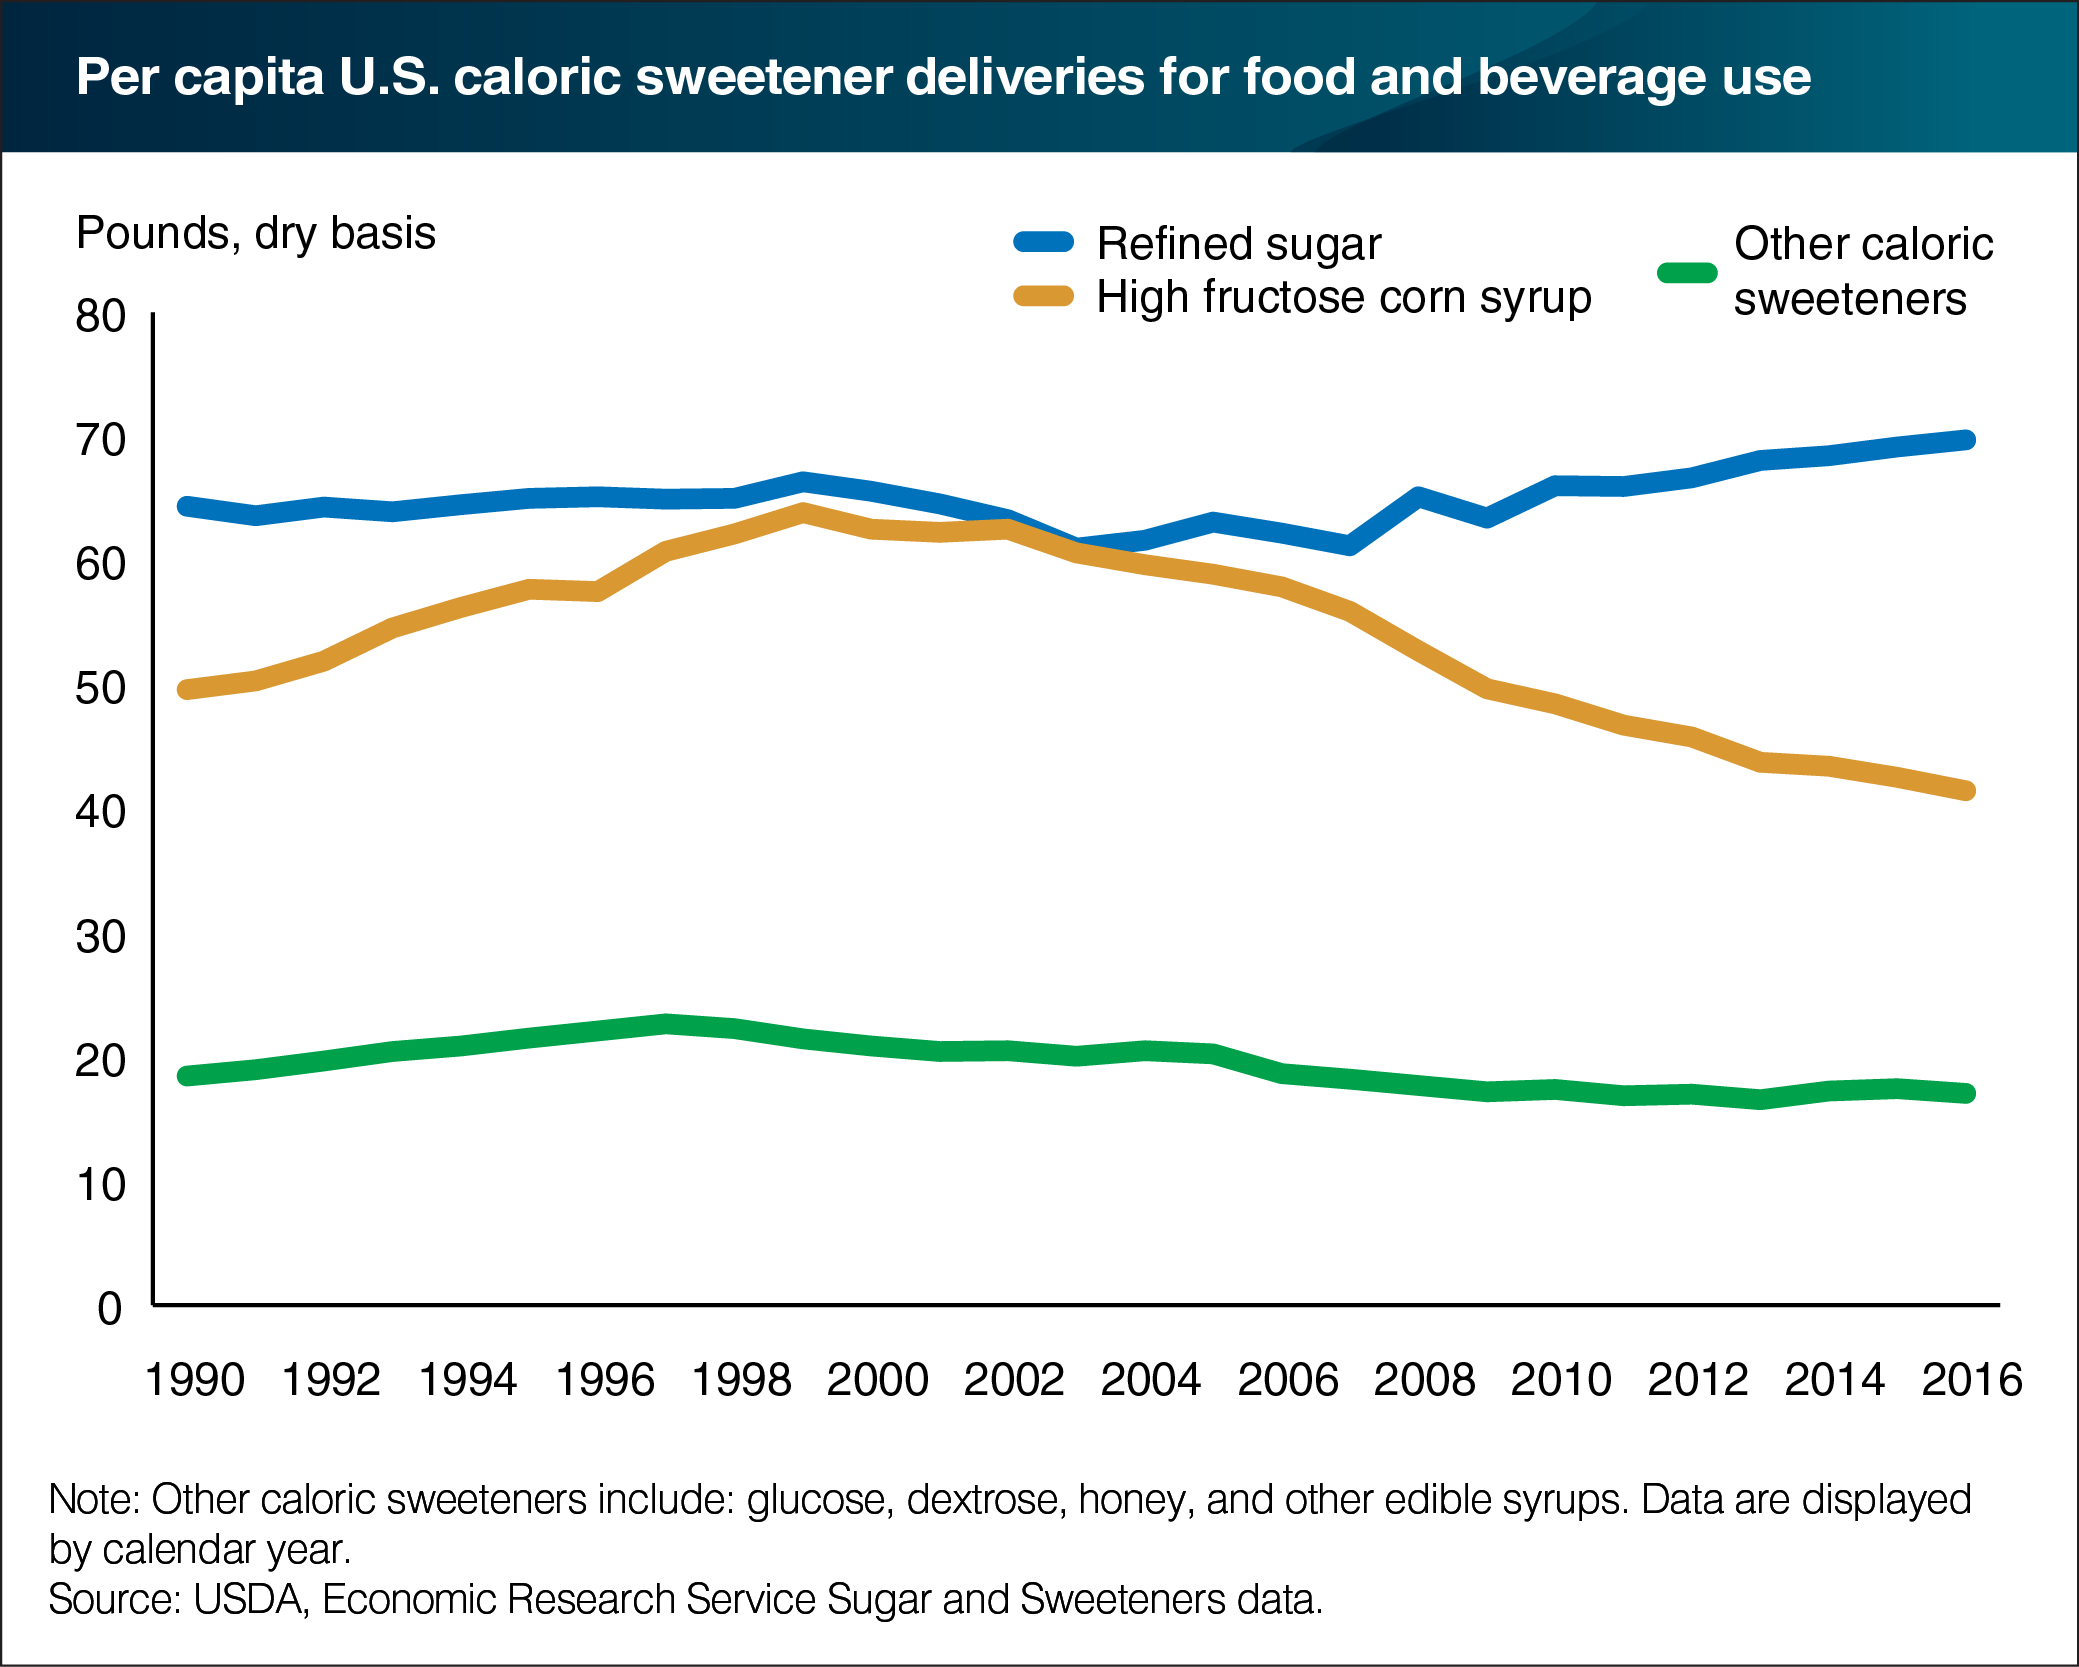
Total caloric sweetener deliveries in 2016 totaled over 41 billion pounds on a dry weight basis (water content removed), down marginally from 2015. This translates to 128.1 pounds per person, a 0.7-percent decline from the previous year. Refined sugar continues to make an increasing share of per capita deliveries as corn-based sweeteners, particularly high-fructose corn syrup (HFCS), has trended downward since the early 2000s. On a per person basis, deliveries of HFCS have fallen 34 percent since 2000, while refined sugar increased by 6 percent over the same period. This period coincided with higher input prices from global commodity price spikes; the growth of the corn-based domestic ethanol production; increased availability of sugar supplies because of increased imports from Mexico; and greater attention to food labels by food manufacturers and consumers. Other caloric sweeteners, such as the corn sweeteners dextrose and glucose, honey, maple syrup, molasses syrups, and fructose syrups, make up a relatively minor share of total deliveries. This chart appears in the ERS Sugar and Sweeteners Outlook newsletter, released in August 2017.