
U.S. farm sector income forecasts down for 2016, led by lower animal/animal products receipts
- by Farm Income Team
- 11/30/2016
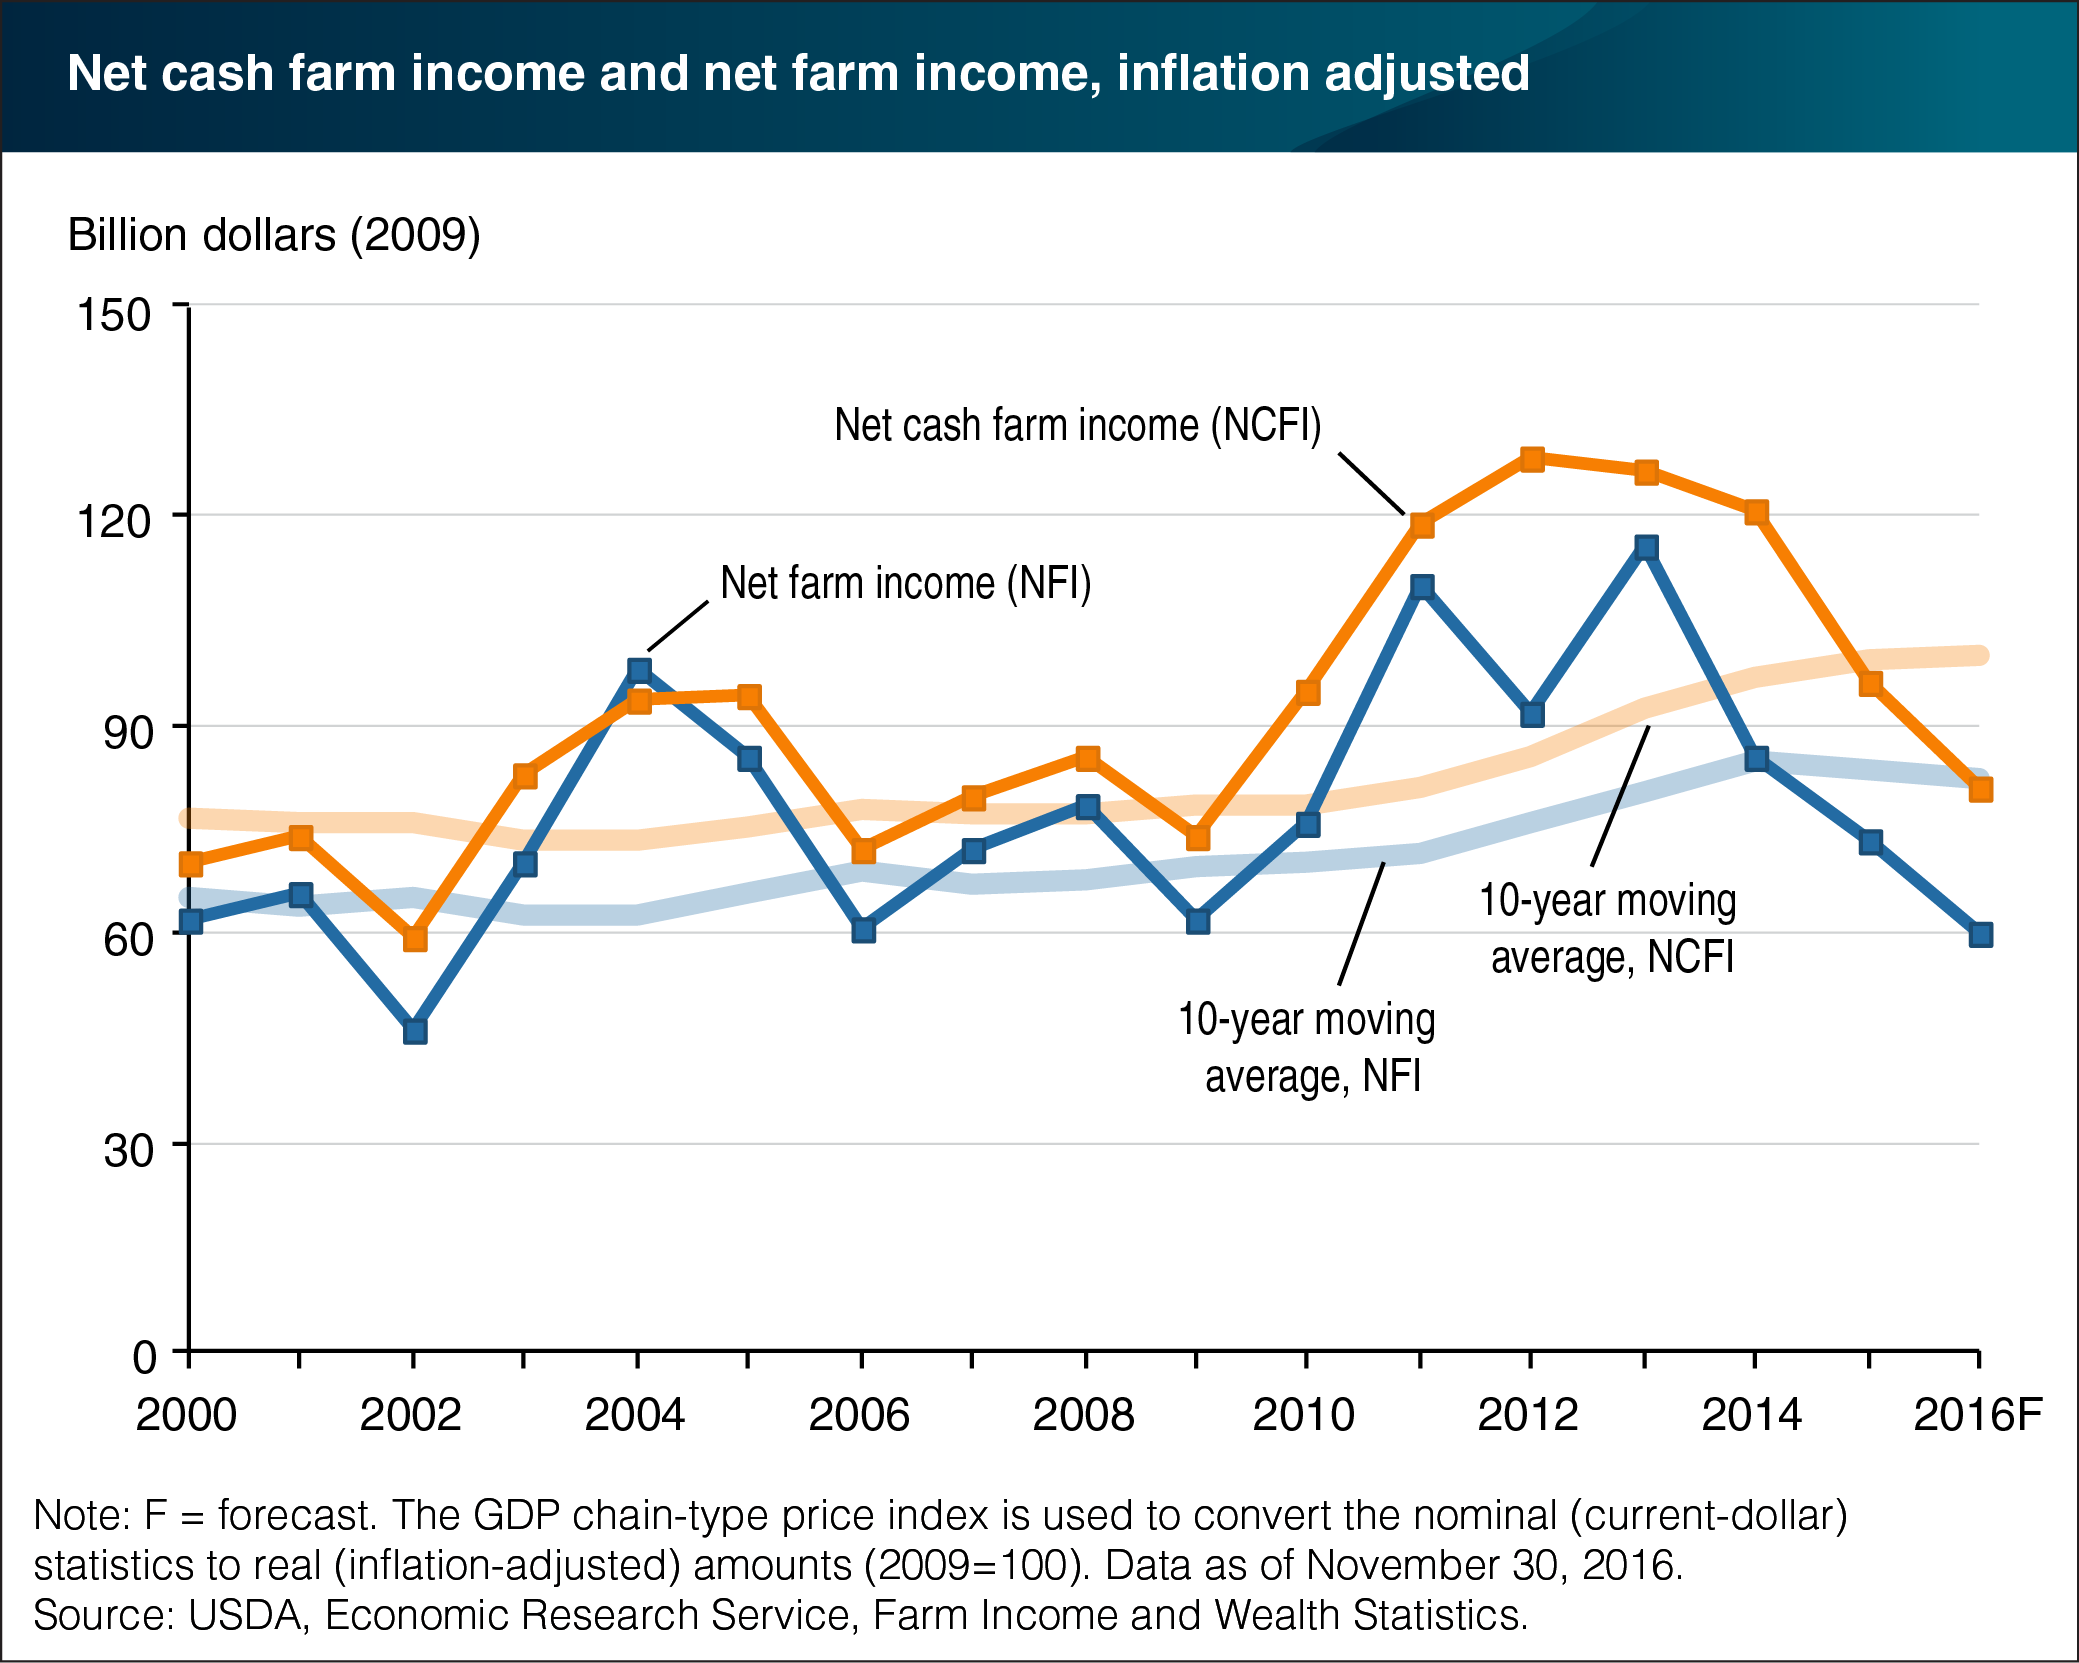
Net cash farm income and net farm income are two conventionally used and related measures of farm sector profitability. The first measure includes cash receipts, government payments, and other farm-related cash income net of cash expenses, while the second is more comprehensive and incorporates noncash transactions such as implicit rents, changes in inventories, and economic depreciation. Following several years of high income, both measures have trended downward since 2013. ERS forecasts that net cash farm and net farm income for 2016 will be $90.1 billion and $66.9 billion, respectively, or $80.9 billion and $60.1 billion, respectively, when adjusted for inflation (in 2009 dollars). Cash receipts declined across a broad set of agricultural commodities in 2015, and are expected to fall further in 2016—primarily for animal/animal products. Production expenses are forecast to contract in 2016, but not enough to offset the commodity price declines. Net cash farm and net farm income are below their 10-year averages, which include surging crop and animal/animal product cash receipts from 2010 to 2013. Find additional information and analysis in ERS’ Farm Sector Income and Finances topic page, updated November 30, 2016.
We’d welcome your feedback!
Would you be willing to answer a few quick questions about your experience?