
Imports used by the U.S. food system totaled $76.6 billion in 2013
- by Sarah Rehkamp
- 7/29/2015
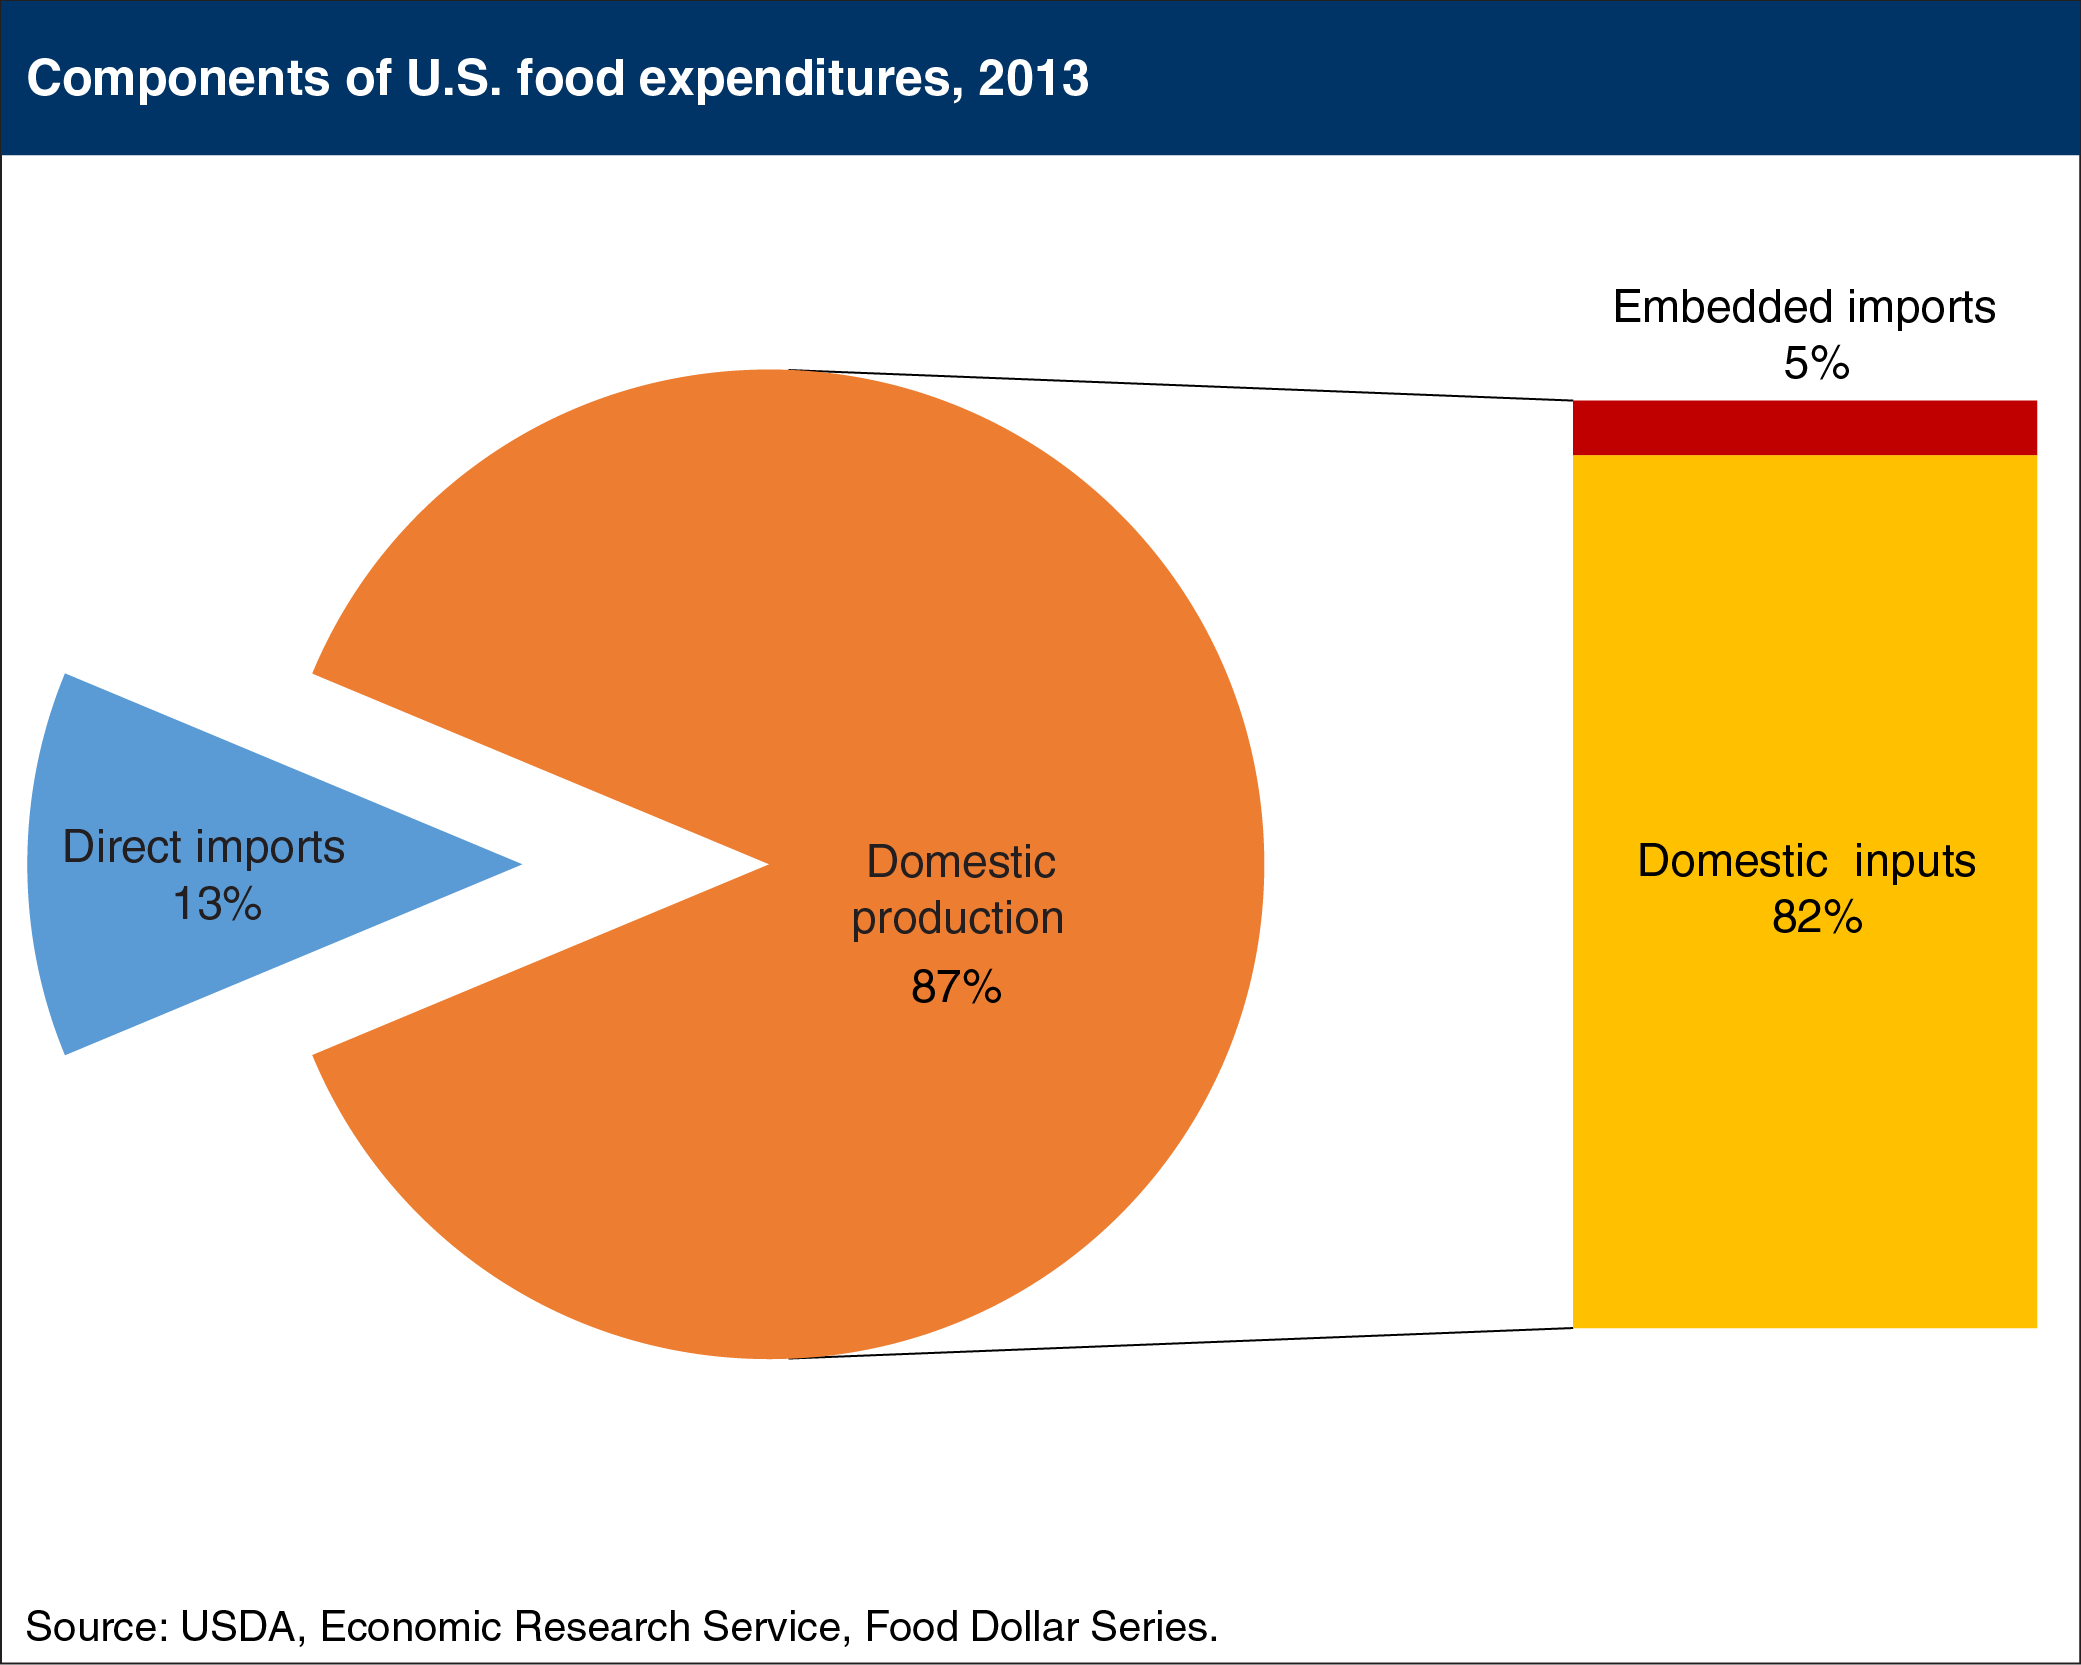
In 2013, U.S. consumers spent $1.5 trillion on food and beverages, including both grocery store and eating-out purchases. Imported food and beverages that were purchased directly by U.S. consumers (such as farm-raised shrimp from Thailand, fresh avocados from Mexico, and wines from Spain) accounted for $186.9 billion—13 percent of this total. The remaining 87 percent ($1.3 trillion) was spent on domestically-produced food and beverages. Food and beverages produced in the United States rely not only on domestic inputs, but also on embedded imports. Embedded imports are food ingredients and non-food inputs that are imported and used throughout the U.S. food system. For example, cranberries are imported from Canada and then used as an ingredient in U.S. fruit juice production. Likewise, foreign-produced cookware and refrigerators are purchased by U.S. restaurant owners and are examples of embedded imports in the U.S. food system. In 2013, $76.6 billion of embedded imports were used, accounting for 5 percent of total U.S. food spending. This chart appears in “Accounting for Direct and Embedded Imports in the U.S. Food and Beverage Dollar” in ERS’s July 2015 Amber Waves magazine.