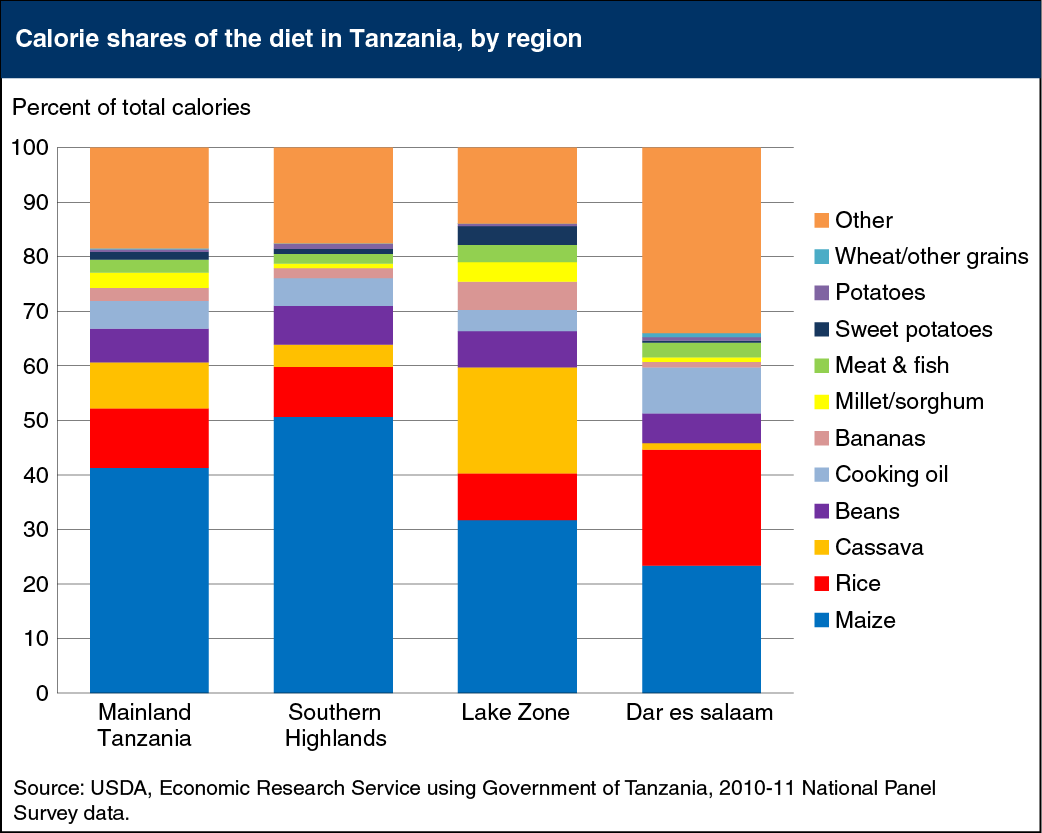
Calorie shares of the diet in Tanzania, by region
- by Nancy Cochrane and Anna D'Souza
- 4/21/2015

Food consumption patterns vary widely across different regions of Tanzania, leading to significant differences in food basket costs and impacts of changes in food prices. Understanding these consumption patterns is key to measuring access to food in developing countries and supports U.S. policies targeting global food security. ERS analyzed consumption patterns nationally and for three regions: the business capital Dar es Salaam, the Southern Highlands, and the Lake Zone in the northwestern corner of the country. On average, the Tanzanian diet relies heavily on starchy staples, with maize providing over 40 percent of household calories. But maize accounts for 51 percent of total calories in the Southern Highlands, where it’s produced in surplus, and just 32 percent of calories the deficit producing Lake Zone. In the Lake Zone, cassava is the other key staple, providing about 19 percent of total calories. Rice, beans, and cooking bananas are also important to the Tanzanian diet;in most areas, beans are the main source of protein. Total food basket costs are lowest in the Southern Highlands and highest in Dar es Salaam. This chart is based on data found in Measuring Access to Food in Tanzania: A Food Basket Approach.

