
Rural and urban unemployment rates follow similar trends
- by Thomas Hertz
- 1/20/2015
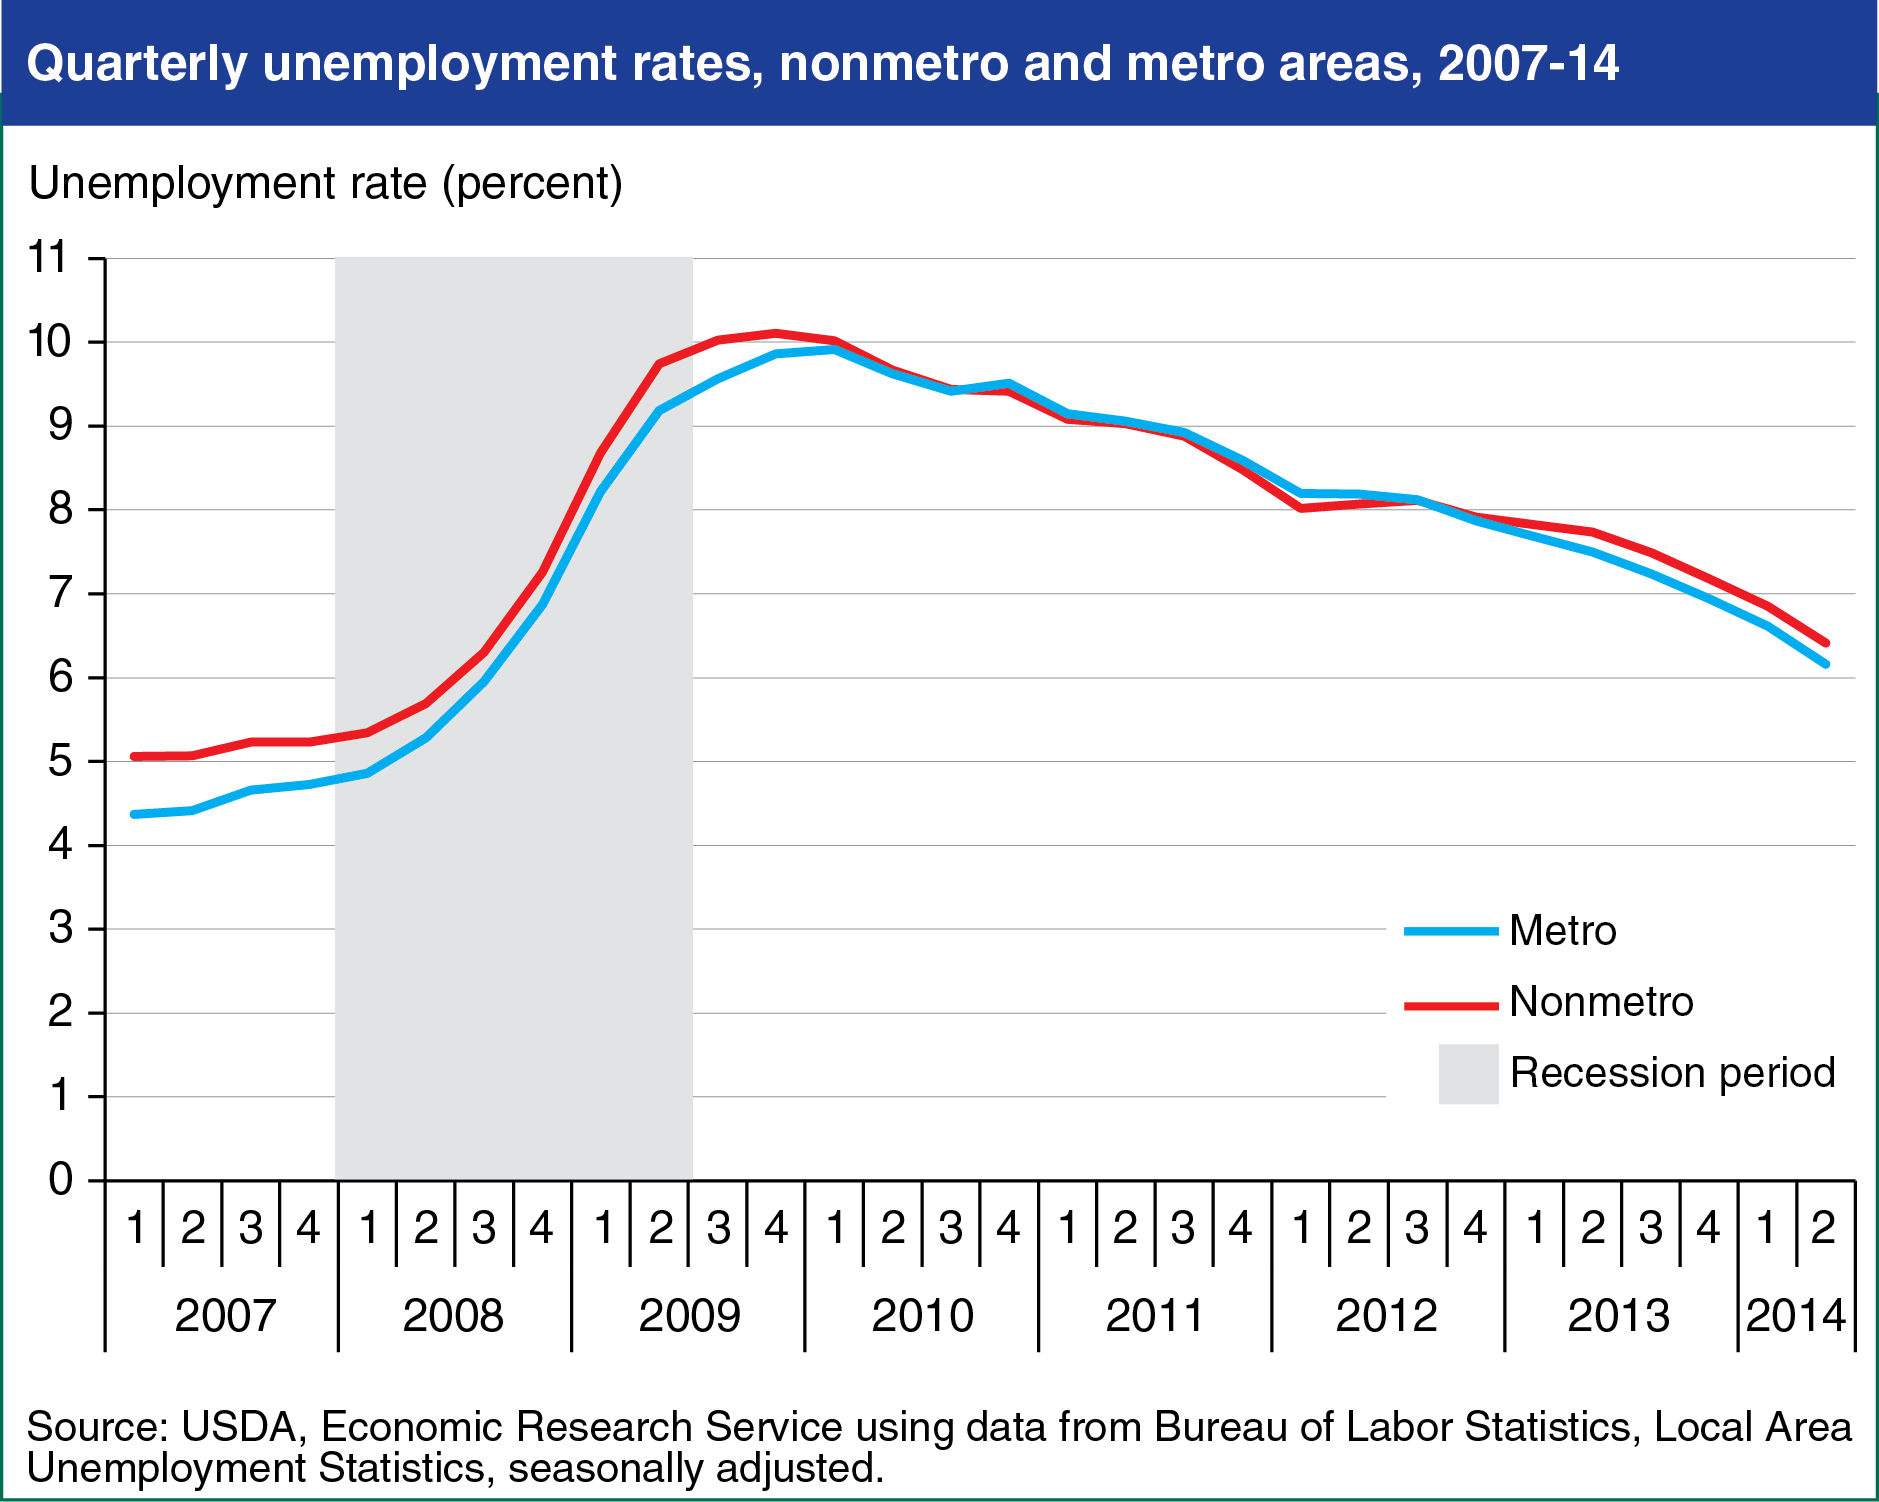
Both urban (metro) and rural (nonmetro) unemployment rates have dropped since the highs reached at the end of the most recent recession. In 2007, the rural unemployment rate averaged 5.1 percent, compared to 4.5 percent in urban areas. As the recession unfolded, metro and nonmetro unemployment rates rose rapidly and converged, peaking at 10 percent in the first quarter of 2010. Since that time, the two unemployment rates have followed similar downward trends. The seasonally adjusted rural unemployment rate stood at 6.4 percent in the second quarter of 2014, while the urban rate fell to 6.2 percent. Until recently, the bulk of the decline in the rural unemployment rate is due to a reduction in the number of people seeking work, not an increase in the number of people working. This chart is found in the October 2014 Amber Waves feature, "Rural Employment in Recession and Recovery."