
The percent of rural households with Internet at home varies across the Nation
- by Economic Research Service
- 7/29/2013
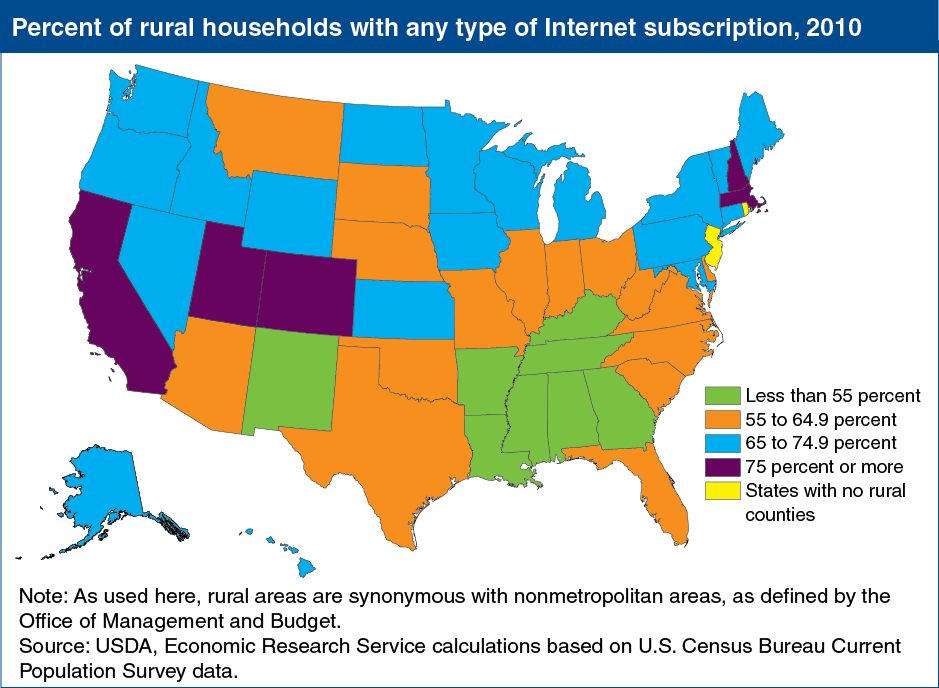
By 2010, 73 percent of U.S. urban households had home subscriptions to the Internet, compared with only 62 percent of rural households and farms, according to Current Population Survey (CPS) data. Rural Internet usage, however, is not uniform across the country. On average, rural households in the Northeast and West are more likely to have some form of inhome access to the Internet, while households in the rural South are the least likely to subscribe. The regional disparity in subscriber rates reflects, to some degree, demographic differences such as income, education, and age. Among rural households that use the Internet, broadband adoption rates (not shown here) are lowest in Appalachia and in several areas—such as Michigan and South Carolina—that experienced the highest unemployment rates during the Great Recession of 2007-09. Rural broadband adoption rates are uniformly below corresponding statewide urban rates. This map is found in the ERS report, Rural Broadband At A Glance, 2013 Edition, June 2013.
We’d welcome your feedback!
Would you be willing to answer a few quick questions about your experience?